
Example 1. Pyramid Charts Software
Pyramid Chart library objects:
Pyramid Diagrams library from the Pyramid Diagrams solution includes 28 vector pyramid objects of various types that will help you design your Pyramid Charts in minutes.

Example 2. Pyramid Diagrams Library Design Elements
Example for the Pyramid Diagram

Example 3. Pyramid Charts - Market Value Pyramid
This market value pyramid diagram has 5 levels:
- Essence (Who we are),
- Competitive positioning (Where we play),
- Customer benefits (Value proposition),
- Product / Service features (Value delivery),
- Internal capabilitiea (Value requirements),
and can be successfully used to develop your marketing strategy.
Free Download Pyramid Chart Software and View All Examples

Example 4. Pyramid Charts - Graham's Hierarchy of Disagreement
This sample was created in ConceptDraw DIAGRAM using the Pyramid Diagrams Solution and shows the Graham's hierarchy of disagreement. An experienced user spent 5 minutes creating every of this sample. You can find this sample in ConceptDraw STORE.
Use the Pyramid Diagrams solution to illustrate your documents, infographics, presentations and websites with pyramid charts, triangle charts and triangular diagrams using ConceptDraw DIAGRAM diagramming and vector drawing software.
The Pyramid Diagrams and Charts produced with ConceptDraw DIAGRAM drawing tools are vector graphic documents and are available for reviewing, modifying, and converting to a variety of formats (image, HTML, PDF file, MS PowerPoint Presentation, Adobe Flash or MS Visio).
TEN RELATED HOW TO's:
Any hierarchical structure of any company can be represented as a triangle or a pyramid. You can create a pyramid diagram and pyramid chart of any complexity using special libraries included in ConceptDraw DIAGRAM. Actually, any knowledge or chain of facts can also be depicted as a pyramid.
A wide range of graph and chart are utilized in marketing to maintain documentation and various visual issues, that deal with marketing information and data. The marketing value pyramid can be created to illustrate how the value of company, or product is based on its competitiveness. To design this diagram we used ConceptDraw DIAGRAM drawing tools in conjunction with Pyramid solution for Solution Park.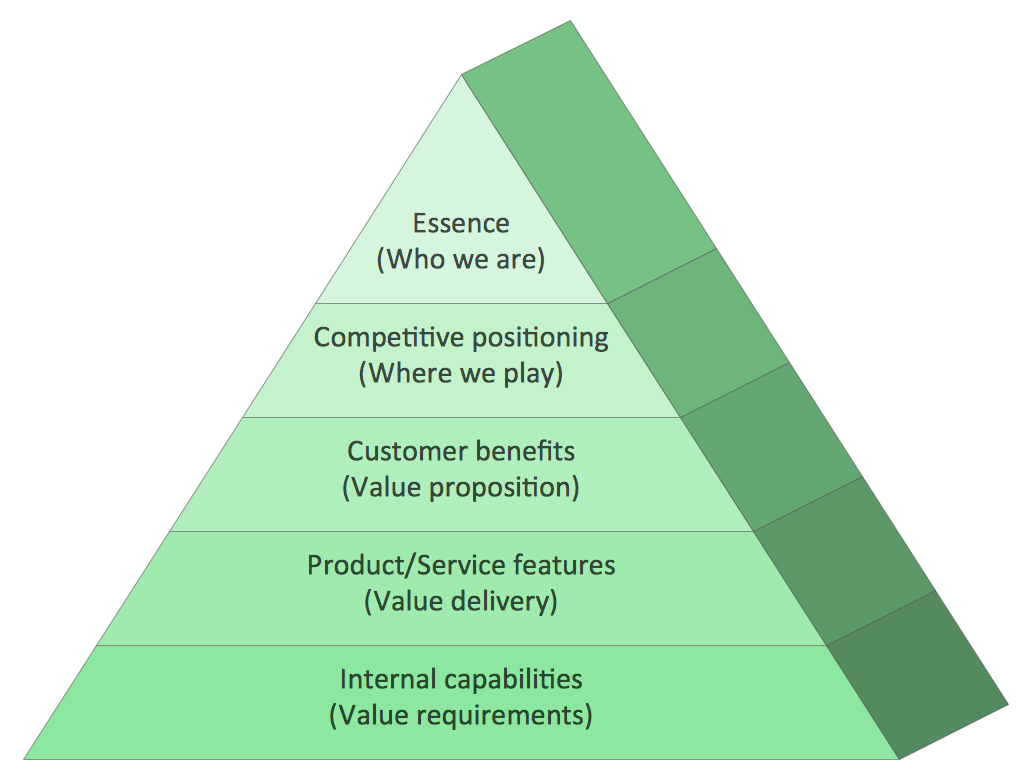
Picture: Pyramid Diagram and Pyramid Chart
Related Solutions:
It is impossible to imagine the biology science without drawings. Drawings are very convenient way to explain the different biological knowledge and processes. If you dream to design any biology drawing quick and easy – the ConceptDraw DIAGRAM software is exactly what you need.
ConceptDraw DIAGRAM diagramming and vector drawing software extended with Biology solution from the Science and Education area offers the useful tools for easy biology drawing.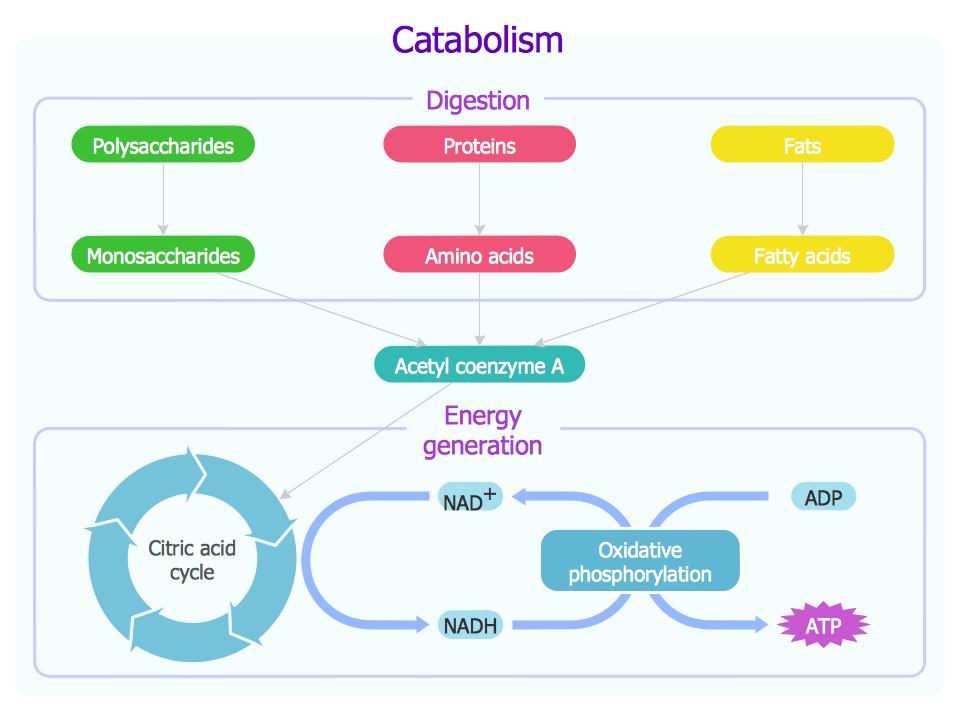
Picture: Biology Drawing
Related Solution:
To your mind, deliberation about the profits of creating organizational charts takes more time than actually creating itself. If lack of software is the only thing that stops you, you should know that organizational charts with ConceptDraw DIAGRAM are created within a few minutes. Owing to the great number of ready-to-use templates, you’ll get your chart easily.
Chart is a very handy format for visually depicting official relations of an organization. Usually, an Orgchart (organizational chart) consists from simple geometrical shapes, containing an information on a position, personal data, and the lines that means responsibilities and accountabilities associated with position. ConceptDraw solution designed for making organizational charts enables one to create various org charts effortlessly using special templates and vector libraries.
Picture: Organizational Charts with ConceptDraw DIAGRAM
Related Solution:
Those triangles within any technical analysis are known to be the chart patterns that can be commonly found in the price charts of the financially traded assets, such as stocks, futures, bonds, etc. The pattern is known to be deriving its name from the fact that it is characterized by some contraction in a price range being the converged trend lines, giving it a triangular shape.
Picture: Pyramid Diagram
Related Solution:
When thinking about the process of decision making, it's easy to imagine it as a pyramid. We will look at a three level pyramid model as an example. Operational decisions are first that come to mind, and it's the first level. Tactical and strategic decisions are the second and the third levels.
Pyramid (triangle) diagrams are used to show some hierarchical data. Because to the pyramid form of diagram, each diagram slice has a different width. The width of each segment depends on its hierarchical level.
The current image illustrates the model of information system types. Most graphically the model can be represented as a three level pyramid. The first level shows a system of transaction processing It is concentrated on operational tasks. The second level is devoted to tactical solutions of the information system management. And at least, the third level addresses strategy and represents the executive information system. This three level pyramid sample is supplied with the ConceptDraw Pyramid Diagrams solution from Marketing area of ConceptDraw Solution Park.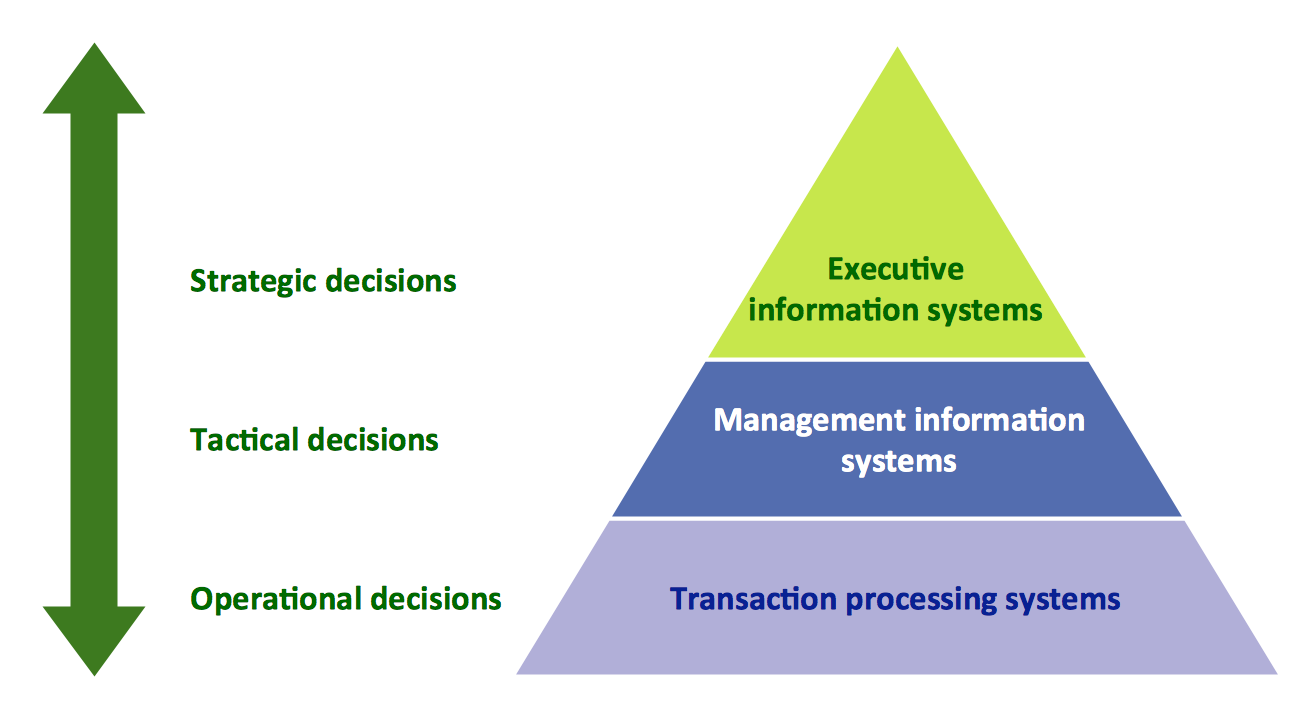
Picture: Pyramid Diagram
Related Solutions:
Pyramid chart example is included in the Pyramid Diagrams solution from Marketing area of ConceptDraw Solution Park.
Picture: Pyramid Diagram
Related Solutions:
When we think of an hierarchy, we intuitively imagine a pyramid. Thus, a lot of management tools use pyramid charts as examples or illustrations of various documents or models. You can create any type of triangle diagram using ConceptDraw DIAGRAM.
A triangle (pyramid) diagram is often used in marketing to show the data hierarchy. This pyramid diagram represents the Top Brand Model. It illustrate the model of rebranding strategy. It can be used by marketing agency dealing with rebranding strategies development. It’s critical for marketing diagrams to be both clear and eye catching. ConceptDraw Pyramid diagrams solution meet all these requirements and can be successfully applied for creating and presenting various marketing pyramidal diagrams.
Picture: Pyramid Chart Examples
Related Solutions:
Easy charting software comes with beautiful chart templates and examples. This makes it easy to create professional charts without prior experience.
Picture: Chart Templates
pyramida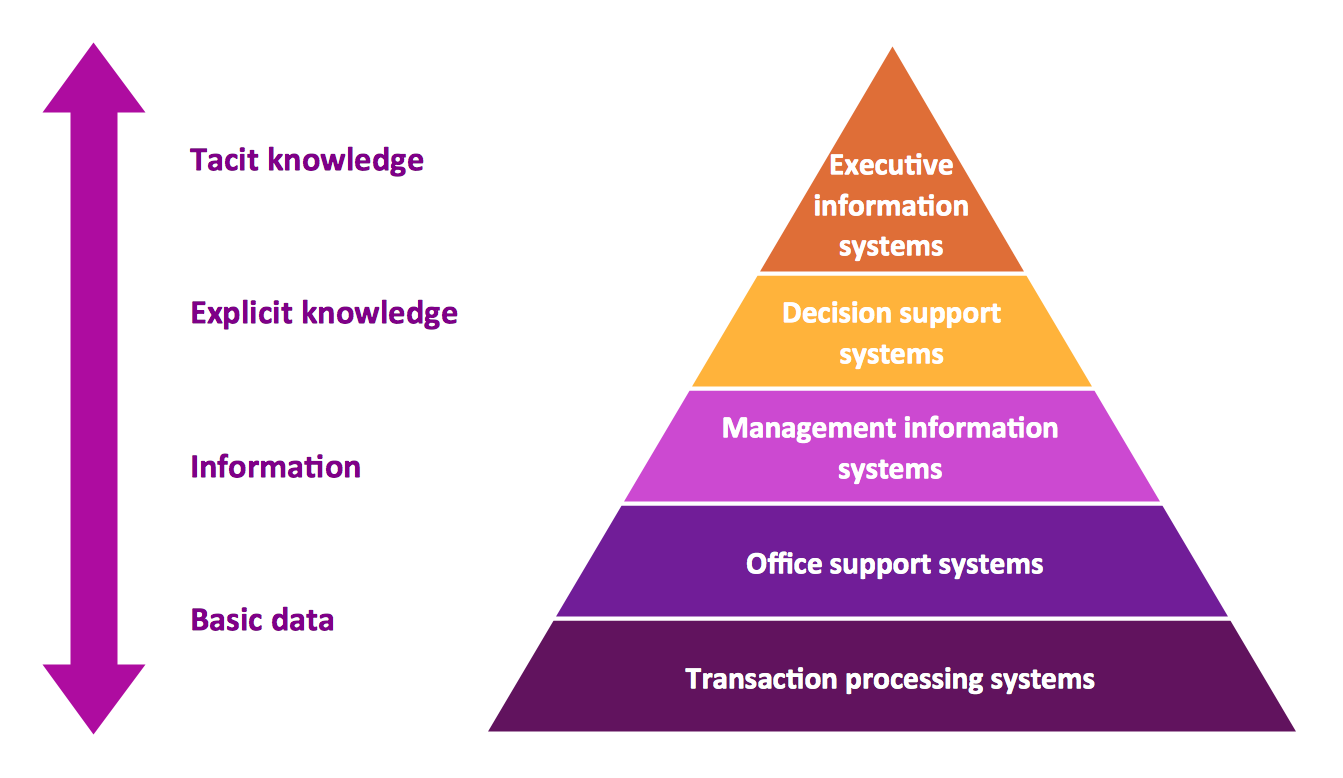
Picture: Pyramid Diagram
Related Solution:
This pyramid chart example is supplied with the ConceptDraw Pyramid Diagrams solution. This is a model of Information Management Systems classification. It is made in a form of a four-level pyramid. The top level shows the information system developed for an executive management. Below, there is a level depicting the system of decision making process for the managers of the senior level. A schematic representation of the middle management information system, following to logic, is in the middle of the pyramid. And at least, the lowermost level represents an information processing system for employees.
Picture: Pyramid Diagram
Related Solutions:


