Pyramid Diagram
Triangular Graphic
ConceptDraw DIAGRAM software is the one used by so many different professional specialists, involved in so many different field of the business activities world widely, such as the computing engineering, such as an English computer scientist Paul Graham was, the one, “inventing” the so called “disagreement hierarchy”.
Paul Graham was born in1964 and he was widely known as not only the computer scientist, but also as entrepreneur, the venture capitalist, the author as well as the blogger. Best known for his work on “Lisp”, his startup which was first called as “Viaweb” and later renamed to the "Yahoo! Store", was also the co-founder of the influential start-up accelerator and seed capital firm Y Combinator. He wrote a few programming books, including the one called “On Lisp” issued in 1993, “ANSI Common Lisp”, written in 1995 and the one finished in 2004 named “Hackers & Painters”. Being described as a “hacker philosopher”, in 1996 Graham founded “Viaweb” together with Robert Morris, which became the first application service provider — ASP. The mentioned software was originally written mainly in “Common Lisp”. It allowed its users to be able to make their own digital stores on Internet, being sold to Yahoo! for 455,000 shares of Yahoo! Stock for USD49,6 million. And so renamed to become a “Yahoo! Store”.
Later on, he gained his fame for the written essays on his popular website. Their subjects ranged from the "Beating the Averages", where he introduced the hypothetical programming language “Blub” as well as compared “Lisp” to the other programming languages, to writing about the nerd life in high school naming the text as "Why Nerds are Unpopular". Some of his essays were published as “Hackers & Painters”, including a discussion of the growth of “Viaweb” as well as the one about the advantages of “Lisp”.
In 2001, Graham started to work on a new dialect of Lisp — “Arc”. Since then, he has written a few more essays describing the goals and the features of the language, as well as some internal projects at “Y Combinator”. “Arc” became most notable by the Hacker News web forum as the news aggregator program and in 2005, Graham and Trevor Blackwell, Robert Morris as well as Jessica Livingston started a “Y Combinator” providing the so called “seed funding” to a large number of start-ups, investing in more than 1300 of them, including Xobni, Dropbox, Airbnb, Stripe and Justin.tv.
To be clear, the seed funding, known also as “seed money” or “seed capital”, is a form of securities, where an investor invests his capital in exchange for an opportunity to get the equity stake in the desired company. The term “seed” itself hints on it to be a very early investment, meaning it is expected to support the new business until it becomes capable to generate cash of its own. Such business also can be financed until it is ready for the further investments once it has a stable “base”. The so called “seed money options” may include family or/and friends funding as well as angel funding and crowdfunding.
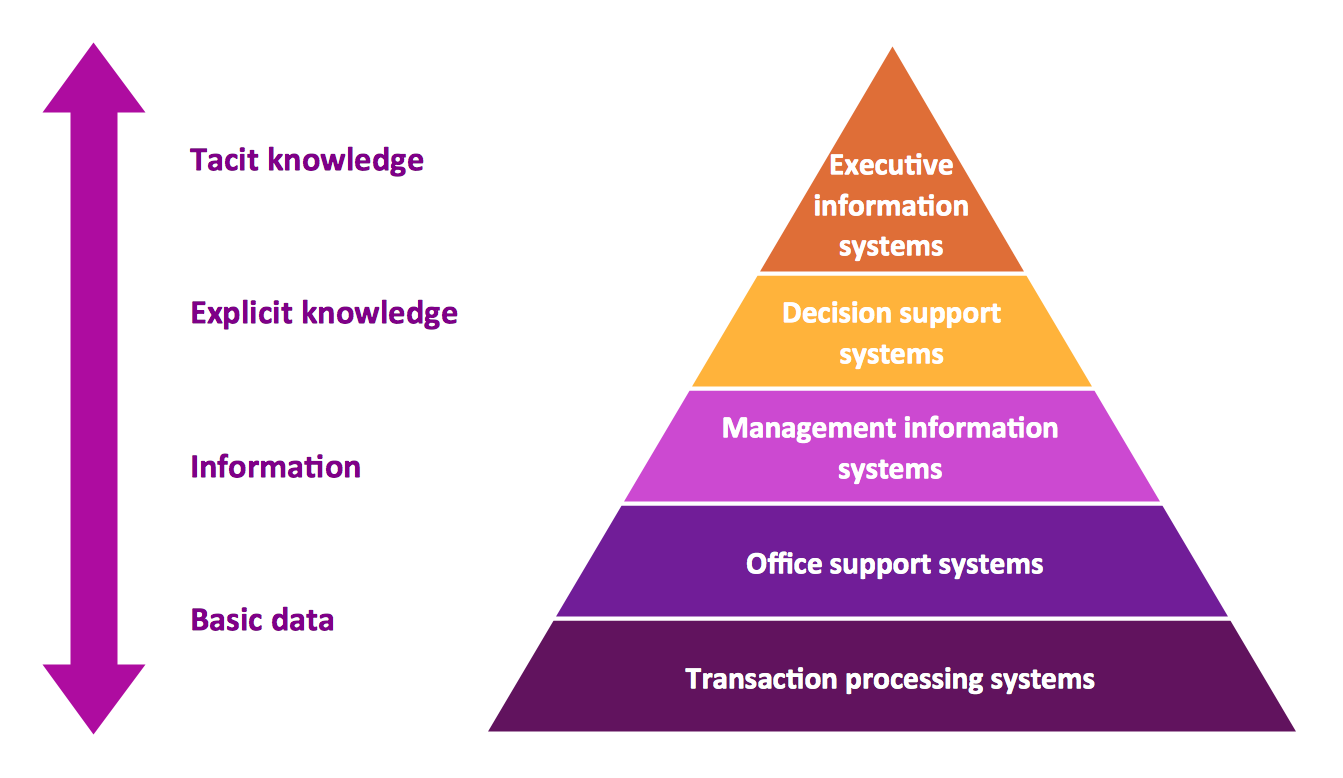
The most popular idea of Graham was the so called “hierarchy of disagreement”, which he proposed in 2008 in his essay named "How to Disagree". Describing his idea, Graham was putting the types of argument into a seven-point hierarchy, observing that once moving up the disagreement hierarchy can make people less mean, then it can make them happier, suggesting that the described hierarchy can be thought as a pyramid. The hierarchy reminds of the Friedrich Glasl's model of conflict escalation, which is the one used for assisting in the analysis of conflicts. The Friedrich Glasl's model has nine stages, which are grouped into three levels. Each of the levels contain three stages. When the pyramid suggested to be used by Graham is the one having seven stages: the one on the top is the Central Point, the one under – the refutation, then Counterargument, which is the one contradicting and so backing up with reasoning and supporting the evidence, later there’s another level — Contradiction, stating the opposing case with little supporting evidence. The lower level is a so called “Responding to Tone” one, including the critics of the writing without addressing the substance of the argument itself. Then, after “Responding to Tone”, there’s a lower level known to be called as “Ad Hominem”, on which there are the attacks of the characteristics of the writer take place, with no addressing the substance of the argument itself. And the last, the bottom one is the “Name-calling” level.
All the mentioned levels can be described in details within the mentioned hierarchy created in ConceptDraw DIAGRAM drawing software. The mentioned professional drawing tool is the one being most recently very much developed, including the development of the new tools, such as the design elements and symbols, which all can be used for making the smart as well as the professionally looking drawings, including the triangular diagrams and pyramids, such as the one described before.

Example 1. Pyramid Diagram. Graham's-hierarchy-of-disagreement
Having ConceptDraw DIAGRAM software downloaded from this site, you can also always download another product of CS Odessa — the ConceptDraw STORE application, used for storing all the freshly developed graphic objects as well as the examples of the previously created diagrams, including the triangular one, such as the pyramids, for example. Having one of the best drawing applications nowadays, known to be a unique software for a reason of providing all the necessary tools to its users, ConceptDraw DIAGRAM one was developed for a purpose of enabling all CS Odessa clients to make only great looking drawings even if none of them has at least some experience in making such pyramids. Thus, getting the needed solution, such as the Pyramid Diagrams one, will enable you to make any needed Pyramid Diagrams within only a few minutes as long as you use the pre-made examples, available in the mentioned solution as the drafts for your own smart looking drawings.
See more Pyramid Diagram:
- Zooko Triangle Diagram
- Time, Quality, Money Triangle Diagram
- Project Triangle Diagram
- Purchase Funnel Diagram
- Project Triangle Chart
- Priority Pyramid Diagram
- Organization Triangle Diagram
- Knowledge Triangle Diagram
- Triangular Graphic
- Inverted Pyramid
- Fundraising Pyramid
- 3D Triangle Diagram
- DIKW Pyramid
- Five level pyramid model
- Four level pyramid model
- Three level pyramid model


