Quality Management Tools
ConceptDraw DIAGRAM diagramming and vector drawing software offers at your disposal quality management tools of the Total Quality Management (TQM) Diagrams solution from the Quality area of ConceptDraw Solution Park which will help facilitate a drawing diagrams process for quality management.
-Diagram-in-SolutionBrowser.png)
Example 1. Quality Management Tools
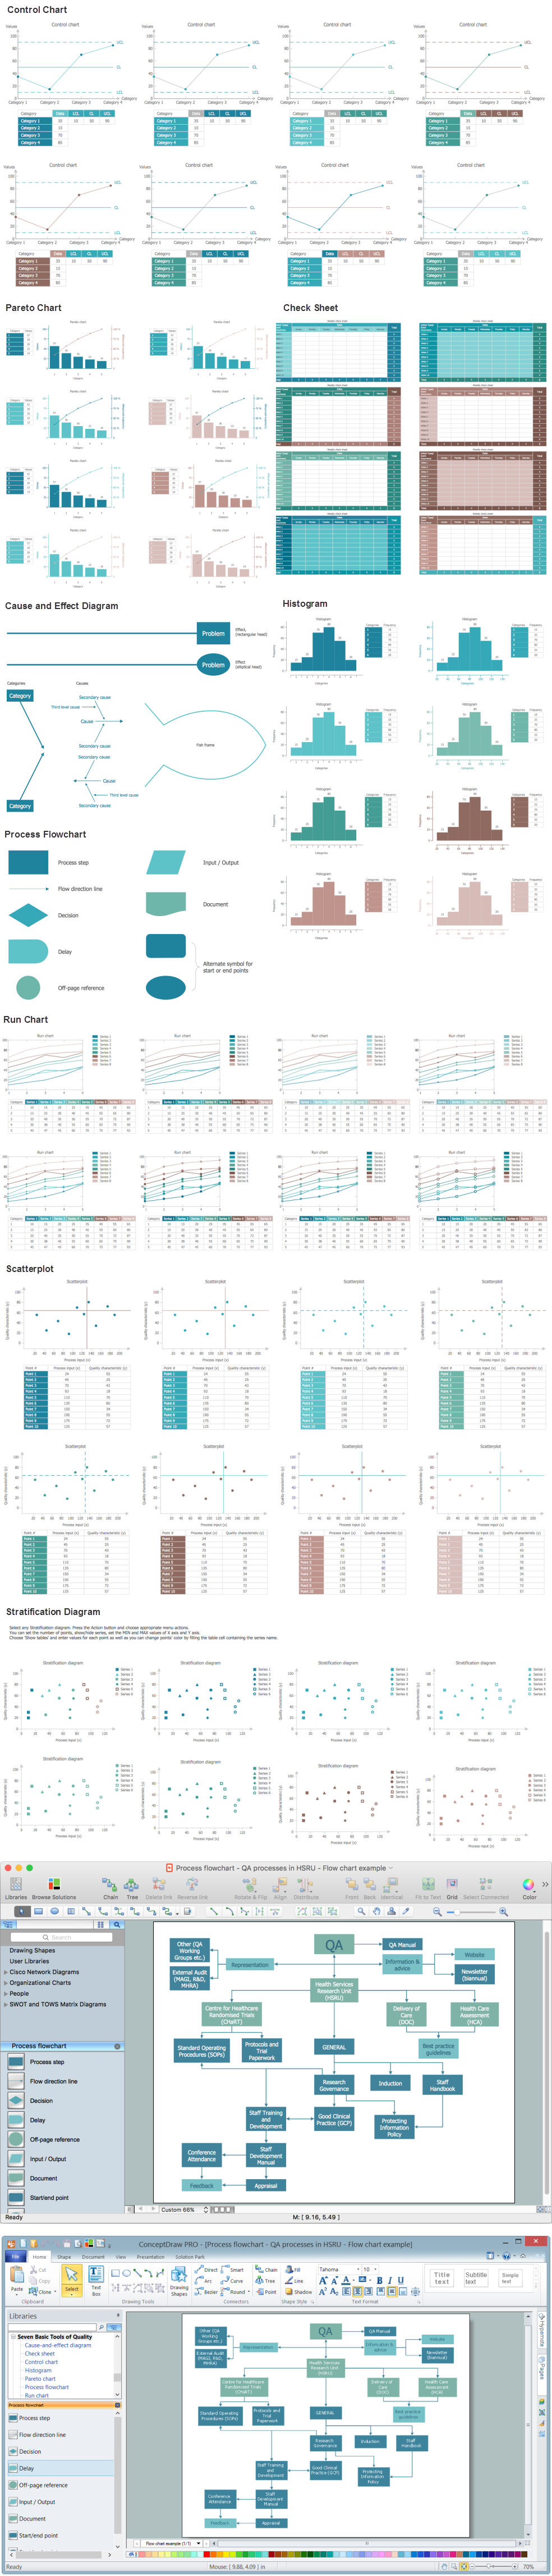
How many professional looking samples includes the Total Quality Management (TQM) Diagrams Solution ! All they were designed specially for ConceptDraw DIAGRAM users and are available for viewing and editing from ConceptDraw STORE.

Example 2. TQM Diagram Library Design Elements
Extensive quality management tools, TQM Diagram library with numerous predesigned vector shapes included in Total Quality Management (TQM) Diagrams Solution can also greatly facilitate drawing process. All that you need is simply create new document and drag the needed objects from the library to make your own professional looking and successful Total Quality Management Diagram.

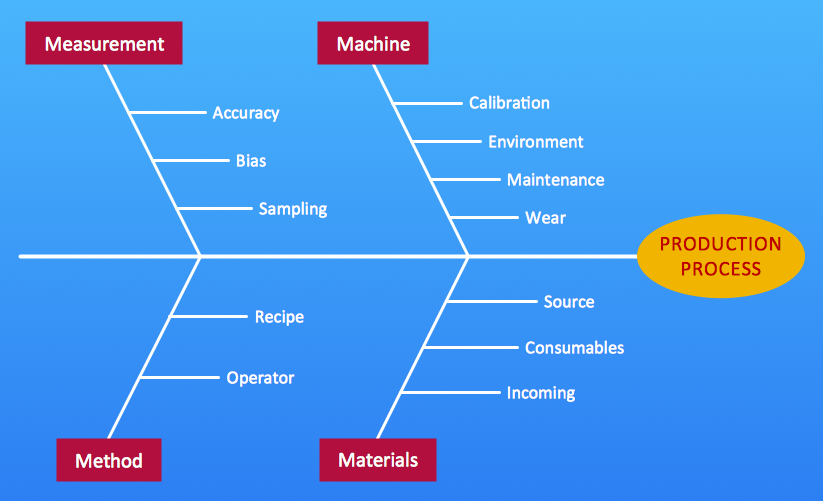
Example 3. TQM Diagram
This TQM sample was created in ConceptDraw DIAGRAM software using the quality management tools of the Total Quality Management (TQM) Diagrams Solution. It successfully demonstrates solution's capabilities and professional results you can achieve using it. An experienced user spent 10 minutes creating this sample.
Use the Total Quality Management (TQM) Diagrams Solution for ConceptDraw DIAGRAM software to create your own TQM diagrams, schemes and drawings quick, easy and effective.
All source documents are vector graphic documents. They are available for reviewing, modifying, or converting to a variety of formats (PDF file, MS PowerPoint, MS Visio, and many other graphic formats) from the ConceptDraw STORE. The Total Quality Management (TQM) Diagrams Solution is available for all ConceptDraw DIAGRAM or later users.