Quality Mind Map Solution
The Quality Mind Map Solution extends ConceptDraw MINDMAP with the addition of a number of Quality Management Mind Maps (Presentations, Meeting Agendas, and problem-solving techniques). These map templates are great starting points to identify, track, and address quality initiatives in your organization.
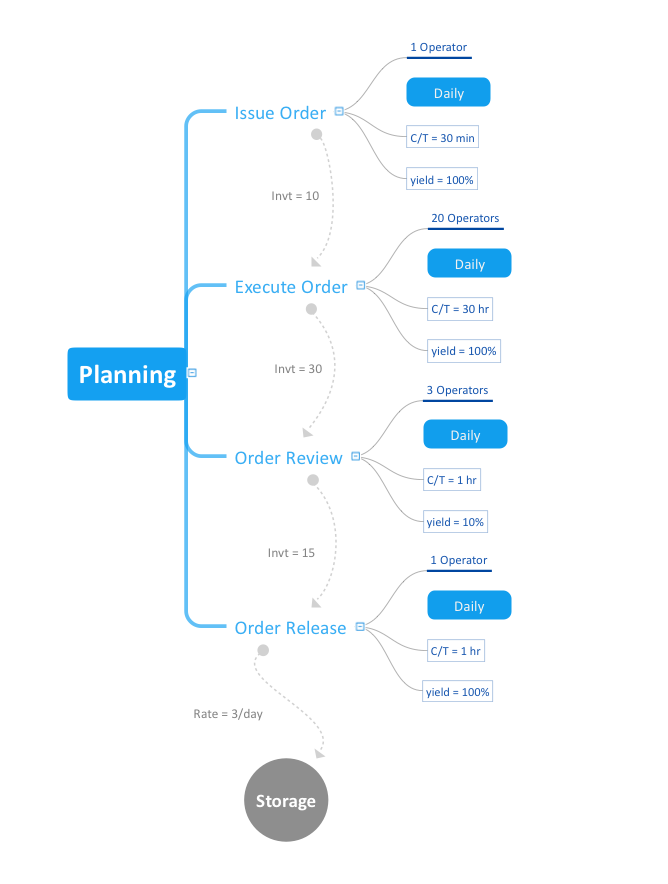
Pic.1 Mind map - Value stream mapping (VSM).
This mind map shows how Value Stream Maps can be represented as a mind map. Value Stream Maps can help a manufacturing team visualize the material and information flow required to deliver a product or a service to customers. Value Stream Maps are used in the Lean Manufacturing methodology to analyse and identify potential process improvement opportunities.
See also Samples:
TEN RELATED HOW TO's:
ConceptDraw Value Stream Maps are used in lean practice for analysis of manufacturing processes to identify the improvement opportunities.
Picture: Value Stream Analysis
Related Solution:
Professional Mind Mapping. ConceptDraw MINDMAP professional software to create documents. Mac and PC compatible. MS Office Exchange Solutions. Skype Collaboration. Presentation Tools.
Picture: One formula of professional mind mapping :input data + output data + make great presentation
Related Solution:
When planning to create a neat presentation out of lot of data, try mind mapping.
It is handy, especially when you want to represent pictures and text on the same page.
With the Presentation Exchange solution you can easily extract the content from a PowerPoint presentation to see how it all fits together in a single view. You can review slide content, see how the slides support one another, and refine the story.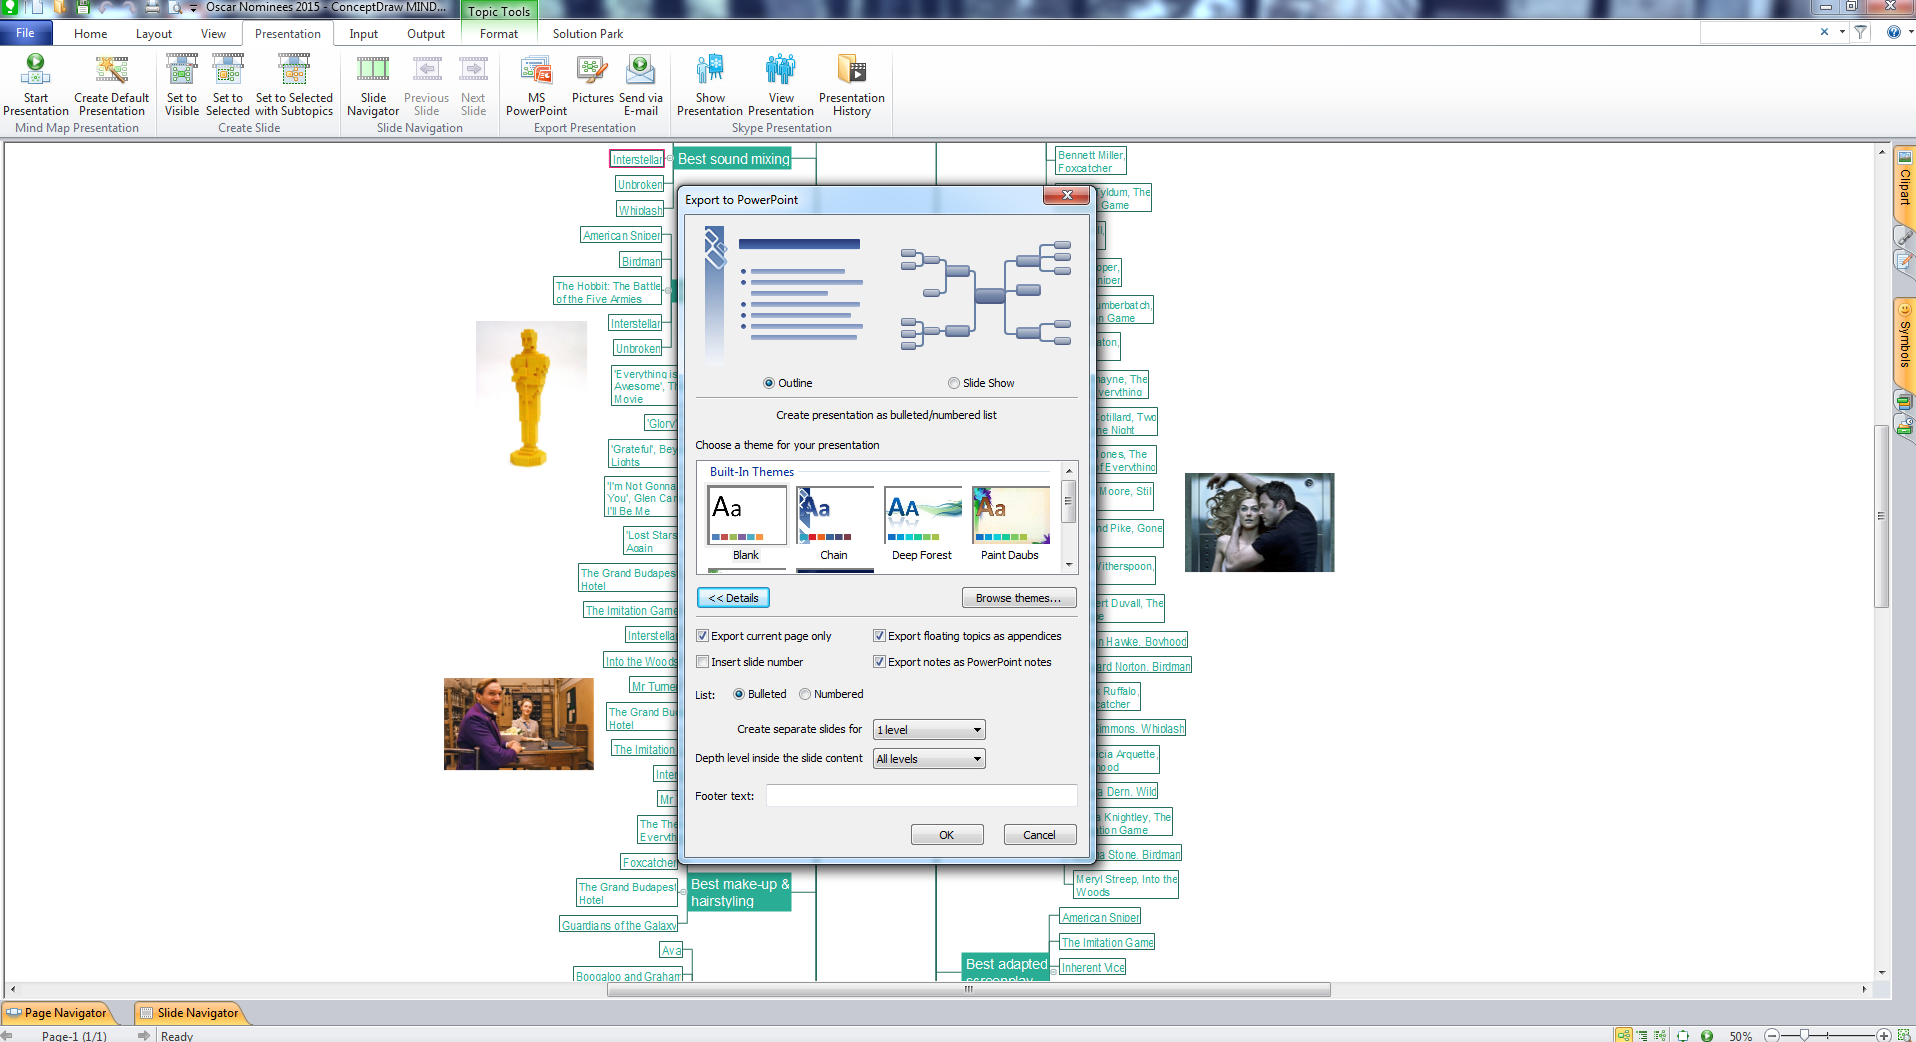
Picture: Presentation in MINDMAP All in One
Related Solution:
If you have a small budget to design a computer network, you have to be very careful. One of the most cheap technologies to implement is a bus network topology, however it has many disadvantages. For instance, if the network cable is somehow damaged, the entire network won't work.
This diagram illustrates a so-called "Bus" network topology. This type of network arrangement means that each computer or other device is linked to a main link (bus). The end nodes are shown as a circle. The links to the bus are depicted as solid vertical lines. The bus is shown as a bold horizontal line. This diagram can serve as a template for creating logical or physical network diagrams. The set of vector libraries supplied with ConceptDraw Computer and Networks solution contains the symbols of all LAN and WLAN elements required for creating network diagrams of any configuration.
Picture: Bus Network Topology
Related Solution:
The Total Quality Management Diagram solution helps your organization visualize business and industrial processes. Create Total Quality Management diagrams for business process with ConceptDraw software.
Picture: Create TQM Flowcharts for Mac
Related Solution:
Now it’s easy to share your visual documents with other people in a form most convenient for them.
ConceptDraw DIAGRAM can save your drawings and diagrams in a number of highly useful formats, including graphic files. You can save your drawing as a.PNG,.JPG, or other graphic format file.
Picture: Export from ConceptDraw DIAGRAM Document to a Graphic File
While creating flowcharts and process flow diagrams, you should use special objects to define different statements, so anyone aware of flowcharts can get your scheme right. There is a short and an extended list of basic flowchart symbols and their meaning. Basic flowchart symbols include terminator objects, rectangles for describing steps of a process, diamonds representing appearing conditions and questions and parallelograms to show incoming data.
This diagram gives a general review of the standard symbols that are used when creating flowcharts and process flow diagrams. The practice of using a set of standard flowchart symbols was admitted in order to make flowcharts and other process flow diagrams created by any person properly understandable by other people. The flowchart symbols depict different kinds of actions and phases in a process. The sequence of the actions, and the relationships between them are shown by special lines and arrows. There are a large number of flowchart symbols. Which of them can be used in the particular diagram depends on its type. For instance, some symbols used in data flow diagrams usually are not used in the process flowcharts. Business process system use exactly these flowchart symbols.
Picture: Flowchart Symbols: Meaning and Examples
Related Solution:
Diagramming software for Mac and PC - create flowcharts and presentations for Social Media Organizing.
Picture: Social Media Response DFD Flowcharts - diagramming software ( Mac PC )
Related Solution:
Drawing the diagrams we try to find in help the powerful software and now we have the ConceptDraw DIAGRAM. The ability easily create the SDL diagrams is made possible thanks to unique Specification and Description Language (SDL) Solution from the Industrial Engineering Area of ConceptDraw Solution Park. This solution extends ConceptDraw DIAGRAM 2 libraries - SDL Connectors and SDL Diagrams that contain 70 predesigned SDL flowchart symbols.
Picture: SDL Flowchart Symbols
Related Solution:
When trying to figure out the nature of the problems occurring within a project, there are many ways to develop such understanding. One of the most common ways to document processes for further improvement is to draw a process flowchart, which depicts the activities of the process arranged in sequential order — this is business process management. ConceptDraw DIAGRAM is business process mapping software with impressive range of productivity features for business process management and classic project management. This business process management software is helpful for many purposes from different payment processes, or manufacturing processes to chemical processes. Business process mapping flowcharts helps clarify the actual workflow of different people engaged in the same process. This samples were made with ConceptDraw DIAGRAM — business process mapping software for flowcharting and used as classic visio alternative because its briefly named "visio for mac" and for windows, this sort of software named the business process management tools.
This flowchart diagram shows a process flow of project management. The diagram that is presented here depicts the project life cycle that is basic for the most of project management methods. Breaking a project into phases allows to track it in the proper manner. Through separation on phases, the total workflow of a project is divided into some foreseeable components, thus making it easier to follow the project status. A project life cycle commonly includes: initiation, definition, design, development and implementation phases. Distinguished method to show parallel and interdependent processes, as well as project life cycle relationships. A flowchart diagram is often used as visual guide to project. For instance, it used by marketing project management software for visualizing stages of marketing activities or as project management workflow tools. Created with ConceptDraw DIAGRAM — business process mapping software which is flowcharting visio alternative or shortly its visio for mac, this sort of software platform often named the business process management tools.
Picture: Process Flowchart: A Step-by-Step Comprehensive Guide
Related Solution:
ConceptDraw
MINDMAP 16