UML Use Case Diagram Example. Registration System
The use case diagram (behavior scenarios, precedents) is the initial conceptual representation of the system during its design and development. This diagram consists of actors, use cases and relationships between them. When constructing a diagram, common notation elements can also be used: notes and extension mechanisms.
The essence of this diagram is as follows: the designed system is represented as a set of actors interacting with the system using the so-called “use cases”. In this case, an actor (acting person, actant, artist) is any object, subject, or system that interacts with a simulated system from the outside. In turn, the “use case” is a specification of the services (functions) that the system provides to the actor. In other words, each “use case” defines a certain set of actions performed by the system when interacting with an actor. At the same time, the model does not reflect in any way how this set of actions will be implemented.
In the structural approach, the analogue of the use case diagram is IDEF0 and DFD diagrams, use-work options (IDEF0) and processes (DFD), and actors — external entities (DFD).
This sample was created in ConceptDraw DIAGRAM diagramming and vector drawing software using the UML Use Case Diagram library of the Rapid UML Solution from the Software Development area of ConceptDraw Solution Park.
This sample shows the types of user’s interactions with the system and is used at the registration and working with the database system.

Example 1. Registration System. UML Use Case Diagram
Using the libraries of the Rapid UML Solution for ConceptDraw DIAGRAM you can create your own visual vector UML diagrams quick and easy.
UML Resource:
TEN RELATED HOW TO's:
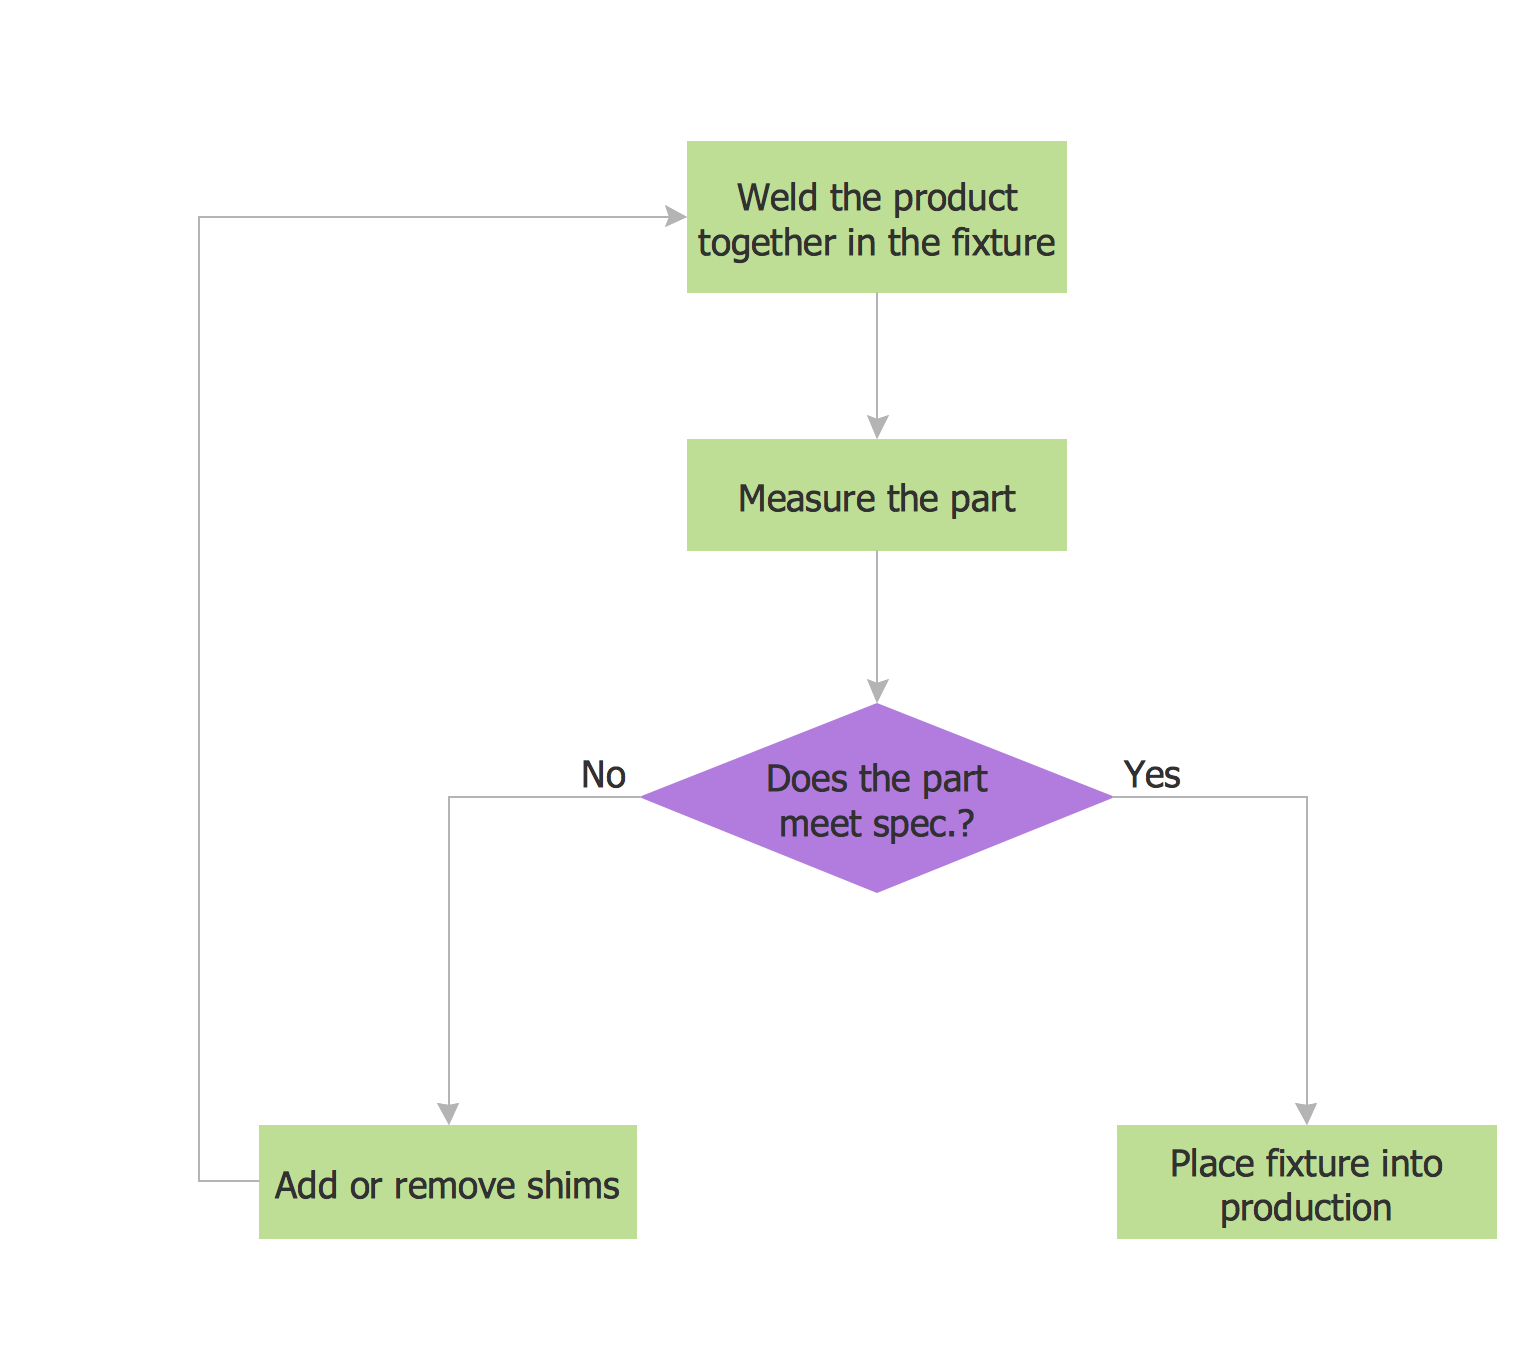
A flowchart is a simple but very functional tool when it comes to understanding a workflow or to removing unnecessary stages from a process. When drawing flowcharts, keep in mind that there are four common types of flowcharts, like document flowcharts and data flowcharts that show control over a data or document flow over a system. To show controls on a physical level, use system flowcharts. In addition, to show controls in a program, you can draw a program flowchart.
This flowchart diagram represents the piece of an article editing process, that involves the author and editor. It was created using the Basic Flowchart notation that consists from the basic flowchart symbols. The start and the end of the process are indicated with "Terminator" symbols. The "Process" symbols show the action steps consisting from making edits and searching for a compromise, when the author does not agree with the suggestions of the editor. The "Process" symbol is the general symbol in process flowcharts. The "Decision" symbol indicates a branching in the process flow. There are two branches indicated by a Decision shape in the current flowchart (Yes/No, Disagree/Agree). This basic flowchart can be used as a repeating unit in the workflow diagram describing the working process of some editorial office.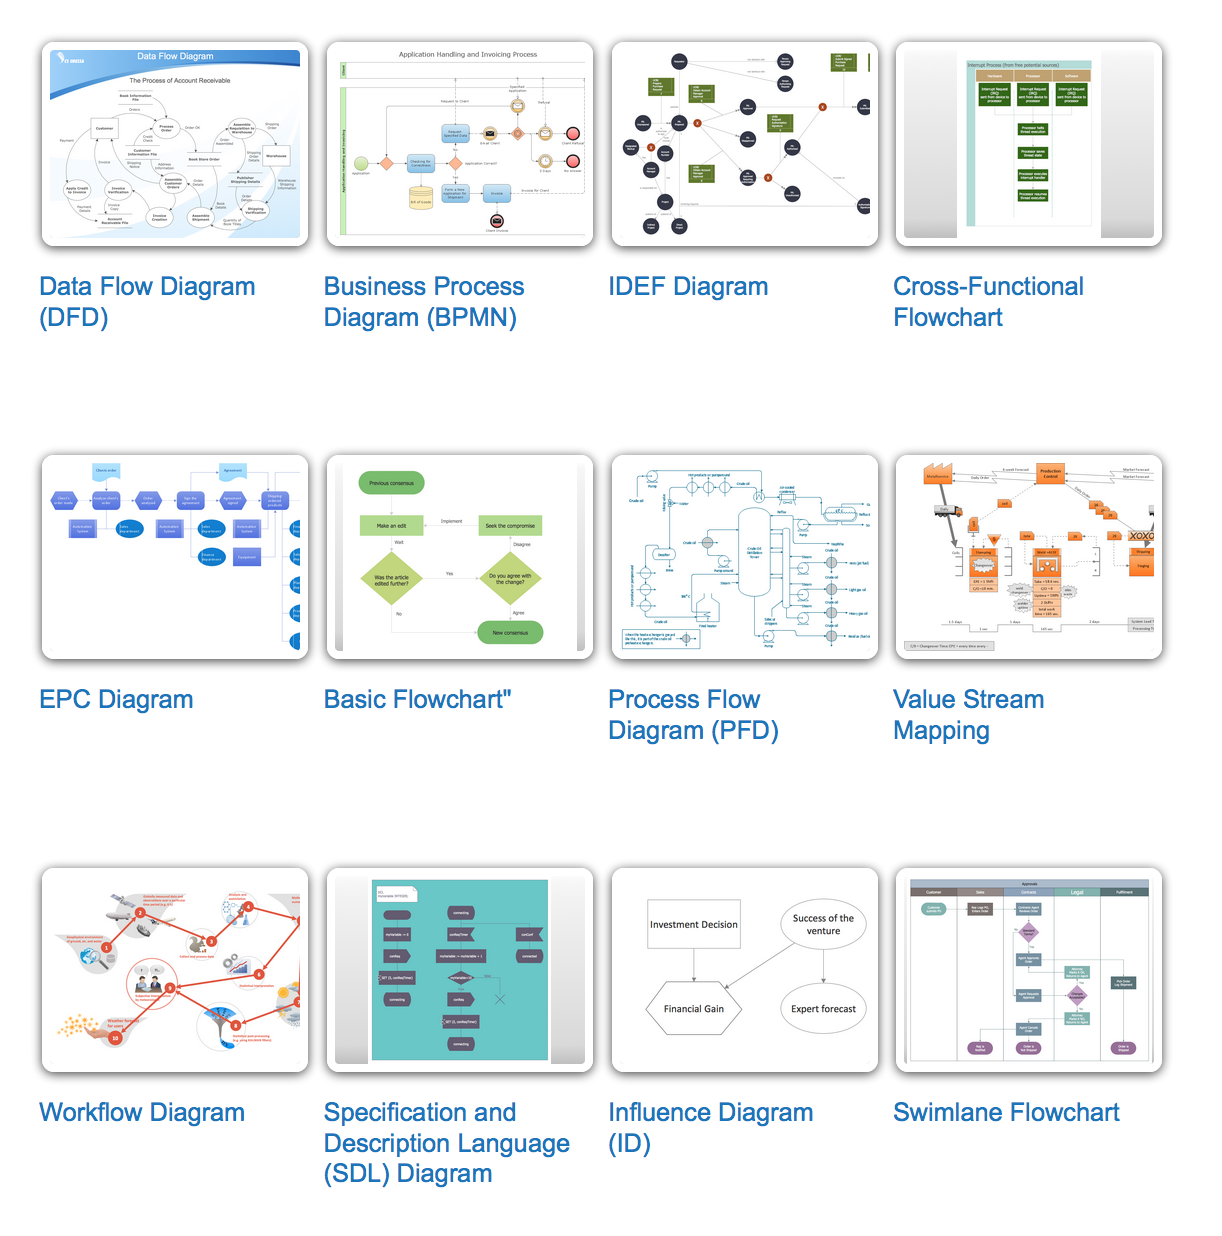
Picture: Types of Flowcharts
Related Solution:
ConceptDraw DIAGRAM diagramming and vector drawing software provides the unique Flowcharts Solution from the Diagrams Area of ConceptDraw Solution Park with variety of vector objects libraries and collection of examples Flowchart. Each example flowchart included in Flowcharts solution is a real help in drawing process, it can be the good base or perfect source of inspiration.
Picture: Examples Flowchart
Related Solution:
UML Sequence Diagram can be created using ConceptDraw DIAGRAM diagramming software contains rich examples and template. ConceptDraw is perfect for software designers and software developers who need to draw UML Sequence Diagrams.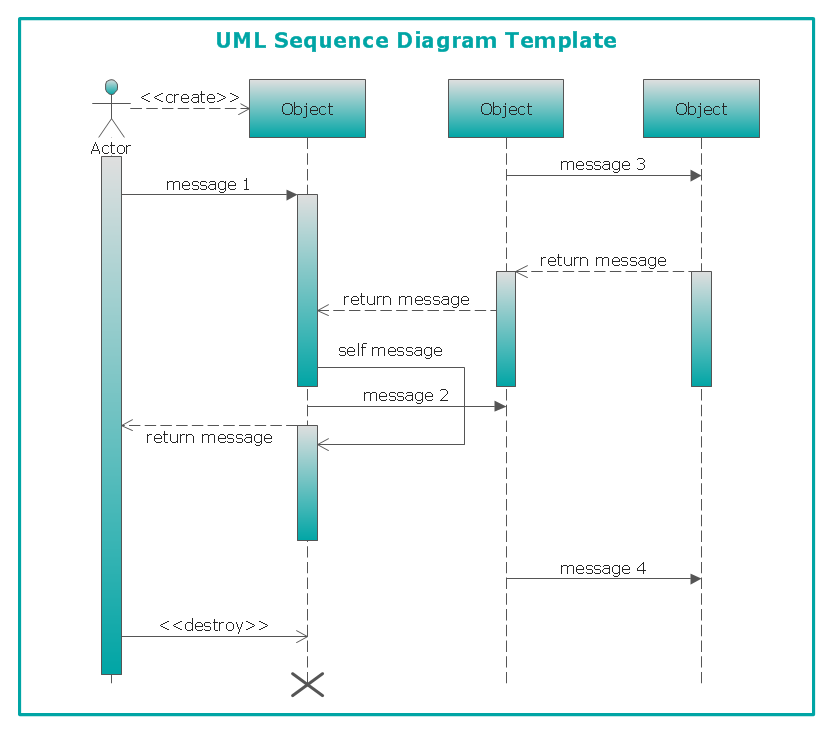
Picture: UML Sequence Diagram
Describing a workflow or approval process can take hours and be too complicated, especially since there are options to do it quickly and vividly. Diagrams called flowcharts replace long paragraphs of boring text and represent information in a graphic way. You can draw one on paper or you can use flowchart software to do it quickly and scalable. This kind of software is easy to use and you don’t need any special skills to start using it. In addition, there are a lot examples and predesigned templates on the Internet.
Flowcharts are a best tool for staking out a huge and complex process into some small readable parts. Surely, flowcharts can be drawn manually but the use of standard symbols that make it clear for a wide audience makes a software tool preferred for this task. The core for a successful flowchart is its simplicity. That is why often before beginning making flowchart through software, people draw the sketch on a piece of paper. Designing an effective flowchart means the combination of the data needed to be shown and the simplicity with which you depict it.
Picture: Flowchart Software: A Comprehensive Guide
Related Solution:
This sample shows the Flowchart that displays the layout and work flow of the cloud marketing platform. This diagram has a style of the marketing brochure. This style displays the central product that is related to the other issues.
Using the ready-to-use predesigned objects, samples and templates from the Flowcharts Solution for ConceptDraw DIAGRAM you can create your own professional looking Flowchart Diagrams quick and easy.
Picture: Flowchart Marketing Process. Flowchart Examples
Related Solution:
ConceptDraw DIAGRAM is a professional diagramming and vector drawing software. Now, enhanced with SysML Solution from the Software Development Area of ConceptDraw Solution Park, ConceptDraw DIAGRAM became an ideal software for model based systems engineering (MBSE).
Picture: Model Based Systems Engineering
Related Solution:
The UML Diagrams are widely used by developers and software engineers for professionally design and development any bank system or Automated Teller Machine (ATM) system. You need a powerful software for their design? ConceptDraw DIAGRAM extended with ATM UML Diagrams Solution from the Software Development Area of ConceptDraw Solution Park suits the best for this goal.
Picture: Bank System
Related Solution:
Event-Driven Process chain Diagrams for improvement throughout an organisation. Best software for Process Flow Diagram. The Event-driven Process Chain (EPC) Diagrams allows managers to plan processes and resources.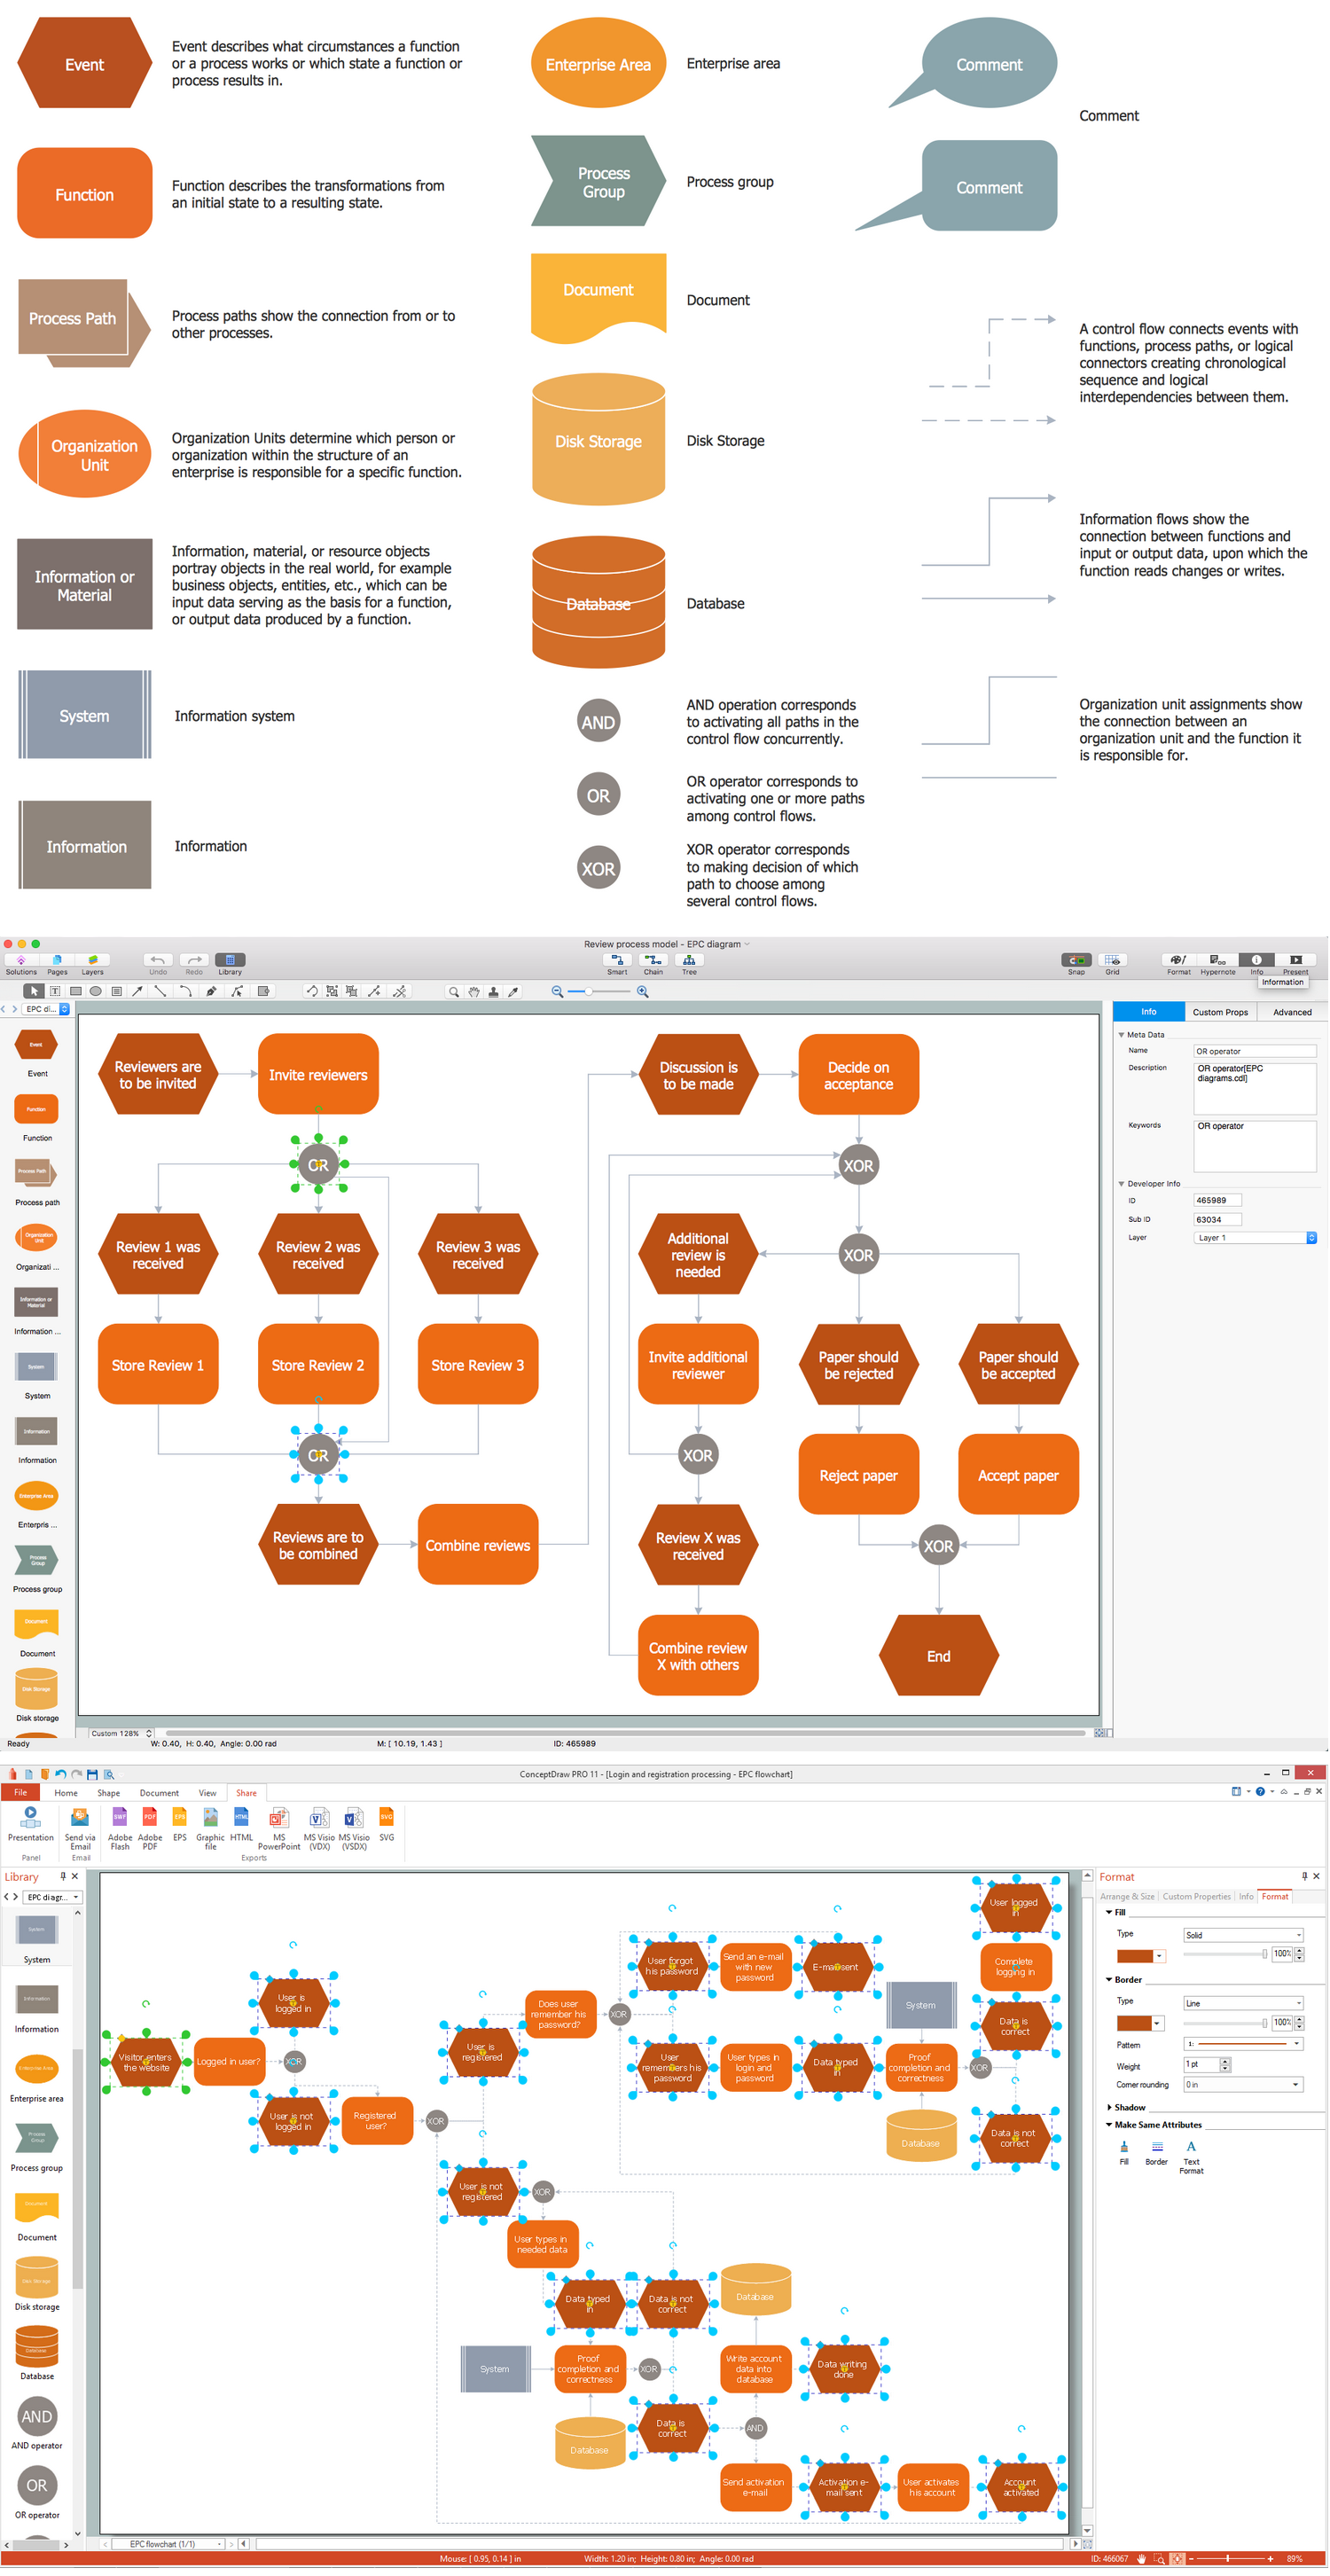
Picture: Business process Flow Chart — Event-Driven Process chain (EPC) diagrams
Related Solution:
This sample was created in ConceptDraw DIAGRAM diagramming and vector drawing software using the UML Class Diagram library of the Rapid UML Solution from the Software Development area of ConceptDraw Solution Park.
This sample shows the structure of the building and can be used by building companies, real estate agencies, at the buying / selling of the realty.
Picture: UML Class Diagram Example - Buildings and Rooms
Related Solution:
Sometimes it’s quite useful to look on a problem from another view. To gain insight into an obstacle you should use SWOT analysis, and this will help you to see the whole situation. When composing a SWOT matrix, you divide your problem onto four elements - strengths, weaknesses, opportunities and threats and place them into matrix.
This sample SWOT analysis matrix of the athletic shoes producing company was designed on the base of template provided by ConceptDraw SWOT and TOWS Matrix Diagrams solution. It delivers number of easy-to-use templates and samples of SWOT and TOWS matrices for ConceptDraw DIAGRAM. Applying one of these templates, enables to quickly find out Strengths, Weaknesses, Opportunities, and Threats. After creating a list managers can consider methods the business can use to amplify strengths and to decrease weaknesses; realize opportunities; and avoid threats.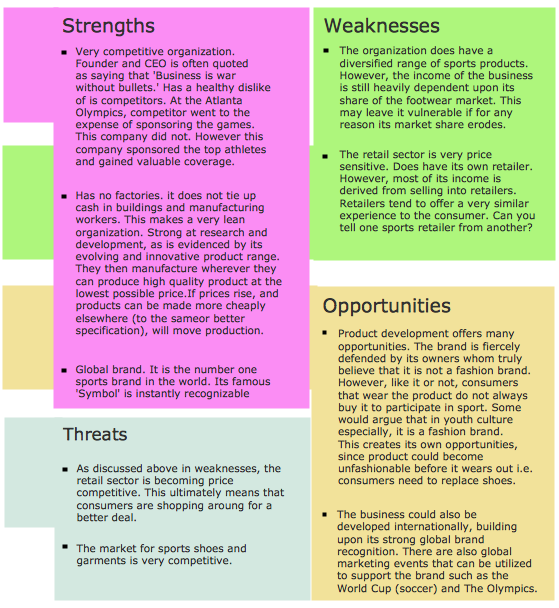
Picture: SWOT Analysis
Related Solution: