Relationships Analysis
Management and Planning tools
ConceptDraw OFFICE suite is a software for decision making. The Seven Management and Planning Tools is a tool for Interaction diagram drawing. This diagram identifies causal relationships. Determine what factors are causes and which factors are effects. Interaction diagram helps establish KPIs to monitor changes and the effectiveness of corrective actions in resolving the problem.
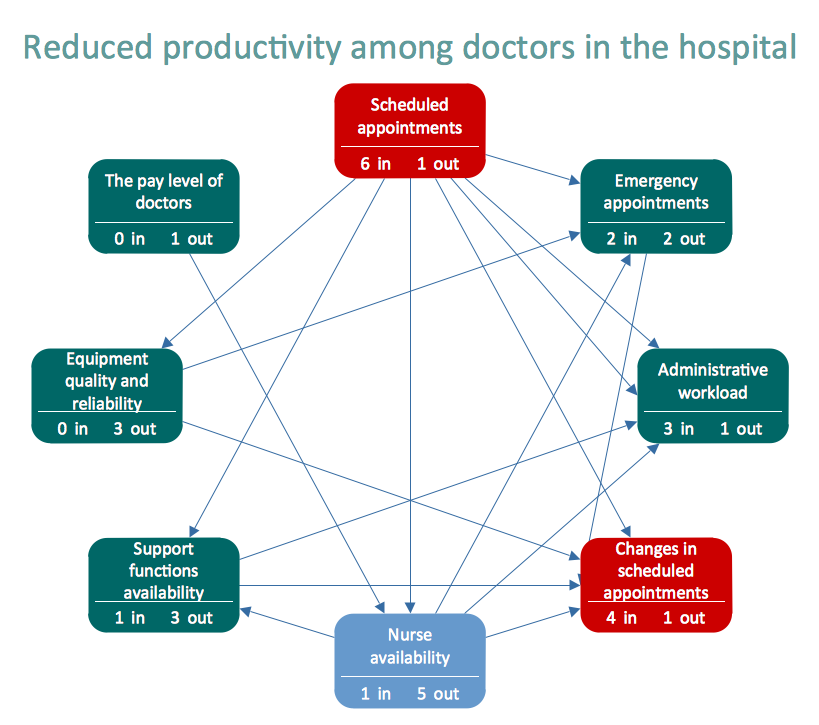
Pic.1 Relationships Analysis. Relations diagram — Health Care
Relation Diagram helps identify what factors are causes and which factors are effects. Factors help establish KPI (Key Performance Indicators) to monitor changes and the effectiveness of corrective actions in resolving a problem.
See also:
TEN RELATED HOW TO's:
Use of various charts, diagrams and infographics is the most effective way of visual presenting information about healthy foods, healthy eating and healthy diet. ConceptDraw DIAGRAM diagramming and vector drawing software offers the Health Food solution from the Food and Beverage area of ConceptDraw Solution Park which is overfull of powerful drawing tools, libraries with ready-to-use vector objects and clipart, predesigned samples and examples which will help you easy design healthy foods illustrations.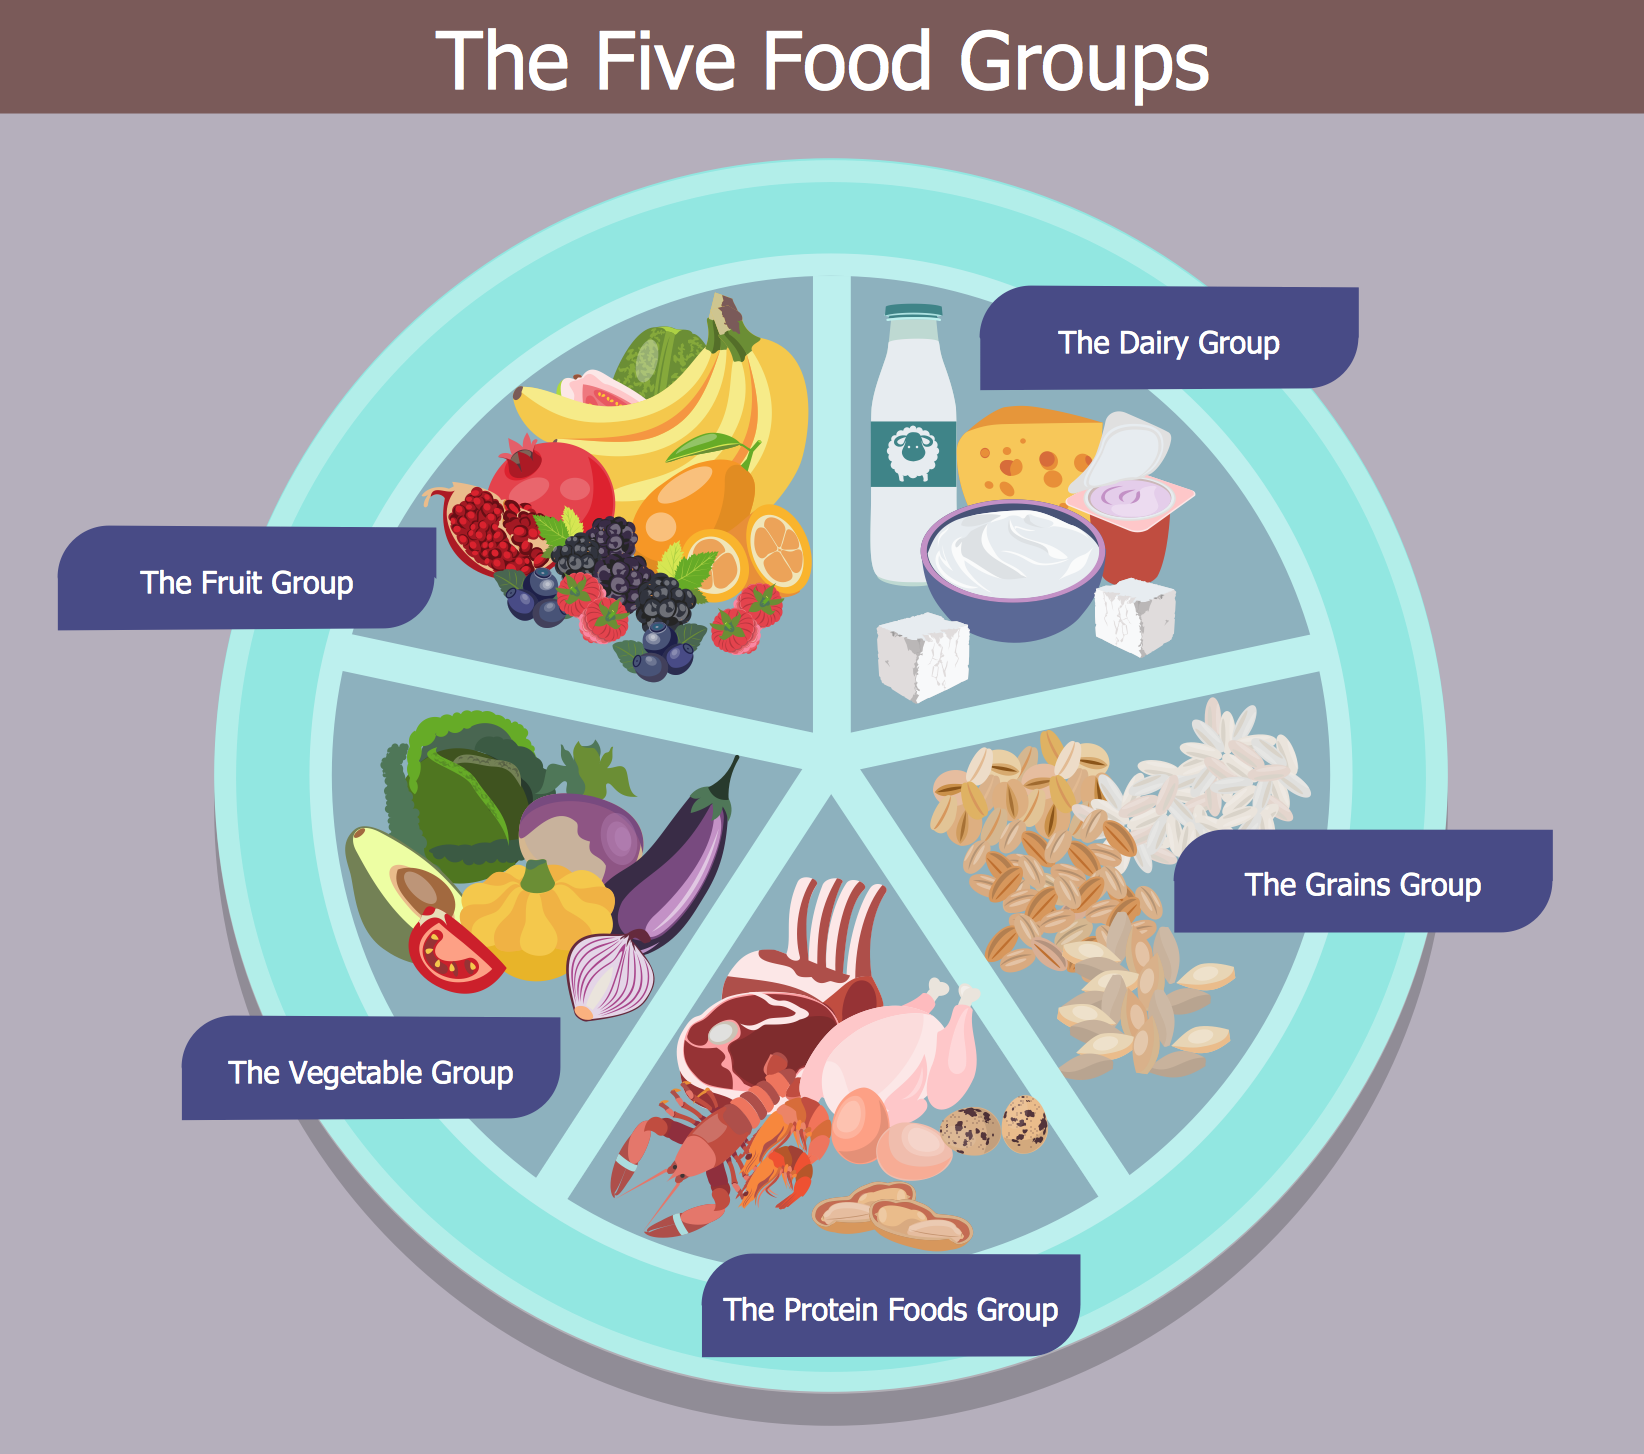
Picture: Healthy Foods
Related Solution:
Sometimes it's difficult to find a path in work processes or to understand the requirements, especially when you are a newcomer. To get your thoughts straight, create a workflow diagram, and put everything on it. This will not only help you to get into the workflow, but also show it’s weaknesses.
This illustration captures the workflow process of payment an invoice for the electricity consumed by certain enterprise. It was drawn in ConceptDraw DIAGRAM using its solution for Workflow Diagrams. Making a workflow charts means that you need to depict consistently all processes engaged to the workflow process. Then, you should connect them with symbols meaning study and analysis. Next, add symbols of decisions. A work flow diagram made precisely and correctly can help to clarify your work flow to any person.
Picture: Workflow Diagram
Related Solution:
ConceptDraw DIAGRAM is a software for simplу depicting the business processes based on BPMN 2.0.
Business Process Diagrams Cross-Functional-Flowcharts, Workflows, Process Charts, IDEF0 and IDEF2, Timeline, Calendars, Gantt Charts, Business Process Modeling, Audit and Opportunity Flowcharts and Mind Maps (presentations, meeting agendas).
Picture: Business Process Modeling Notation
Related Solution:
How to draw pictorial chart quick, easy and effective? ConceptDraw DIAGRAM offers the unique Pictorial Infographics Solution that will help you!
Pictorial Infographics solution contains large number of libraries with variety of predesigned vector pictograms that allows you design infographics in minutes. There are available 10 libraries with 197 vector pictograms.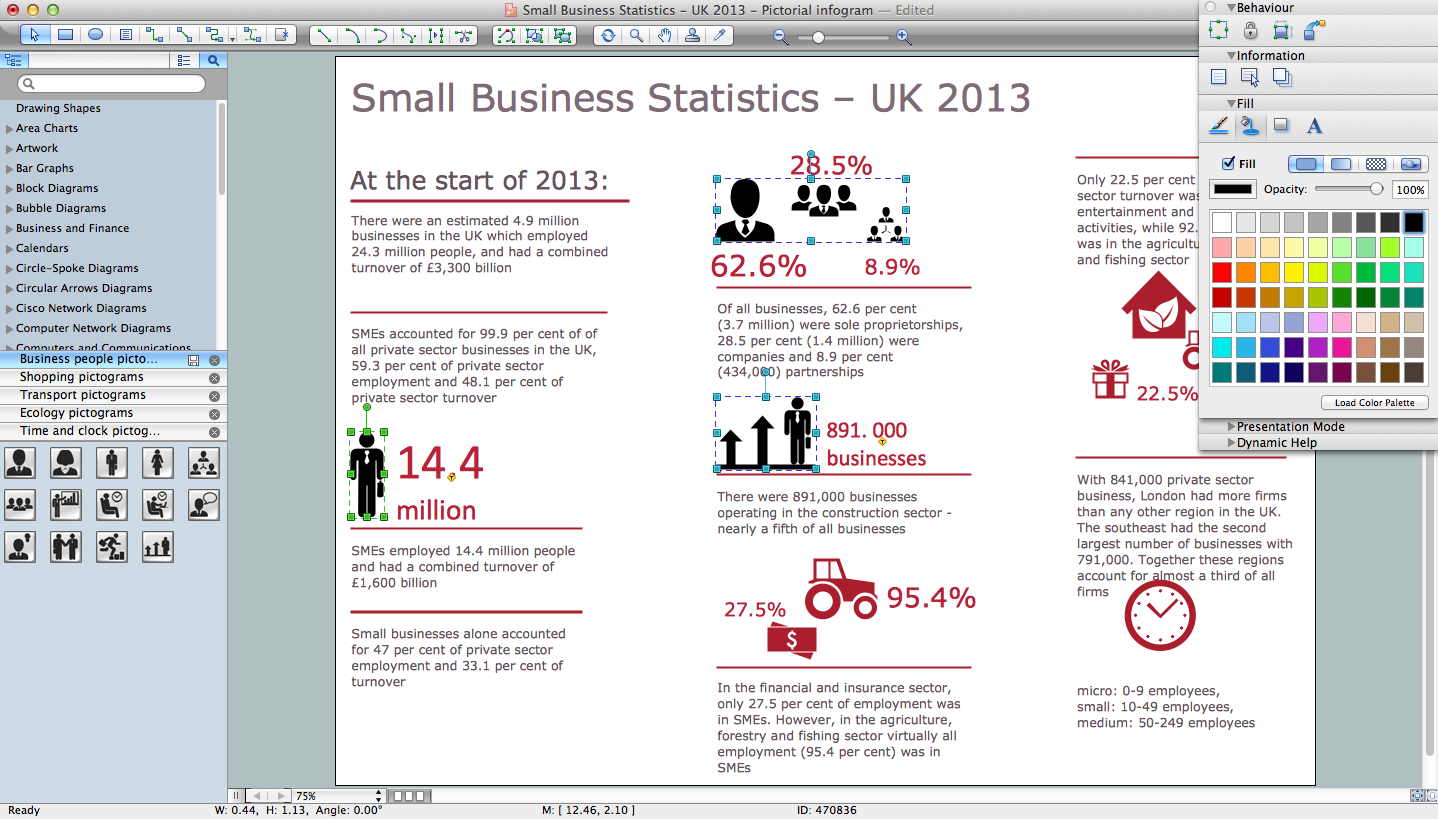
Picture: How to Draw Pictorial Chart. How to Use Infograms
Related Solution:
Collaborating with co-workers is very important, not only in order to get things done effectively, but also to keep in touch with the outside world. Great way for business collaboration is Skype.
Picture: Online Collaboration via Skype
Related Solution:
Helps to create professionally looking and detailed Sales Flowcharts with all sales steps visually represented on them.
Use the Sales Flowcharts Solution for ConceptDraw DIAGRAM software to create your own Sales Flowcharts of any complexity quickly, easily and effectively to use them successfully in your work activity.
ConceptDraw DIAGRAM diagramming and vector drawing software supplied with unique Sales Flowcharts solution from the Marketing area of ConceptDraw Solution Park allows fast and easy visualize all sales steps of the sales process on a sales process Map or sales process flowchart, and then realize them easily.
Picture: Sales Steps
Related Solution:
House of Quality Matrix Software - Use the predesigned objects from the Involvement Matrix Objects Library from the Seven Management and Planning Tools Solution to create professional looking House of Quality Matrices in minutes.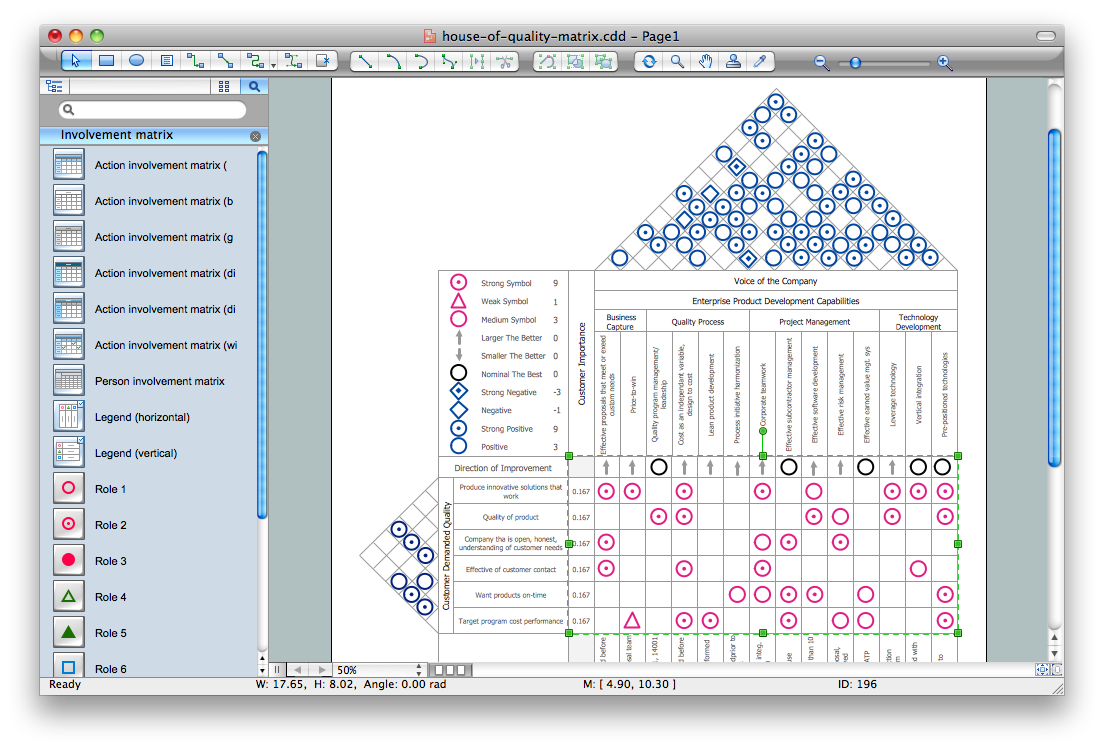
Picture: House of Quality Matrix Software
Related Solution:
Process Decision Program Chart (PDPC) is a commonly used technique that was designed in order to help prepare the contingency plans. The emphasis of the PDPC is identifying the consequential impact of failure on activity plans as well as creating the appropriate contingency plans in terms of limiting the risks. Planning to make the tree diagrams and/or the process diagrams can be extended by a couple of levels when the PDPC can be applied to the bottom level tasks on those diagrams.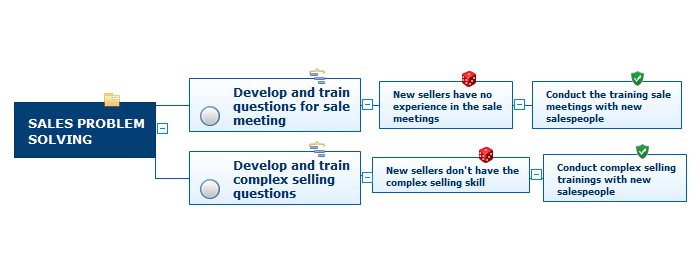
Picture: Risk Diagram (Process Decision Program Chart)
Related Solution:
The Total Quality Management Diagram solution helps you and your organization visualize business and industrial processes. Create Total Quality Management diagrams for business process with ConceptDraw software.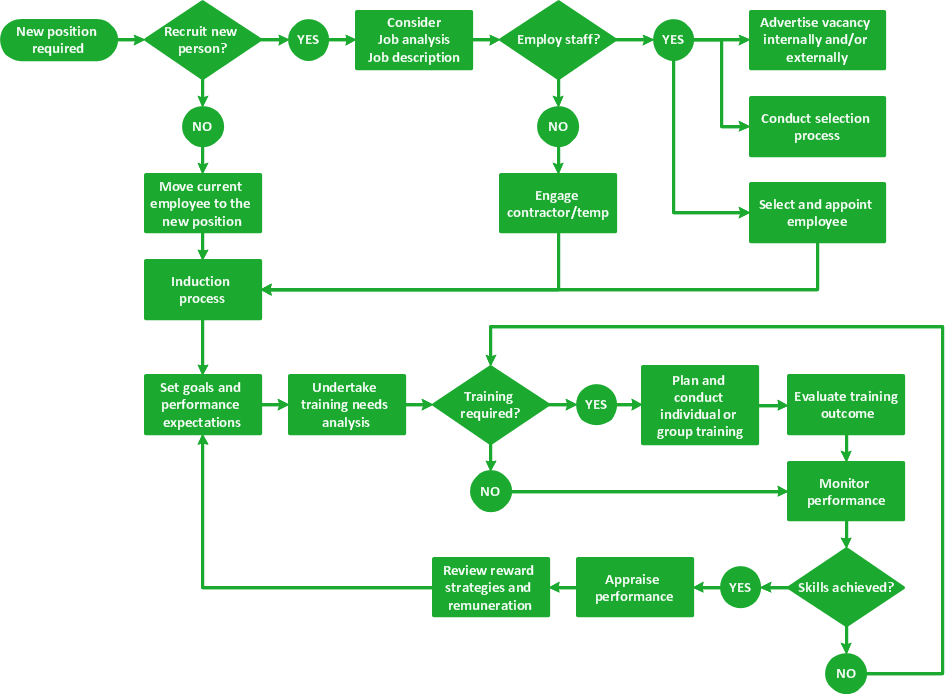
Picture: TQM Software — Build Professional TQM Diagrams
Related Solution:
ConceptDraw DIAGRAM diagramming and vector drawing software extended with Fishbone Diagrams solution is a perfect tool for software designers and software developers. If you need to create Cause and Effect diagram, Fishbone diagram, Ishikawa diagram from templates and examples, or using the predesigned elements, ConceptDraw DIAGRAM can do this easily.
ConceptDraw DIAGRAM software gives ability to design Fishbone diagrams that identify many possible causes for an effect for problem. Each Fishbone diagram design element included to Fishbone Diagrams library is vector and ready-to-use..png)
Picture: Fishbone Diagram Design Element
Related Solution:
ConceptDraw
DIAGRAM 18