Sales KPI Dashboards
Sales Dashboard Solution
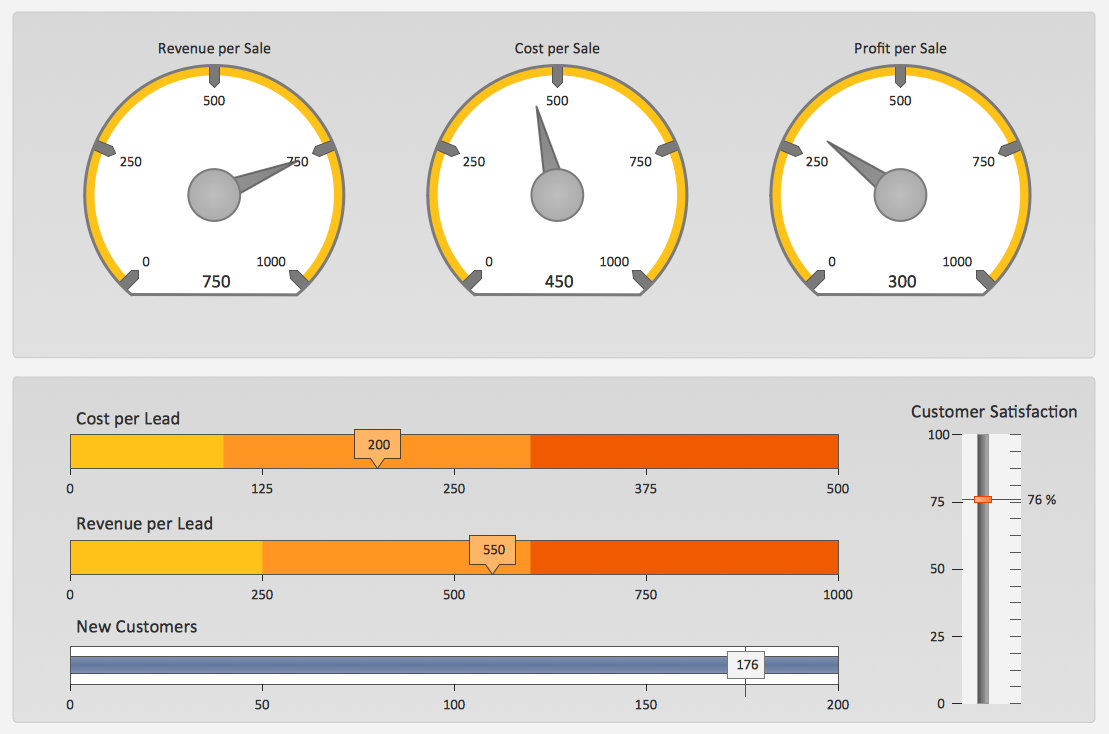
The Sales Dashboard Solution gives users the ability to use live data to drive KPI dashboards that show sales performance in a wide variety of graphs. KPI Dashboards allow users to capture and report specific data points from sales department within the organization, thus providing a "snapshot" of performance.

Pic. 1. Sales KPIs Dashboard Sample
FOUR RELATED HOW TO's:
Create Quality Engineering Diagrams (value stream maps) - for value stream analysis and value stream management, material and information flow mapping, using our quick start templates included with ConceptDraw.

Picture: Quality Engineering Diagrams
Related Solution:
The excellent possibility to create attractive Cross Functional Flowcharts for step-by-step visualization the operations of a business process flow of any degree of detailing is offered by ConceptDraw’s Cross-Functional Flowcharts solution. The extensive selection of commonly used vector cross functional flowchart symbols allow you to demonstrate the document flow in organization, to represent each team member’s responsibilities and how processes get shared or transferred between different teams and departments.

Picture: Cross Functional Flowchart Symbols
Related Solution:
ConceptDraw
DIAGRAM 18