Sales Process Map
You need create a Sales Process Map? Use the ConceptDraw DIAGRAM software which is ideal for the sales process management, marketing and engineering thanks to the powerful Sales Flowcharts solution from the Marketing area of ConceptDraw Solution Park.

Example 1. Sales Process Map - Visual Shopping Scheme
Sales Flowcharts Solution is incredibly useful in the field of sales process management, first of all thanks to the 6 libraries:
- Sales Arrows
- Sales Department
- Sales Flowchart
- Sales Steps
- Sales Symbols
- Sales Workflows
which contain 285 ready-to-use vector objects, sales symbols, flowchart icons.

Example 2. Sales Process Map - Lead to Opportunity Sales Flow
These objects can effectively help you to design the Sales Process Map or Flowchart of any complexity, which will visually display the sales processes, the actual status of workflows, the sales process results to analyze and timely identify the problems within the workflow.

Example 3. Sales Process Map - E Filing General Workflow
The Sales Process Map samples you see on this page were created in ConceptDraw DIAGRAM using the predesigned objects from the libraries of the Sales Flowcharts Solution for ConceptDraw Solution Park. An experienced user spent 10-15 minutes creating each of these samples.
Use the Sales Flowcharts Solution for ConceptDraw DIAGRAM software to create your own Sales Process Map or Sales Flowchart fast, easy and effective.
All source documents are vector graphic documents. They are available for reviewing, modifying, or converting to a variety of formats (PDF file, MS PowerPoint, MS Visio, and many other graphic formats) from the ConceptDraw STORE. The Sales Flowcharts Solution is available for all ConceptDraw DIAGRAM
TEN RELATED HOW TO's:
Why do you need a business process flow diagram? How to use business process diagram software? Explore ✔️ the significance, ✔️ creation process, and ✔️ discover cutting-edge software solutions designed to streamline and optimize your workflows
Picture: Business Process Workflow Diagrams & Software
Related Solution:
This sample shows the Flowchart that displays the architecture of SQL Exception Translation.
This sample was created in ConceptDraw DIAGRAM diagramming and vector drawing software using the Flowcharts solution from the Diagrams area of ConceptDraw Solution Park.
Picture: Sample Project Flowchart. Flowchart Examples
Related Solution:
Event-Driven Process Chain Diagrams for improvement throughout an organisation.
ConceptDraw DIAGRAM - software that reduces the time needed to create a business process model.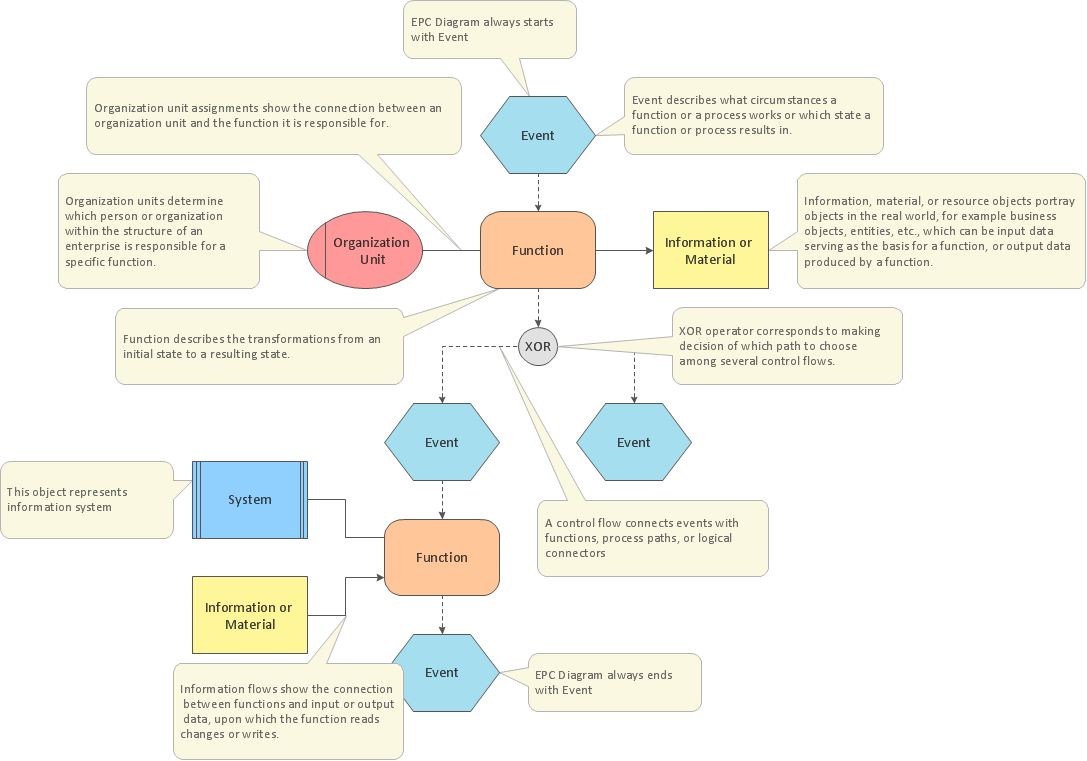
Picture: EPC for Business Process Implementation
Related Solution:
ConceptDraw Value Stream Mapping solution extends software with templates, samples and vector shapes for drawing Value Stream Maps (VSM).
Picture: Standard Shapes for Value Stream Mapping
Related Solution:
Business process maps help you evaluate and manage quality in a work process chain, placing an emphasis on corporate performance and optimization.
Business Mapping Software a versatile collection of libraries and templates, that allow you to create business process and SIPOC diagrams, using the Six Sigma methodology.
Picture: Business Mapping Software
Related Solution:
When describing any computer network, we imagine a set of devices and nodes, arranged in some way. Talking about network structures, we should distinguish physical and logical network topologies, as physical topology is about devices location and logical topology illustrates data flow. In the same time, they do not have to match, and some devices, such as repeaters, may have a physical star layout, but a bus logical topology.
There are two main types of computer network topologies: Physical topology that show the physical organization of a network - equipment and types of connections. Star network topology involves a set of devices that is connected to a single hub (router). Ring network topology means that, devices connected according this topology have two connections, connecting with nearby devices to make a loop. Bus network topology is the topology presented at the current diagram. It is similar to a ring topology. The difference is that data moves up and down a linear connection, copying itself where network equipment works as bus-stations along the way. This network topology can be used for small network, or when adding an extra device into a network.
Picture: Network Topologies
Related Solution:
A floor plan is an essential element of any building or architectural plan. It shows a view from above of relationships between physical features on one floor of a structure. Thanks to modern digital drawing tools, you can easily learn how to create floor plans. Software like ConceptDraw DIAGRAM provides an intuitive and modern interface and an assortment of powerful tools, so that nothing will get in the way of your creativity.
When considering a moving to a new office, or making rearrangement of an office, its better to draw an office floor plan picture. The objective of any office space organization is to maintain a business functionality in a proper manner. This diagram illustrates a layout of usual cubical office. It shows just walls, windows and cubicles. You can use it as a template for your custom office layout diagram. the all you need is to launch ConceptDraw DIAGRAM with its Office Plans solution. Then, you can make changes and add necessary equipment, using the vector objects library, supplied with solution.
Picture: How To Create Floor Plans
Related Solution:
A process flowchart is a picture of the separate steps of a process in sequential order.Use ConceptDraw DIAGRAM software and the vector stencils from object libraries are designed objects you can use adding to process flowcharts for the best result.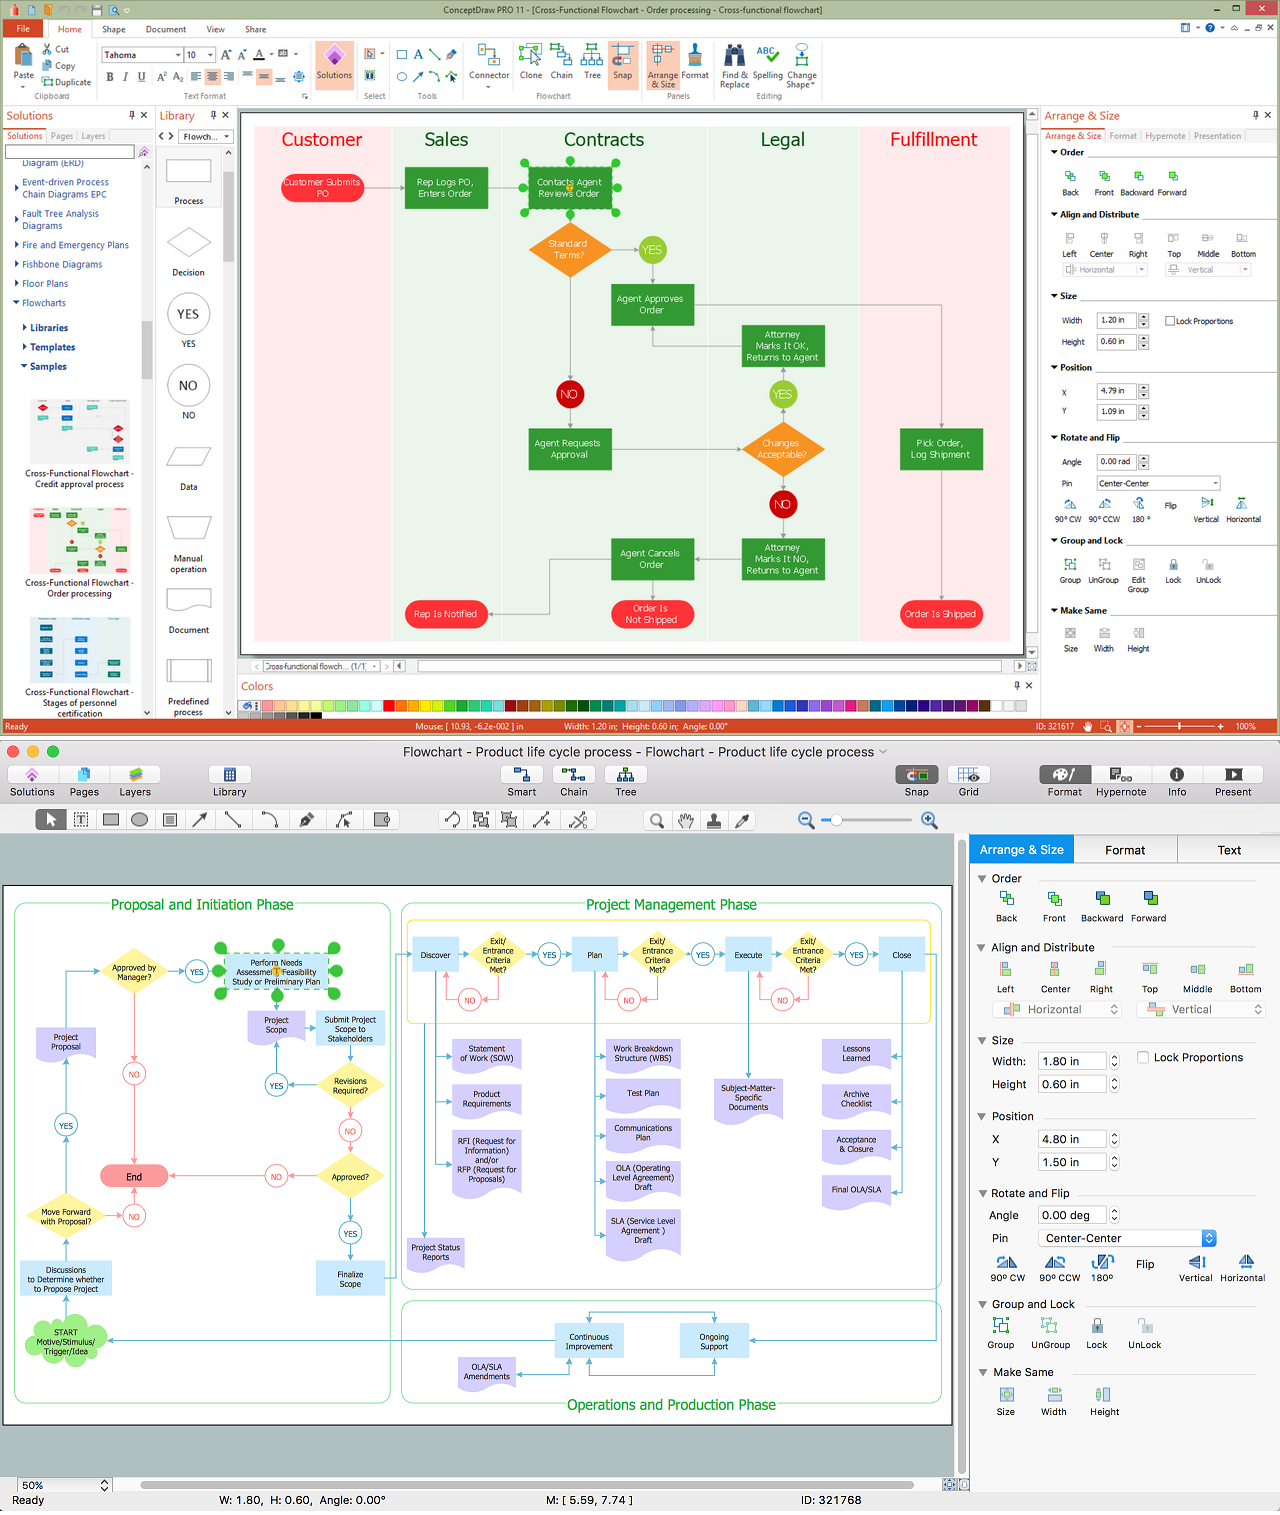
Picture: Create Process Flowcharts
Related Solution:
The PERT Chart is constructed as part of the process in creating a schedule of corrective actions. The PERT Chart shows the logical connections and consequence of tasks to be performed. It displays the time period for problem solving and the implementation of all activities through the critical path.
ConceptDraw Office suite is a software for corrective actions planning.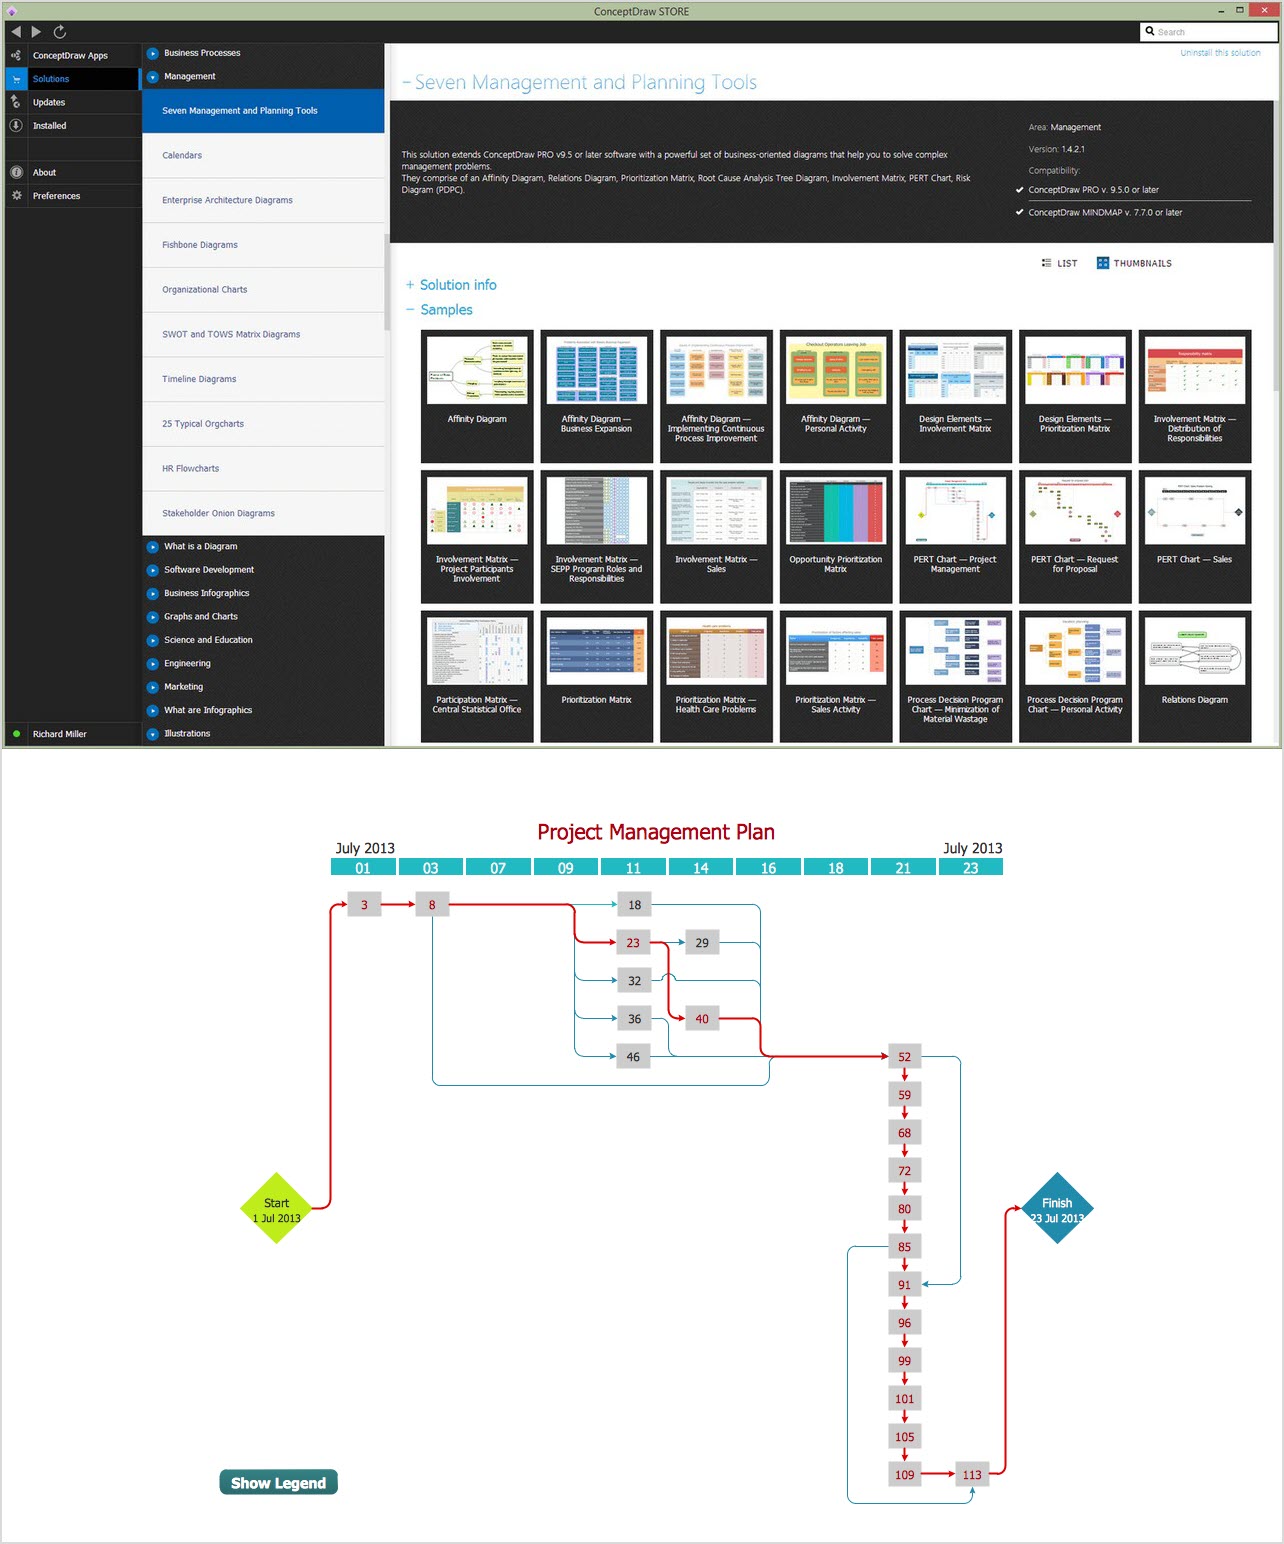
Picture: CORRECTIVE ACTIONS PLANNING. PERT Chart
This sample shows the Polar Graph. The Polar Graph is a graph in the polar coordinate system in which the each point on the plane is defined by two values - the polar angle and the polar radius. The certain equations have very complex graphs in the Cartesian coordinates, but the application of the polar coordinate system allows usually produce the simple Polar Graphs for these equations.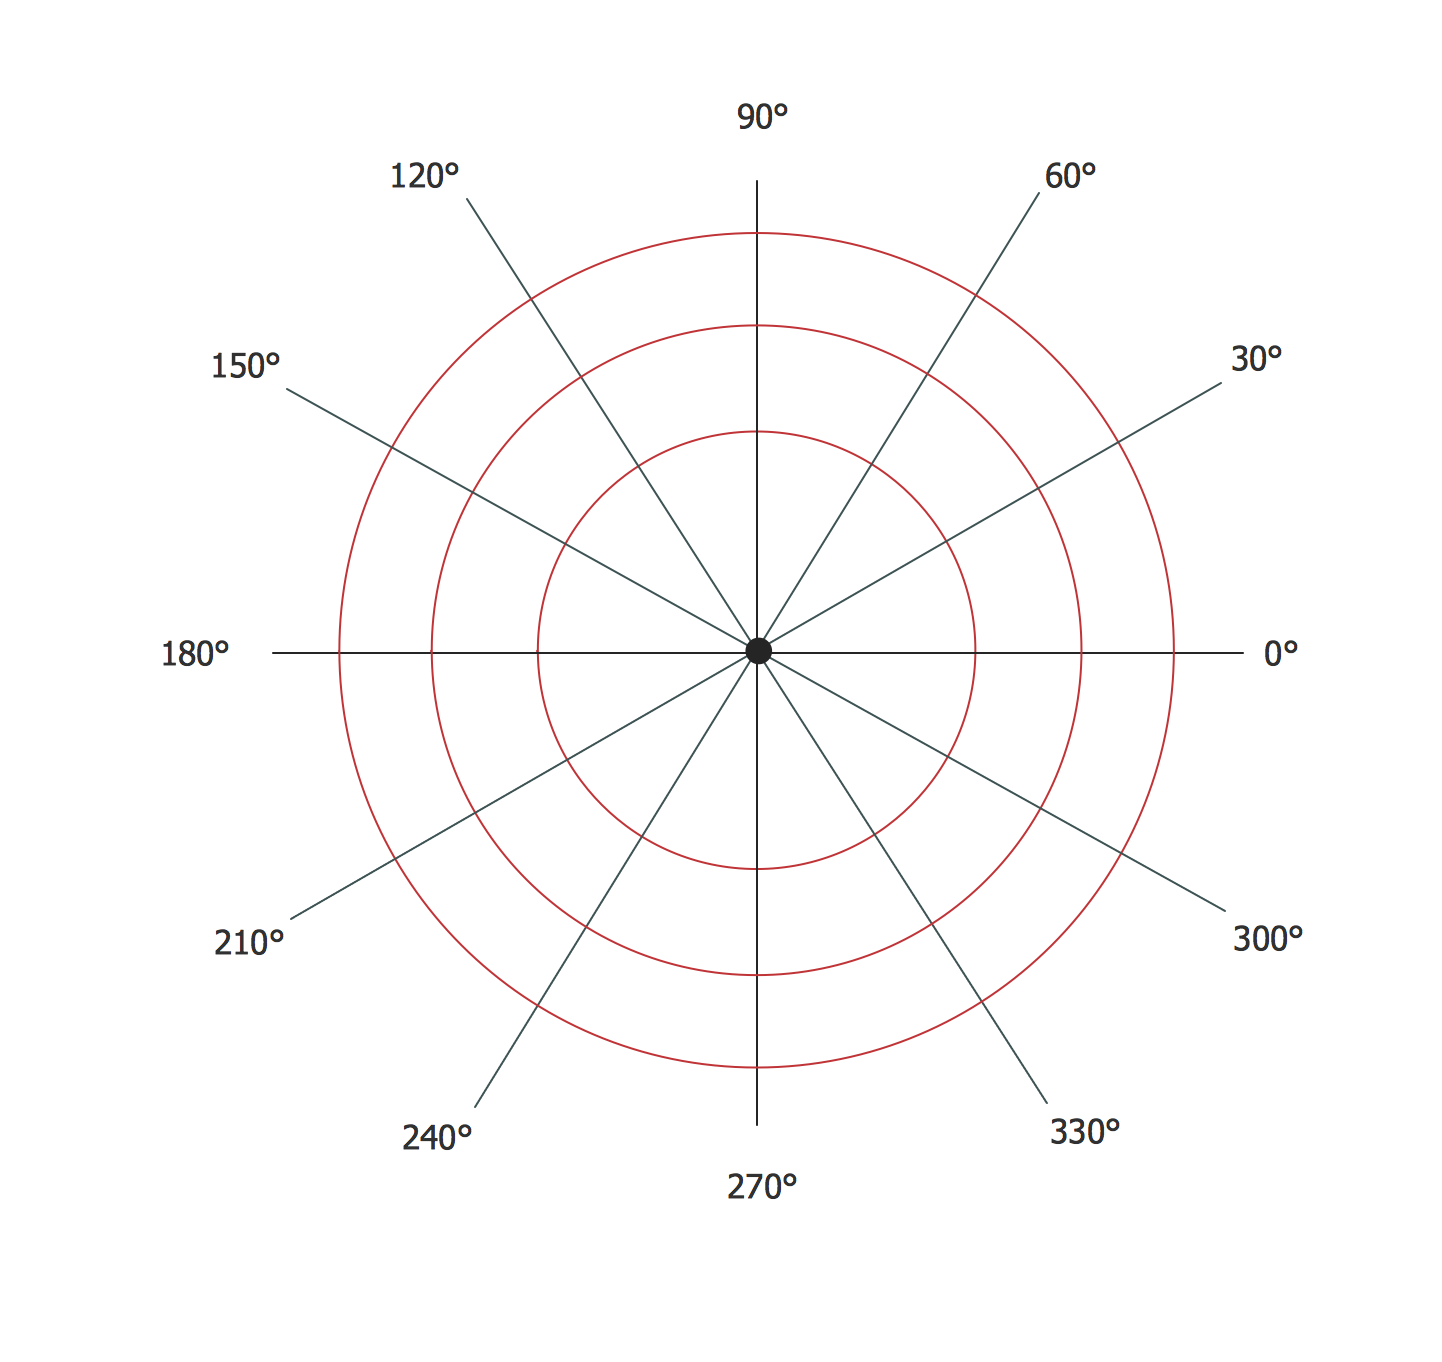
Picture: Polar Graph

