Today almost everyone has been subjected to the sales process, however professional selling involves a series of distinct steps. One shortcut to success in any industry is to follow footsteps of those who earned success before you.
In this lesson, you'll learn about important steps in sales process and will be provided with examples.
ConceptDraw DIAGRAM diagramming and vector drawing software supplied with unique Sales Flowcharts solution from the Marketing area of ConceptDraw Solution Park allows fast and easy visualize all sales steps of the sales process on a sales process Map or sales process flowchart, and then realize them easily.
Example 1. Sales Steps
Outlining the sales process - what can be easy? Thanks to the 6 libraries of the Sales Flowcharts Solution it is a very simple process:
Sales Arrows
Sales Department
Sales Flowchart
Sales Steps
Sales Symbols
Sales Workflows
These libraries contain all vector shapes and symbols needed for representing the sales steps and displaying the sales results.
Steps to Creating a Sales Process Flow Chart
Helps to create professionally looking and detailed sales flowcharts with all sales steps visually represented on them.
Create new document
Add needed objects to the page
Place objects in needed position
Open Sales arrows library, drag and drop Circular motion arrows object
Add needed quantity of segments using object menu
Select a segment from the group, select a group-figure for that (Circular motion arrows), one more click and inside figure will be selected
In this case, it will be one of the arrows
Open Object Filling Inspector from Ribbon
Change arrows color
Note: You may use standard pallet or use a custom one
Open line inspector, switch off the Stroke
Add International division and Nurturing objects
Align these objects
Group all objects for convenient usage
Add more objects
Arrange and change sizes
Turn on size boxes
Note: Size will be shown for selected object in units of document
Add a Textbox, just double click on the page space
Note: Font and color will be same as the last added object from the library
Open Inspectors - Text
Set the needed font, size and color. All the next textboxes will have these atributes
Fill the needed text
Use Ellipse tool located on ribbon
Draw a circle on top of all objects
Note: to draw a proper circle, hold a Shift button
Change color of circle
Add names to top objects
Add more objects
Flip horizontally one of the figures
Open Instectors - Layer
Set another level as "work"
Add a rectange equal the page size using Restangle tool on the ribbon
Bring to the back this rectangle using the tool on ribbon
Change its color
Set the first level as "work"
Lock the second level from edition
Change filling for some objects
Open Inspectors - Text - Change text color
Add some pointing arrows from Sales arrows library
Select one by one and change their color
Note: to select several objects, hold the Shift button
Add few more flowchat steps
Add new objects and arrows
Open Page Inspector
Change the name of page by double click on it
Save the document
Export it to PDF
Open file in PDF reader program!
All source documents are vector graphic documents. They are available for reviewing, modifying, or converting to a variety of formats (PDF file, MS PowerPoint, MS Visio, and many other graphic formats) from the ConceptDraw STORE. The Sales Flowcharts Solution is available for all ConceptDraw DIAGRAM
Use the Sales Flowcharts Solution for ConceptDraw DIAGRAM software to create your own Sales Flowcharts of any complexity quickly, easily and effectively to use them successfully in your work activity.
Video. Steps to Creating a Sales Process Flow Chart (2min 05sec)
Desbloquee el lenguaje de los diagramas de flujo con nuestra guía de símbolos de diagramas de flujo. 🔸 Todo lo que necesita saber sobre los conceptos básicos del diagrama de flujo, desde ✔️ puntos de decisión hasta ✔️ pasos del proceso, explore el significado detrás de cada símbolo y domine el arte de crear representaciones visuales claras y efectivas de sus procesos.
This sample shows the Flowchart that displays the layout and work flow of the cloud marketing platform. This diagram has a style of the marketing brochure. This style displays the central product that is related to the other issues.
Using the ready-to-use predesigned objects, samples and templates from the Flowcharts Solution for ConceptDraw DIAGRAM you can create your own professional looking Flowchart Diagrams quick and easy.
ConceptDraw DIAGRAM diagramming and vector drawing software offers the unique Business Process Mapping Solution from the Business Processes Area of ConceptDraw Solution Park. Powerful drawing tools of this solution make it effective Business Process Mapping software and help easy design professional looking business process diagrams and flowcharts.
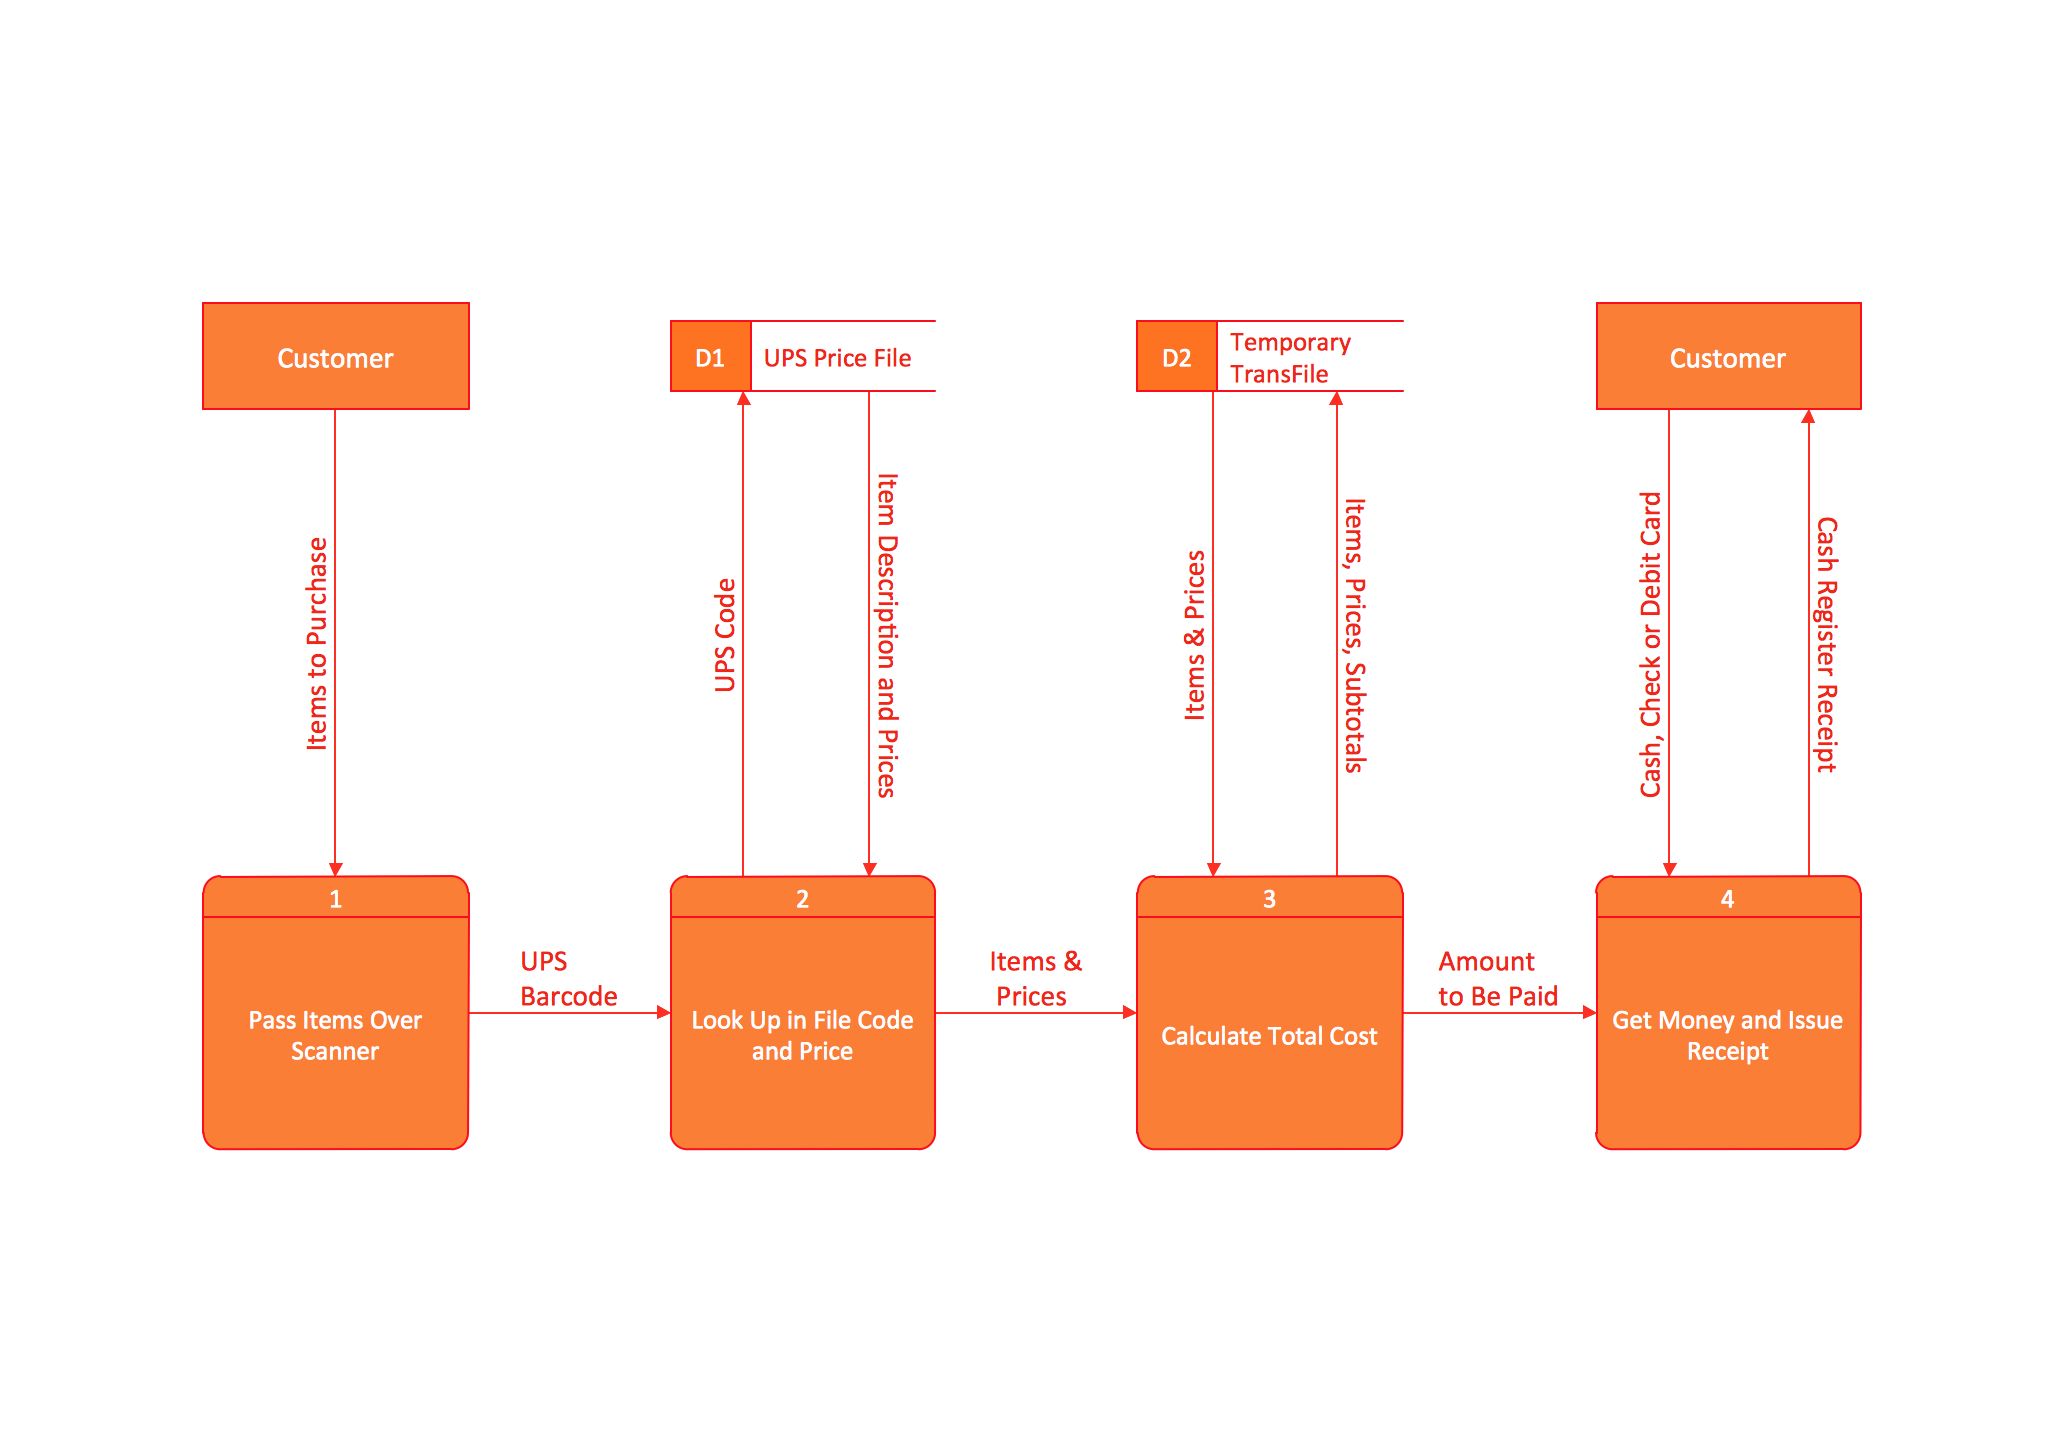
In software engineering, it is important to understand how the system would cooperate with external sources, like data sources. To give this information a visual representation, data flow diagrams (DFD) were used for years. The entire system is usually divided into smaller ones, and all of them process data flows in appropriate ways.
The visualizing business processes which engages the data transfer, is commonly preformed using DFDs (data flow diagrams). DFD is used to show the data flow processing and transformation. This DFD represents the electronic system of a customer purchase. It was created using Gane/Sarson notation. Data flow diagrams helps you to sort through and clarify transferring process making it available for analysis, and representation. ConceptDraw DFD solution introduces the vector library, containing the full set of icons from DFD notations.
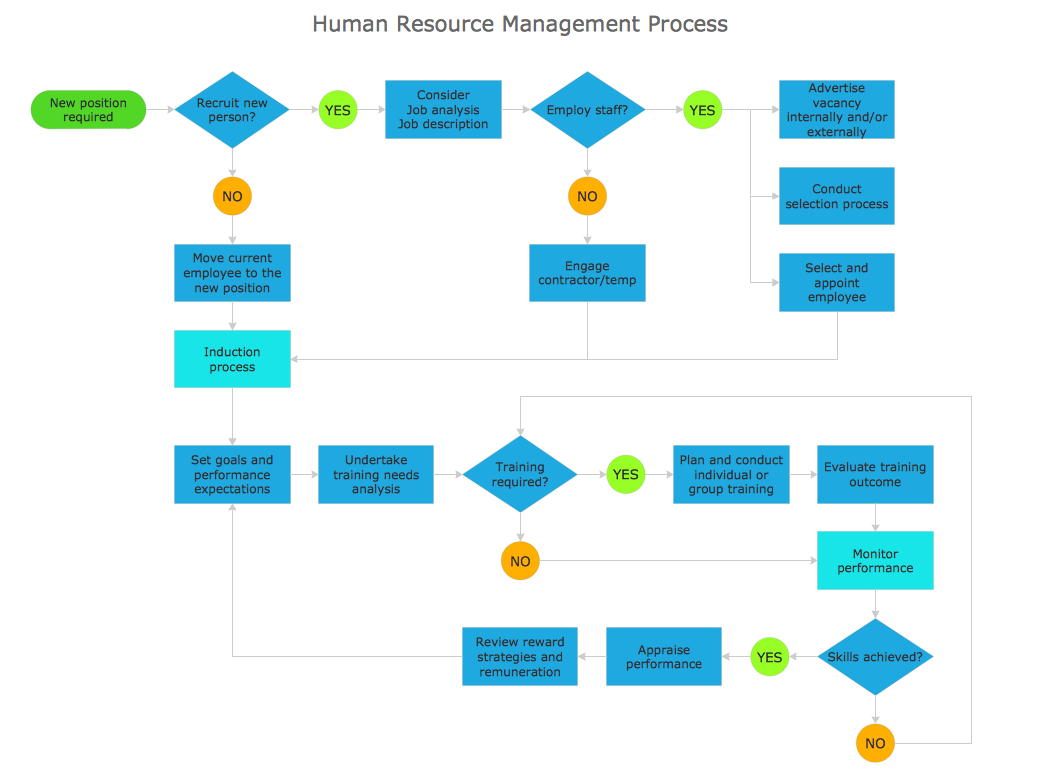
A flowchart is a powerful tool for examining processes. It helps improving processes a lot, as it becomes much easier to communicate between involved people, to identify potential problems and to optimize workflow. There are flowcharts of different shapes, sizes and types of flowchart vary from quite basic process flowcharts to complex program flowcharts. Nevertheless, all these diagrams use the same set of special symbols like arrows to connect blocks, parallelogram to show data receiving or rectangles for showing process steps.
Basic flowcharts are used to represent a simple process algorithm. A basic flowchart notation consists of rectangles (business processes), arrows (the flow of information, documents, etc.). The same notation is used in items such as the "decision", which allow you to do the branching. To indicate the start of the entire business process and its termination can be used the "Terminator" element. The advantages of Basic Flowchart are simplicity and clarity. With it you can quickly describe the business process steps. Creating of Basic Flowchart does not require any special knowledge, as easily understand by employees with different levels of education and IQ.
Picture: Types of Flowchart: Comprehensive Overview
The Sales Process is a complex approach for selling a product or service which assumes many steps including the sales planning, realization of the sales marketing and management strategies, sales process analysis, etc. Now we have a ConceptDraw DIAGRAM software extended with unique Sales Flowcharts solution from the Marketing area of ConceptDraw Solution Park which ideally suits for the planning and realization the company's sales process.
A process flow chart is a sequence diagram on events, actions, tasks and decisions that are visualized in a form of inputs and outputs. Such flow chart involves a defined number of standard symbols and notation keys used to help one understand and pass the information.
Process flow charts have become a day-to-day tool for chemical engineers, technologists and production engineers as well as software developers. However, their use has recently increased in other areas such as business, manufacturing and, especially a service sector.
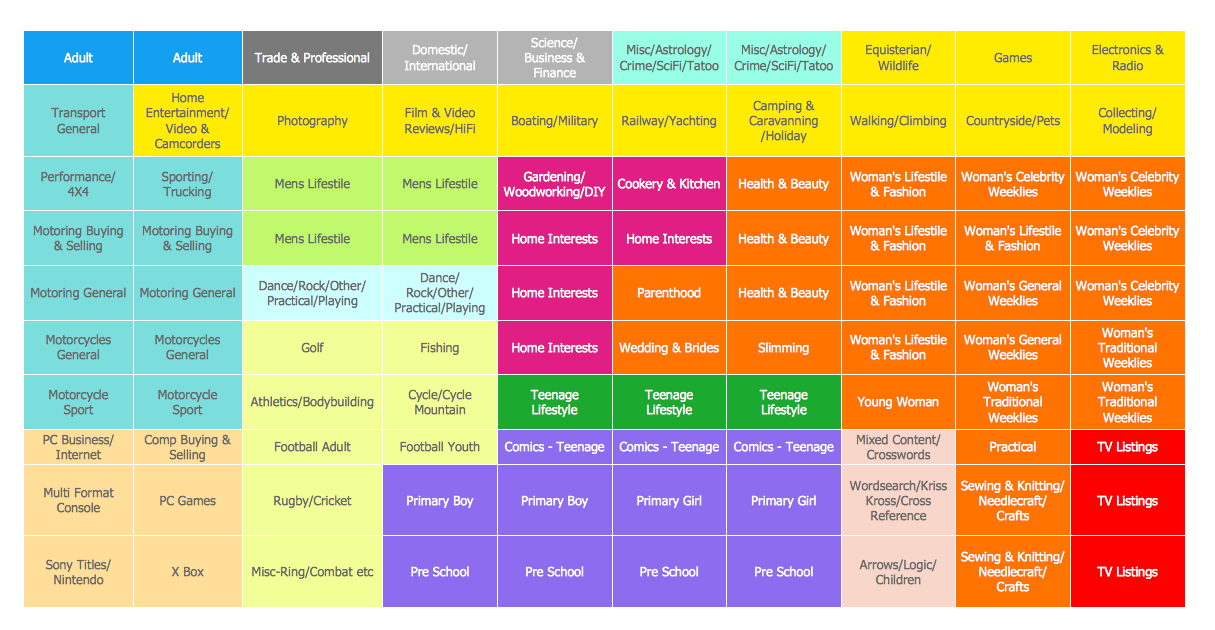
Use the ready-to-use predesigned objects, templates and samples from the Basic Diagramming Solution for ConceptDraw DIAGRAM you can create your own professional looking Planograms quick, easy and effective.
The Flowchart is a very popular type of diagram, it is widely used for analyzing, designing, managing and visualizing the business and technical processes, various software algorithms. But how to create Flowchart quick and easy?
Flowcharts solution from the Diagrams area of ConceptDraw Solution Park helps you to design the professional looking Flowchart Diagrams quick and easy using the ConceptDraw DIAGRAM diagramming and vector drawing software.
A Storage area network (SAN) is a dedicated network that provides access to data storage and operations only on the block level. SAN usually has own network of storage devices/elements and disk arrays that are connected with each other and to a remote data-sharing network. SANs are widely used for enhancing the storage devices (optical jukeboxes, disk arrays, tape libraries) that are accessible for networked servers.
This example was created in ConceptDraw DIAGRAM using the Computer and Networks Area of ConceptDraw Solution Park. It shows the hybrid of Storage area network (SAN) and Network Attached Storage (NAS) technologies.
Picture: Storage area networks (SAN). Computer and Network Examples