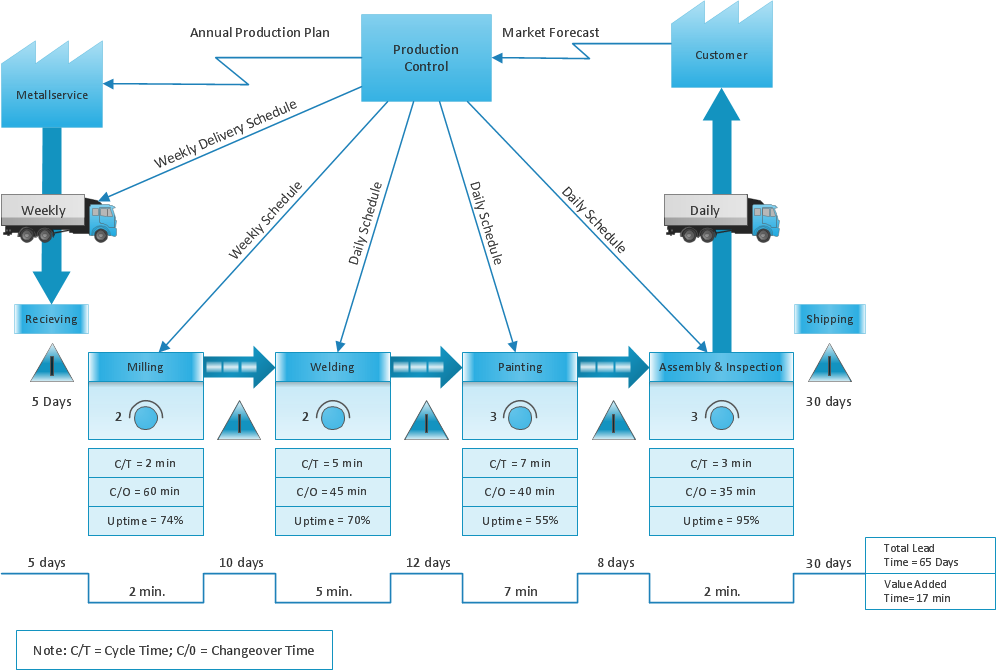
Sections of the Value Stream Map
The Value Stream Mapping solution from ConceptDraw Solution Park extends ConceptDraw DIAGRAM software with a new library that contain vector objects, samples and templates. With this well-designed vector objects users can draw Sections of the Value Stream Mapping. Also users can export final document to PDF, PowerPoint, and other popular graphic formats.

Pic.1 VSM diagram example.
This sample Value Stream Map shows how customer value is created in the steps of manufacturing, production control, and shipping processes.
See also Samples:
THREE RELATED HOW TO's:
ConceptDraw DIAGRAM software extended with Fishbone Diagrams solution from the Management area of ConceptDraw Solution Park is perfect for Cause and Effect Diagram creating. It gives the ability to draw fishbone diagram that identifies many possible causes for an effect or a problem. Causes and Effects are usually grouped into major categories to identify these sources of variation. Causes and Effects in the diagram show relationships among various factor. Fishbone diagram shows factors of Equipment, Process, People, Materials, Environment and Management, all affecting the overall problem.

Picture: Cause and Effect Diagram
Related Solution:
A key point of conference success is the ability to see slides in real time, and hold documented discussions during the meeting. Remote Presentation for Skype is a new solution allows real-time presenting that benefits work groups who need collaborate by web meetings.

Picture: Tool for Workgroup Briefings, Meetings and Decisions
Related Solution:
Lean Manufacturing tool is a new Value Stream Mapping solution found in the ConceptDraw Solution Park.

Picture: Lean Value Stream Map
Related Solution:
ConceptDraw
MINDMAP 16