Sequence Diagram for Cloud Computing
One of the ways effectively visualize what is a Cloud computing or Cloud computing architecture, is to create the Sequence diagram for Cloud computing. The Sequence diagram depicts the objects and interactions between them, and also messages exchanged these objects. The objects are represented on the Sequence diagram as the parallel vertical lines - lifelines, and the messages - as horizontal arrows in the order in which the interactions between objects occur.
Owing to their clarity and clearness, the Sequence diagrams have a wide range of applications, including creation the Sequence diagram for Cloud computing as you will see on this page.
The ConceptDraw DIAGRAM diagramming and vector drawing software enhanced with Cloud Computing Diagrams solution from the Computers and Network area of ConceptDraw Solution Park will help you design all desired types of diagrams related with cloud computing.

Example 1. Sequence Diagram for Cloud Computing
The Cloud Computing Diagrams Solution is incredibly helpful for easy drawing Cloud computing diagrams and Sequence diagram for cloud computing. Large collection of predesigned samples and variety of libraries with numerous vector objects are included to Cloud Computing Diagrams Solution for ConceptDraw DIAGRAM All them are professionally developed and are available from ConceptDraw STORE which permits to click any preview to open it for editing in ConceptDraw DIAGRAM software.

Example 2. Sequence Diagram for Cloud Computing, Apple OS X and Windows
The sequence diagram you see on this page was created in ConceptDraw DIAGRAM software using the tools of Cloud Computing Diagrams Solution for ConceptDraw Solution Park. An experienced user spent 5 minutes creating this sample.
Use the Cloud Computing Diagrams Solution for ConceptDraw DIAGRAM software to create various types for Cloud computing diagrams, and also ER diagram and Sequence diagram for cloud computing quick, easy and effective.
All source documents are vector graphic documents. They are available for reviewing, modifying, or converting to a variety of formats (PDF file, MS PowerPoint, MS Visio, and many other graphic formats) from the ConceptDraw STORE. The Cloud Computing Diagrams Solution is available for all ConceptDraw DIAGRAM users.
TEN RELATED HOW TO's:
ConceptDraw DIAGRAM software extended with unique HR Flowcharts Solution is the best for designing various flowcharts and diagrams in the field of human resources management.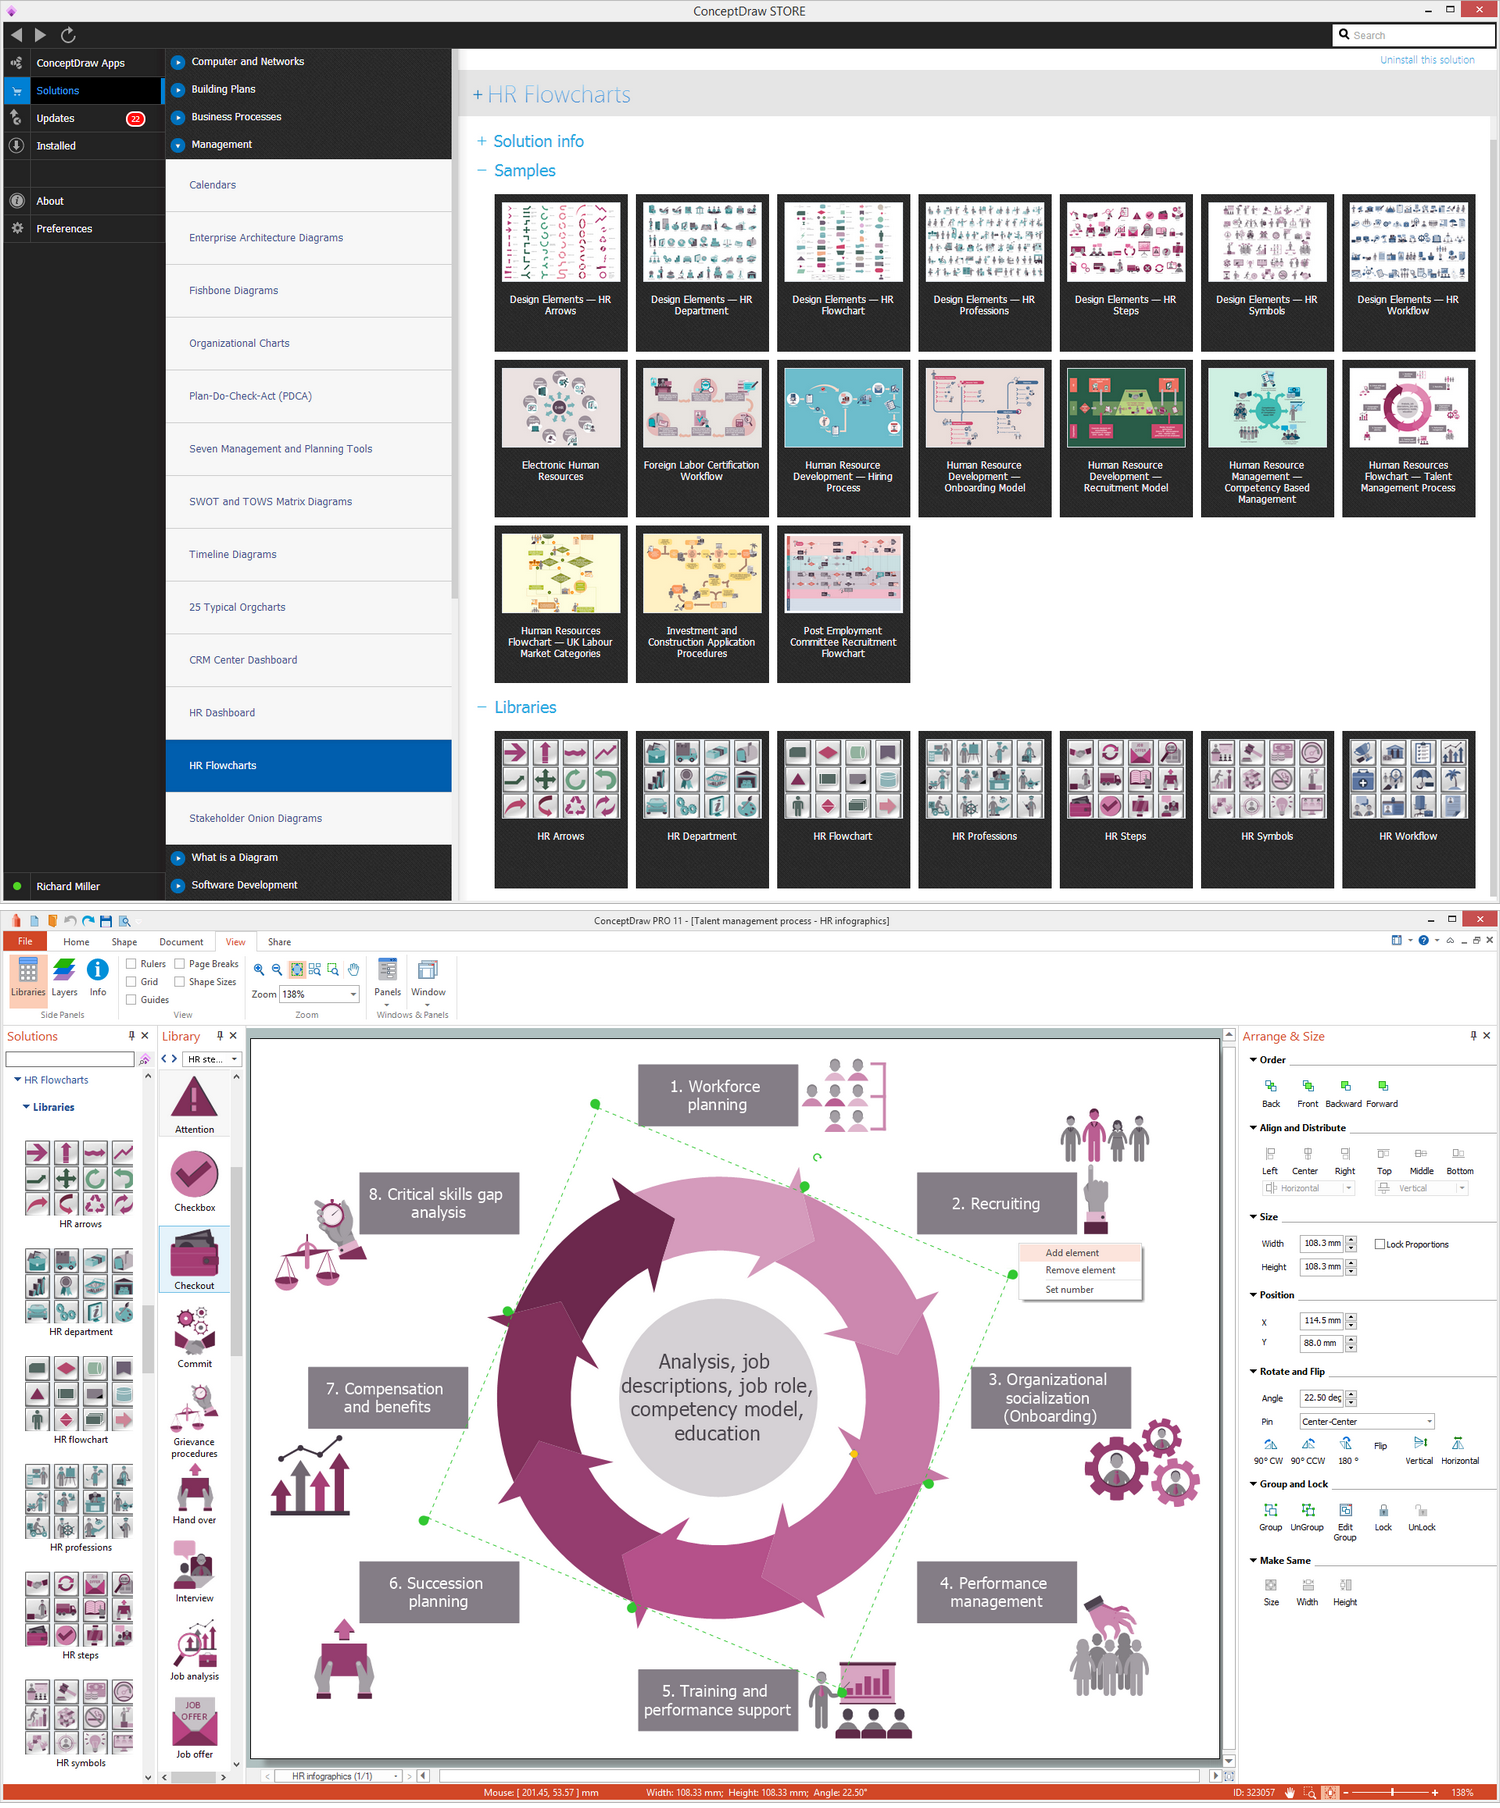
Picture: Human Resources
Related Solution:
Interactive tool helps you find the appropriate response to social media mentions quickly. There are materials to help trainers and consultants develop a social media strategy and provide training for social media groups on how to effectively accomplish their daily work.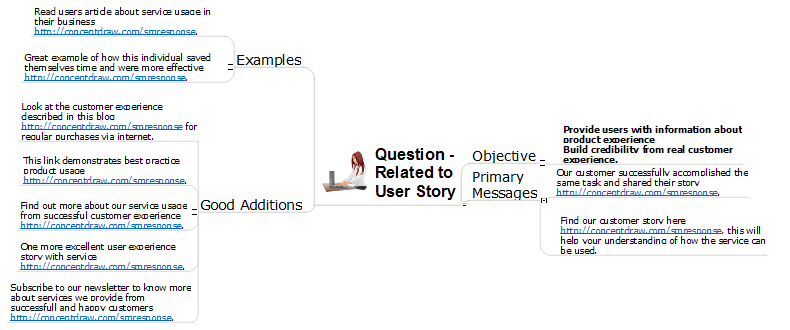
Picture: How to Present a Social Media Response Plan DFD to Your Team
Related Solution:
Use ConceptDraw DIAGRAM software for wireless network design to ✔️ develop Wireless network schematics, ✔️ design Wireless network diagrams, ✔️ illustrate wireless networks of various complexity, purposes, and types, ✔️ display the interactions between network devices, ✔️ indicate network technical capabilities, ✔️ detect and eliminate vulnerabilities, ✔️ introduce protective measures
Picture: What Is a Wireless Network? Professional Network Drawing
Related Solution:
Local area network connects computers and other network appliances within an area, such as office building or a campus. It can be difficult to provide such network without a predesigned plan. For these purposes you can use network diagram software, which helps you to create LAN network diagrams and office network diagrams quickly and effortless. This will speed up your work and you can save the diagram for the future network improvements.
The following diagram illustrates a network topology of the small office. LAN configuration has a star topology. The local network joins 8 computers among which are several desktop PCs, laptop, two iMacs and iBook. The end-point devices are divided into three groups. Each group is connected to its hub. There is a network printer and a modem, which are interconnected with other devices through a network server. Each computer on the LAN can access the server through a corresponding hub.
Picture: Network Diagram Software. LAN Network Diagrams. Physical Office Network Diagrams
Related Solution:
This sample was created in ConceptDraw DIAGRAM diagramming and vector drawing software using the UML Class Diagram library of the Rapid UML Solution from the Software Development area of ConceptDraw Solution Park.
This sample describes the use of the classes, the generalization associations between them, the multiplicity of associations and constraints. Provided UML diagram is one of the examples set that are part of Rapid UML solution.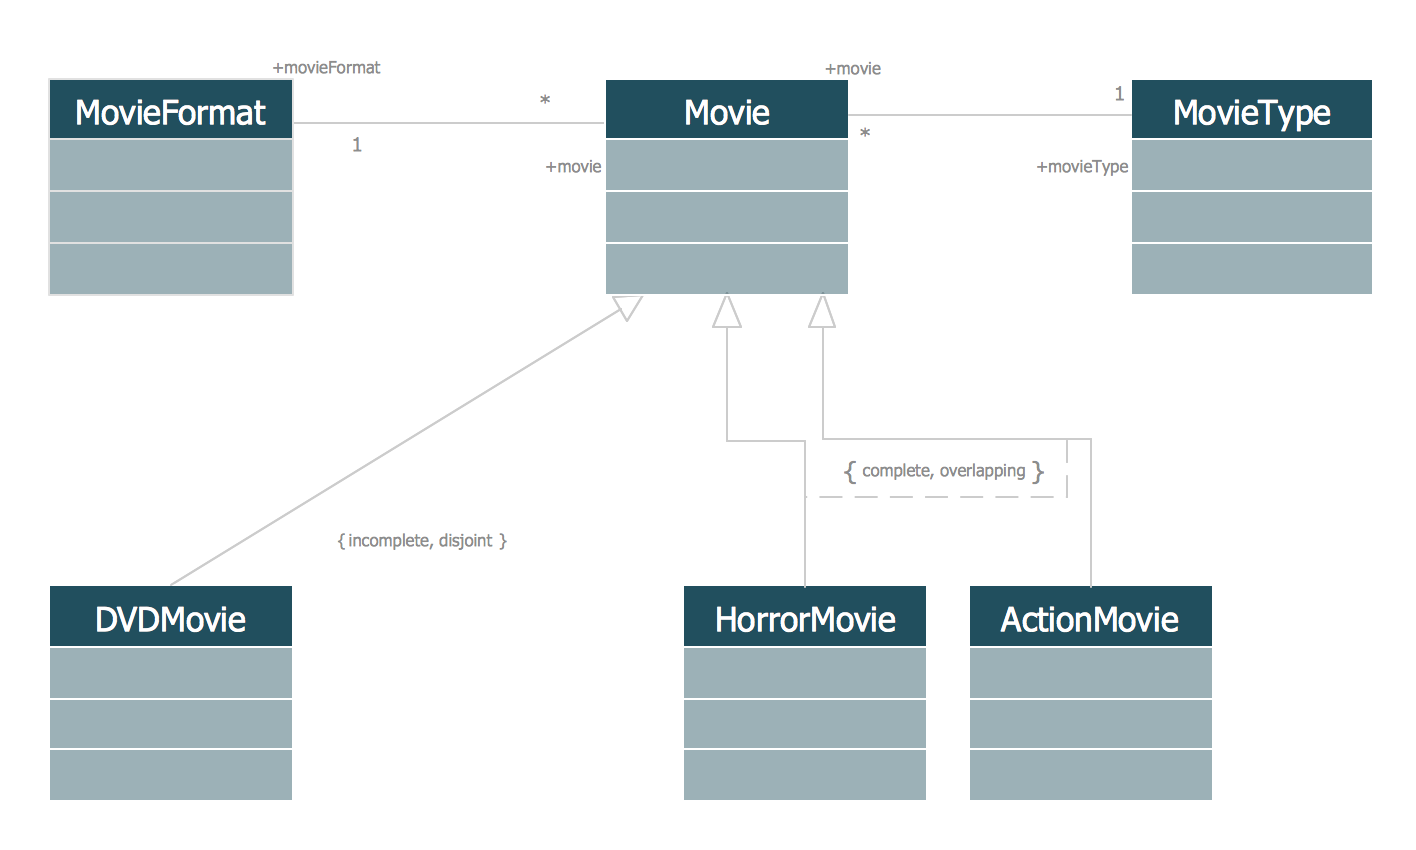
Picture: UML Class Diagram Generalization ExampleUML Diagrams
Related Solution:
There are many ways to define the flow of information within a system. Structured-systems analysis method often uses data flow diagrams to show data flow, data storages and data processing visualization. These diagrams are easy to develop and quite useful.
Here is a dataflow diagram presenting an example of the manufacturing process flow. The oval process shapes represent a process that controls data within the current system. The process may produce data or make some action based on data. Data flows are represented by lines. They show the movement of information through the system. The direction of the data flow is depicted by the arrow. The external entities are shown by rectangles. They represent the external entities interacting with the system. The data store objects (unclosed rectangles) are used to show data bases participating in a process flow.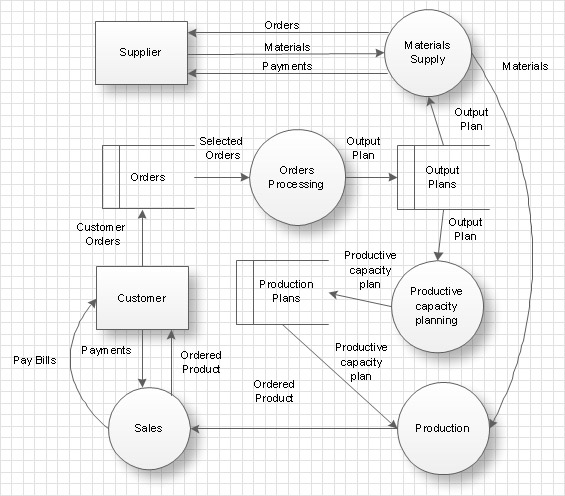
Picture: Data Flow Diagram
Related Solution:
ConceptDraw DIAGRAM extended with Seven Management and Planning Tools Solution from the Management Area of ConceptDraw Solution Park is the best software for drawing all types of diagrams from the Seven Management and Planning Tools: Affinity Diagram, Relations Diagram, Prioritization Matrix, Root Cause Analysis Tree Diagram, Involvement Matrix, PERT Chart, and Risk Diagram (PDPC).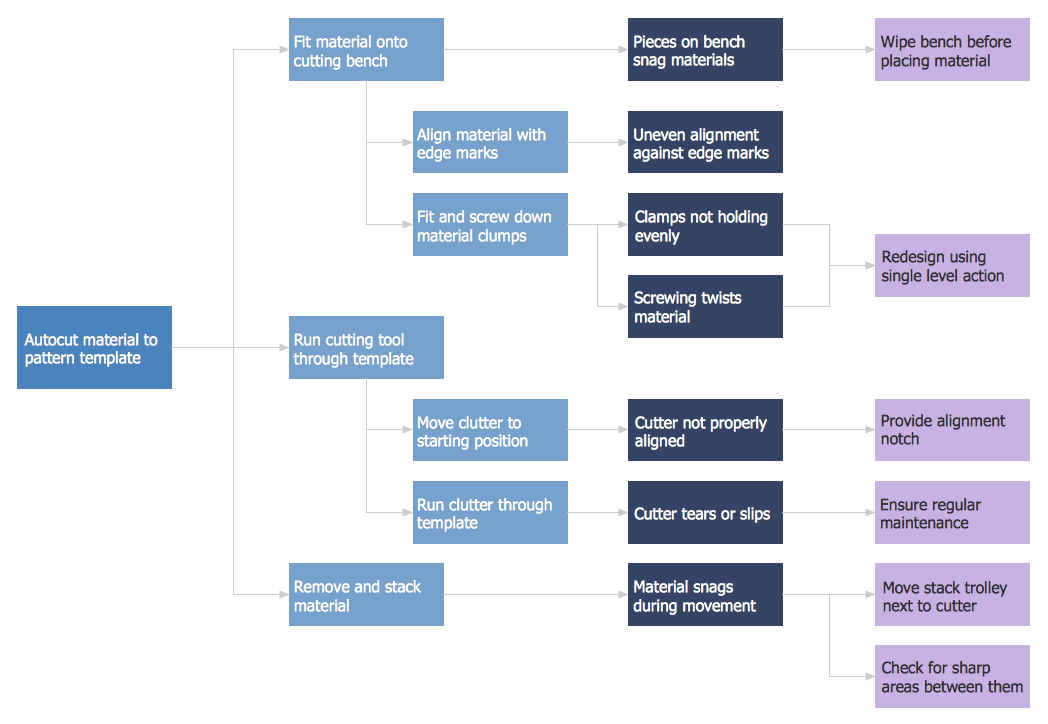
Picture: PDPC
Related Solution:
