Basic Diagramming
Charts and Graphics Drawing Software
ConceptDraw DIAGRAM software is a powerful tool for drawing charts and graphics like:
- flowcharts
- bar charts
- histograms
- pie charts
- divided bar diagrams
- line graphs
- area charts
- scatter plots and others.
Basic Diagramming solution includes 100+ professional-looking business templates and examples that you can modify and make your own graphic documentation.
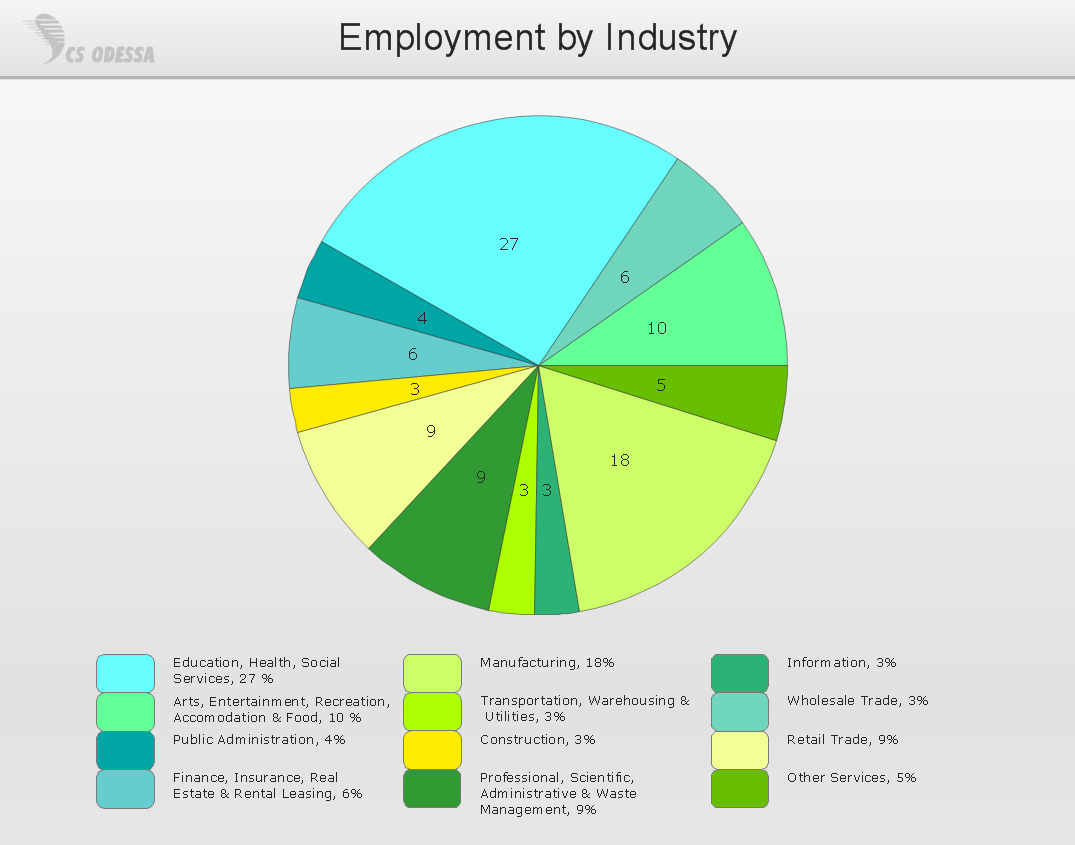
Sample 1. Pie chart - Employment by industry.
This solution extends ConceptDraw DIAGRAM with the specific tools you need to easily draw flowcharts, block diagrams, bar charts, histograms, pie charts, divided bar diagrams, line graphs, area charts, scatter plots, circular arrows diagrams, Venn diagrams, bubble diagrams, concept maps, and others.
Use ConceptDraw DIAGRAM enhanced with Basic Diagramming solution to draw you own diagrams, charts and graphs for graphic communication, explanation of business and personal ideas and concepts, simple visual presentation of numerical data, complex structures, logical relations, step-by-step flows of actions or operations.
TEN RELATED HOW TO's:
Use the Basic Diagramming Solution from the Universal Diagramming area of ConceptDraw Solution Park to easy create simple forms, questionnaires, survey forms, registration and application forms, etc.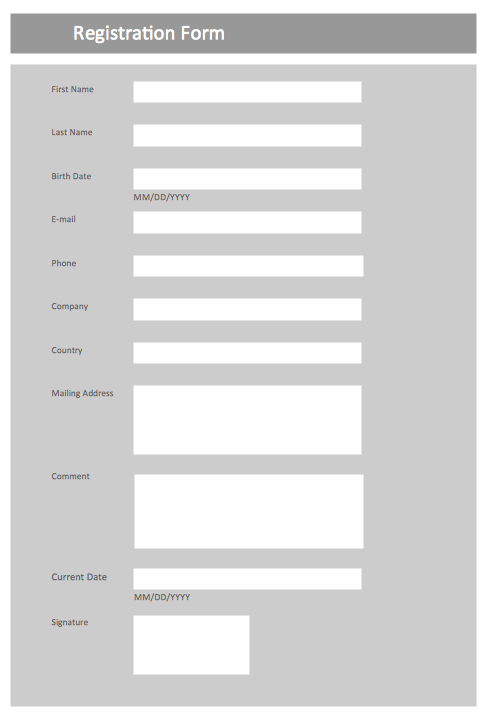
Picture: Form Maker
Related Solution:
This sample was created in ConceptDraw DIAGRAM diagramming and vector drawing software using the Organizational Charts Solution from the Management area of ConceptDraw Solution Park.
The Organizational Chart is a diagram that shows the structure of the organization, different levels of management, hierarchy and the relationships of the organization parts.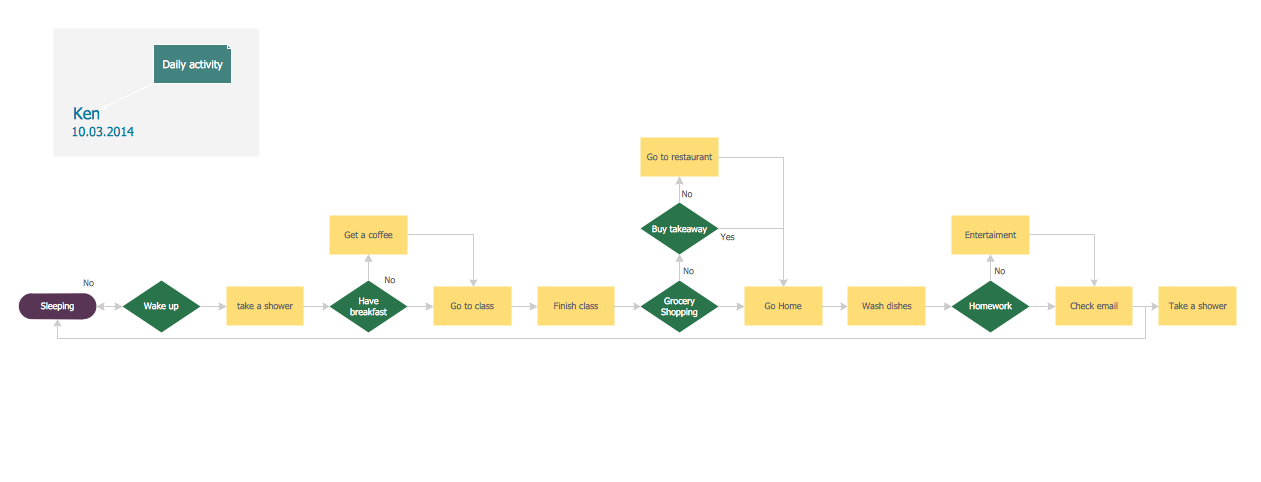
Picture: Horizontal Org Flow Chart
Related Solutions:
Biology is incredibly interesting and useful natural science which studies all living things on the earth (people, animals, plants), structure, functions, interactions, evolution of living organisms. Biologists of the whole world use actively illustrations and drawings in your science and education activity. To facilitate their task of biology drawing, ConceptDraw DIAGRAM diagramming and vector drawing software was extended with Biology solution from the Science and Education area. Now, ConceptDraw DIAGRAM is a powerful biology drawing software.
Picture: Biology Drawing Software
Related Solution:
UML Apartment Plan. This sample was created in ConceptDraw DIAGRAM diagramming and vector drawing software using the UML Class Diagram library of the Rapid UML Solution from the Software Development area of ConceptDraw Solution Park.
This sample show the detailed plan of the apartment and is used by building companies, design apartments, real estate agencies, at the buying / selling of the realty.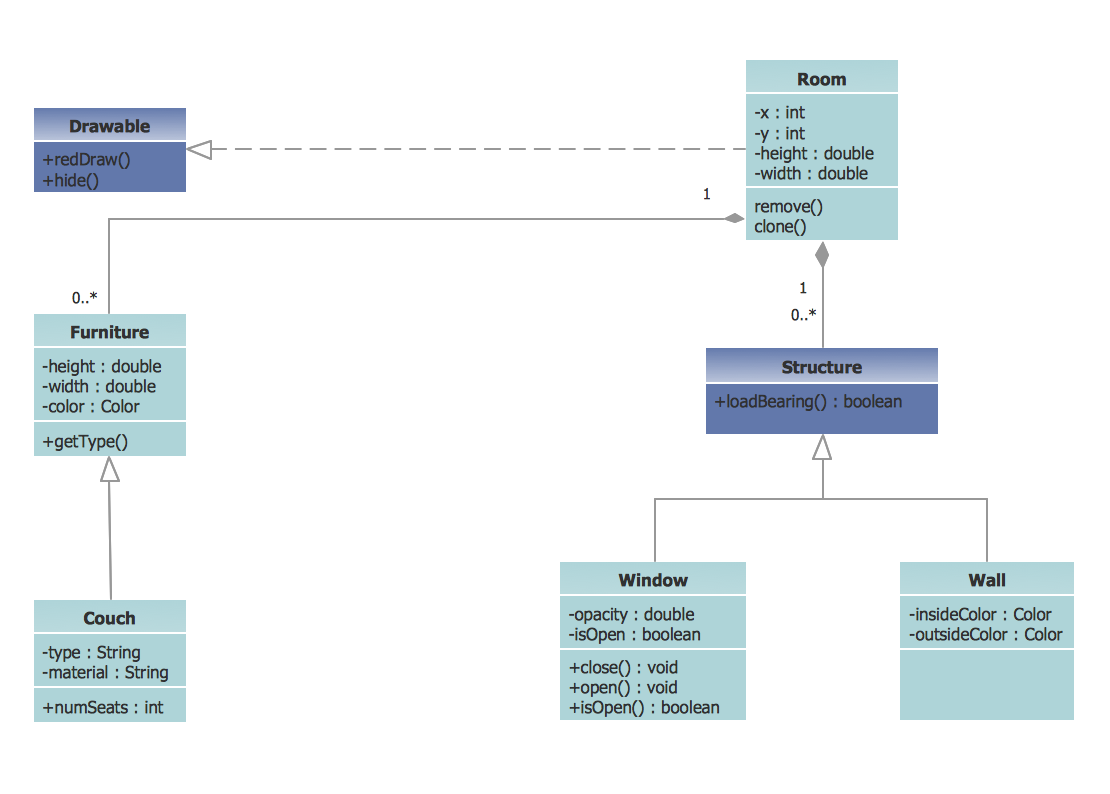
Picture: UML Class Diagram Example - Apartment Plan
Related Solution:
Use building drawing software to develop the annotated diagrams or schematics of waste water disposal systems, hot and cold water supply systems, water lines and waste water engineering.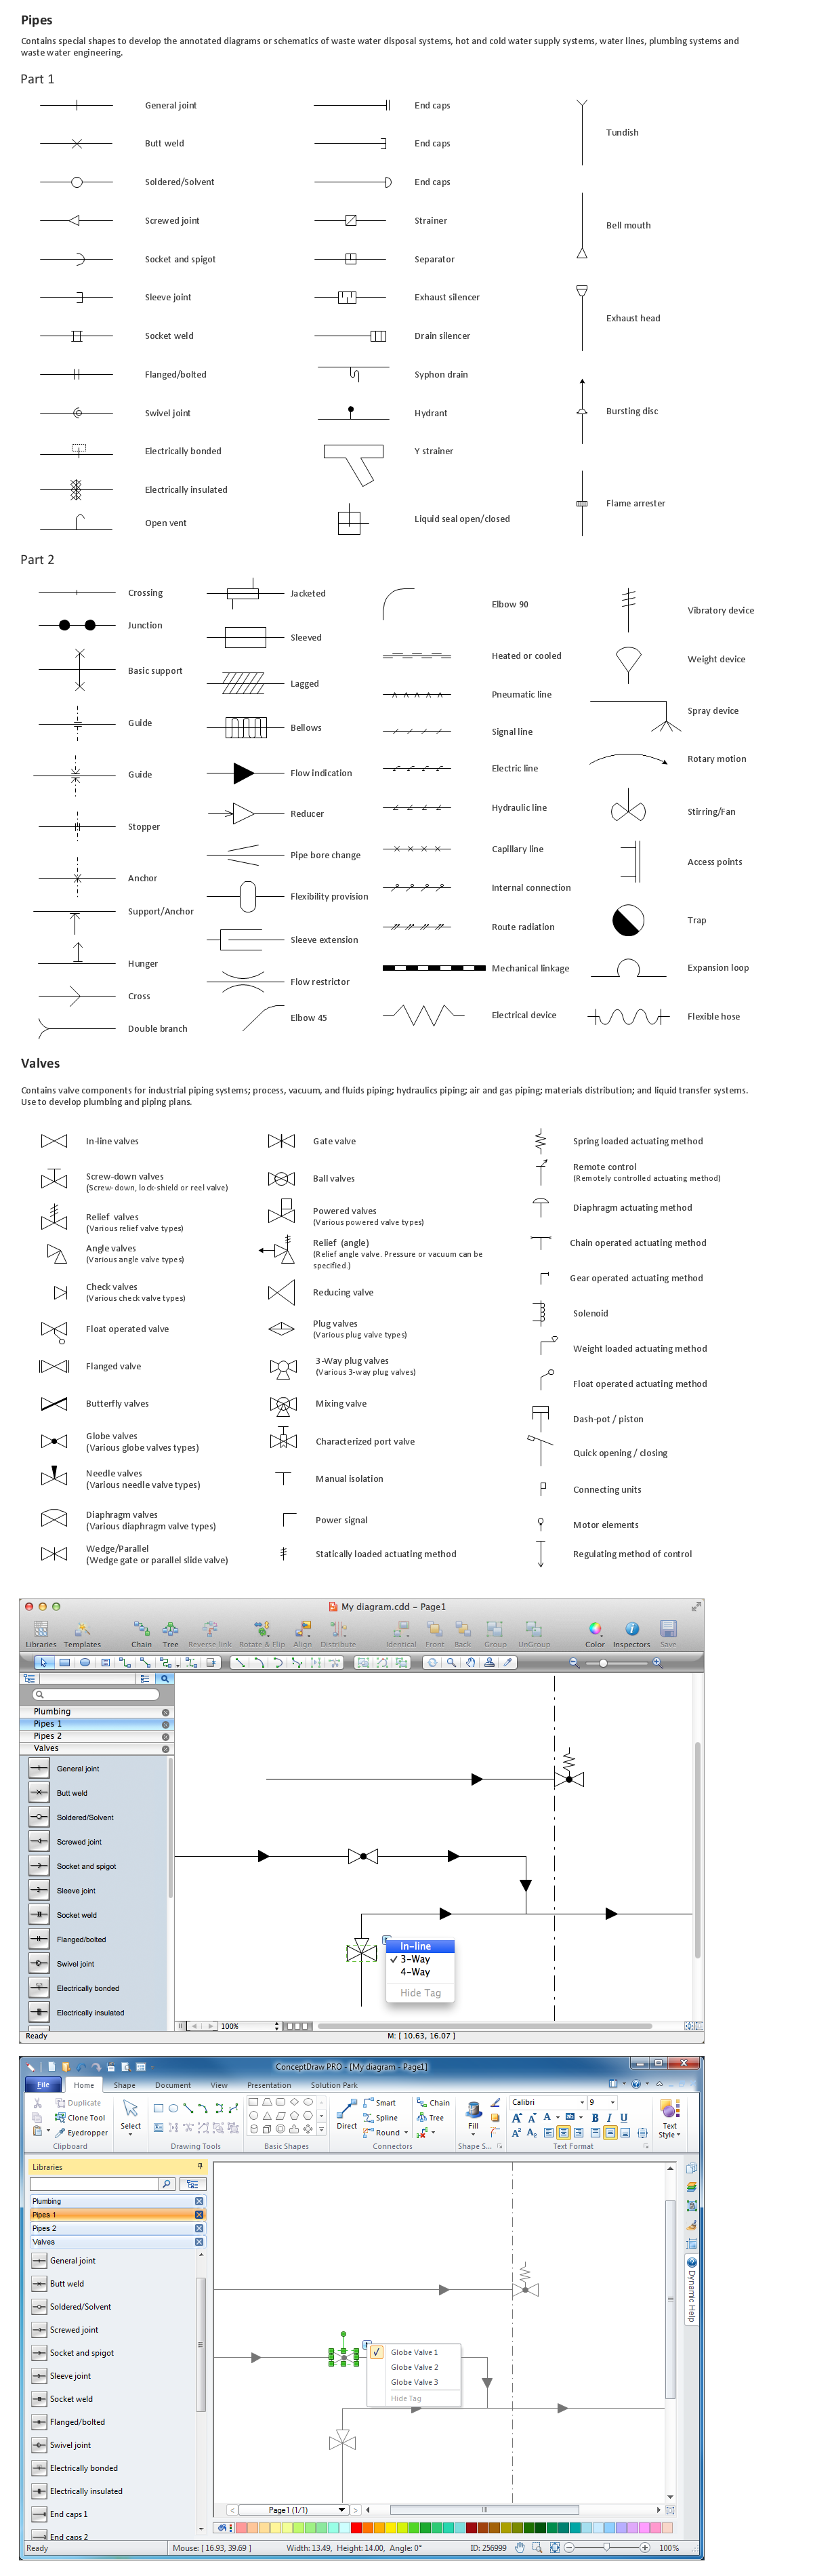
Picture: Building Drawing Software for Design Piping Plan
Related Solution:
Plumbing systems are very important for any manufacture, and it's a good practice to have a clear scheme of that system. To create one, you should use a piping and instrumentation diagram software with a possibility to save files in vector format, so you can print them without quality loss. ConceptDraw DIAGRAM is a great tool for creating diagrams, and you don't need to be very experienced to use it efficiently.
This example of Piping and Instrumentation Diagram (P&ID) depicts a scheme that illustrates the physical sequence and functional communications of piping, instrumentation and plumbing equipment components of a typical food trailer.
Seeking to avoid health troubles in a mobile food service , the plumbing demands for food trailers must be considered accurately. This P&ID shows all of piping including a basic set of piping system components along with multiple sinks, extra water heaters and other elements to meet health guidelines.
Picture: Piping and Instrumentation Diagram Software
Related Solution:
Use ConceptDraw DIAGRAM diagramming and business graphics software for drawing your own PM life cycle flow charts.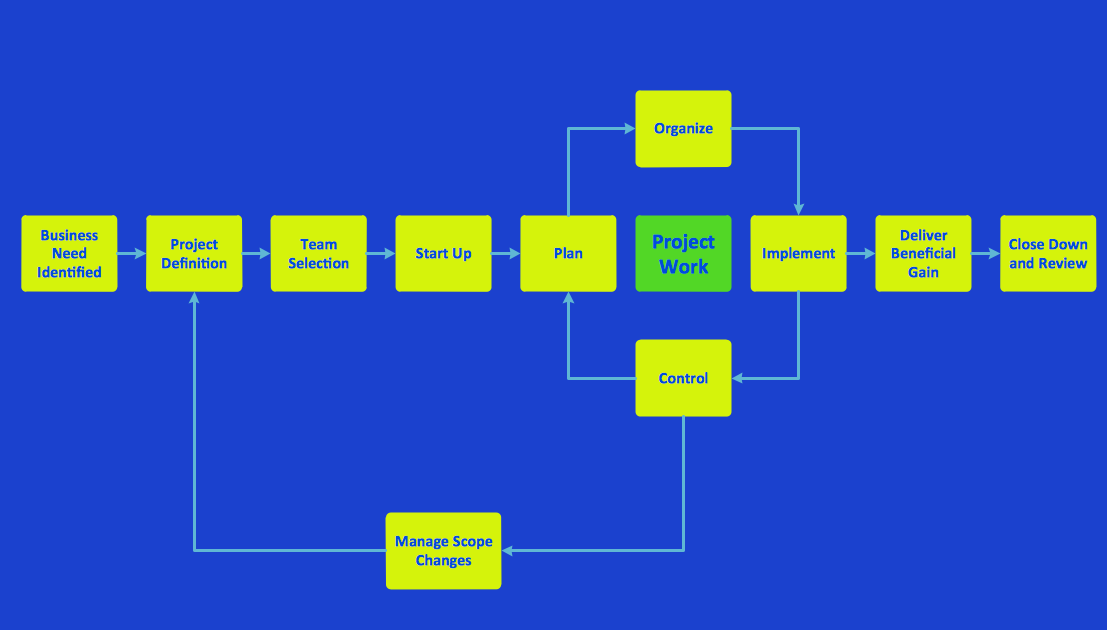
Picture: Program to Make Flow Chart
Related Solution:
ConceptDraw DIAGRAM is a powerful intelligent vector graphics engine that can be used to create basic diagrams including flowcharts, charts, workflows, flowcharts, organizational charts, business diagram, learn business diagrams, flow diagrams.
Picture: The Best Mac Software for Diagramming or Drawing
Related Solution:
When we start to speak about databases, we must always mention database structure visualization. One of the most common ways to do it is to create an entity relationship diagram, and to put appropriate symbols on it. It is important either for database projecting and for its' future maintenance.
Entity Relationship Diagram describes data elements and their relationships within a database. There are a set of special symbols that depict each element of an entity relationship diagram. Entities - represents some stable components such as supplier, employee, invoice, client, etc. Relation symbols show how the entities interact. Attributes define characteristics of the relationships. Attributes can be one-to-one or many-to-many. Physical symbols is used in the physical models. They represent items such as fields, tables, types and keys. ERD physical symbols are the building material for the database. Notation lines are used to illustrate the relationships. The most common method is Crow’s Feet notation. You can use ConceptDraw Entity-Relationship Diagram (ERD) solution to represent a database using the Entity-Relationship model.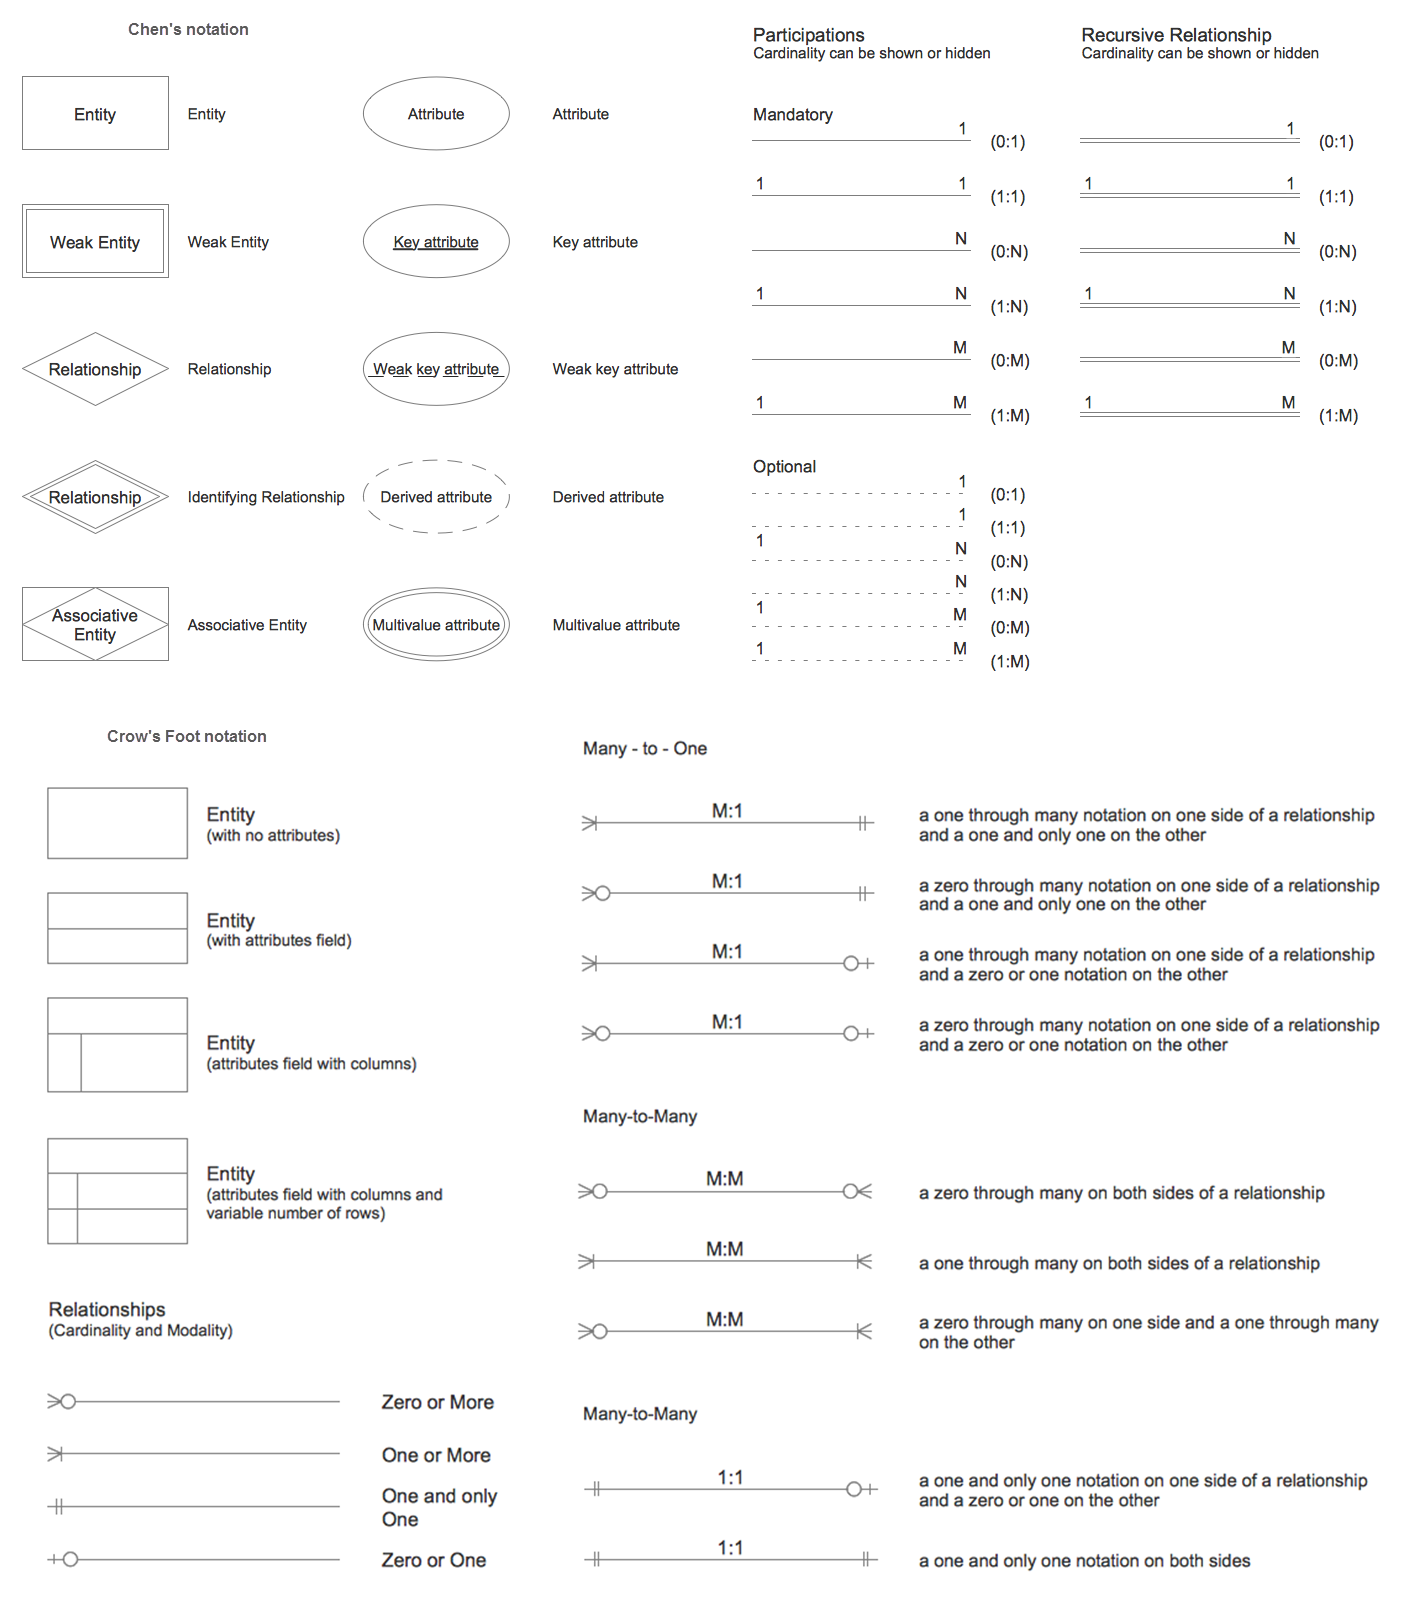
Picture: Entity Relationship Diagram Symbols
Related Solution:
Easy charting software comes with beautiful chart templates and examples. This makes it easy to create professional charts without prior experience.
Graphs and Charts Area provide a wide collection of professional looking predesigned templates, samples and ready-to-use vector stencils that will help you to draw the charts and diagrams of various types: Pie Charts, Donut Charts, Line Charts, Column Charts, Bar Charts, Pyramids, Scatter Charts, Venn Diagrams, Spider Charts, Area Charts, Divided Bar Graphs.
Picture: Chart Software for Better Presentations
Related Solution: