Draw Company Structure with Organization Charting Software
Company Structure Diagram gives the detailed information about the company structure and hierarchy - who execute what tasks and who is in charge at this company. This information shows the reasoning and success of business and is indispensable for investors and financial institutions.
ConceptDraw DIAGRAM is a powerful intelligent vector graphics engine that can be used for basic diagramming. Various flowcharts, block diagrams, histograms, pie charts, divided bar diagrams, line graphs, circular arrows diagrams, Venn diagrams, bubble diagrams and concept maps, and others can be generated with ease and then successfully used to visually communicate business and personal ideas and concepts, general structures and activities.
You need create Company Structure Diagram quick and easy? ConceptDraw DIAGRAM extended with Organizational Charts Solution from the Management Area has become the best Organization Charting Software that will help you effectively!
Sample 1. Organizational chart - New York State Education Department.
This sample was created in ConceptDraw DIAGRAM using the Organizational Charts Solution from the Management Area of ConceptDraw Solution Park and shows the organizational structure of New York State Education Department.
Use Organizational Charts solution for ConceptDraw DIAGRAM to create your own Company Structure Diagrams in minutes.
The Company Structure Diagrams designed with ConceptDraw DIAGRAM are vector graphic documents and are available for reviewing, modifying, converting to a variety of formats (image, HTML, PDF file, MS PowerPoint Presentation, Adobe Flash or MS Visio), printing and send via e-mail in one moment.
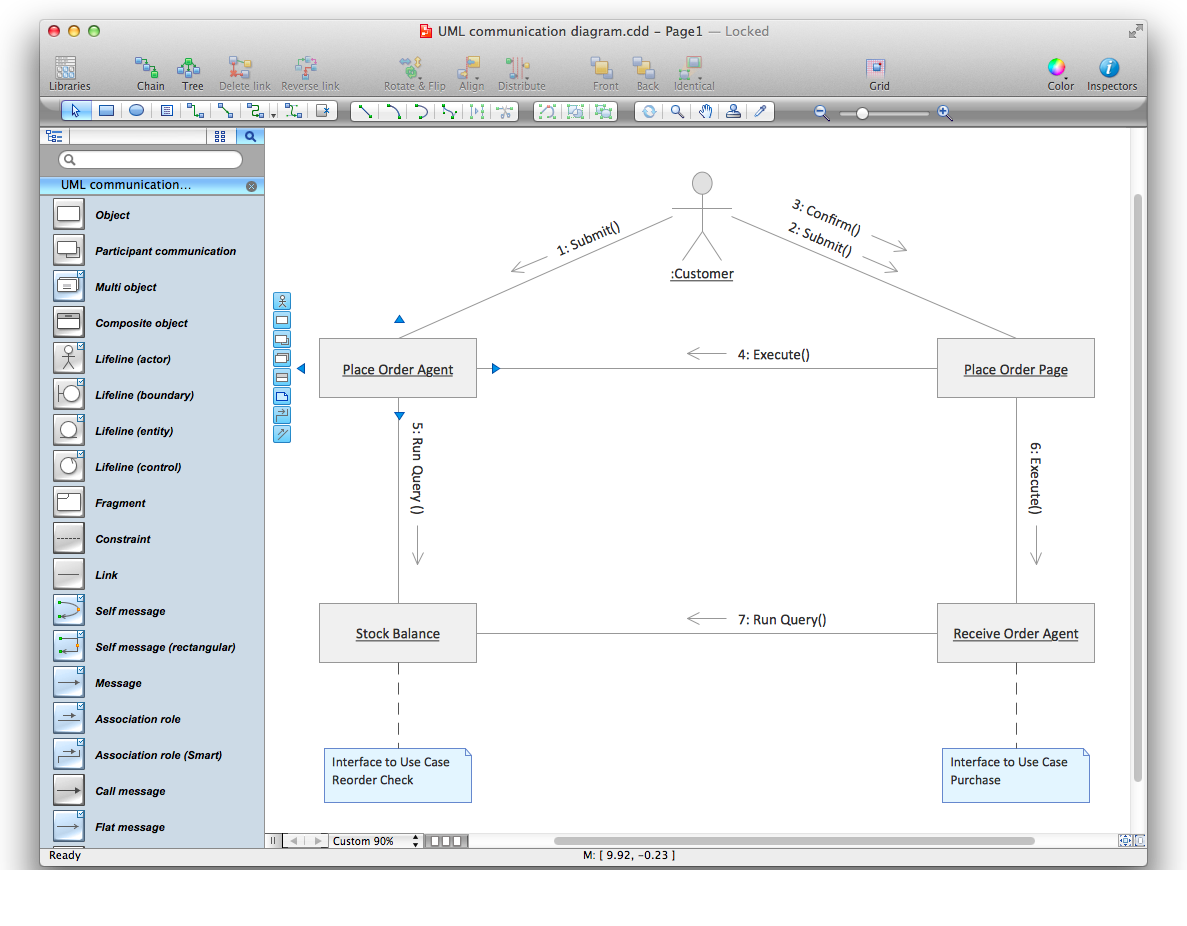
UML Communication Diagram depicts the interactions between objects or parts in terms of sequenced messages and describes both the static structure and dynamic behavior of a system.
Picture: Diagramming Software for Design UML Communication Diagrams
UML Deployment Diagram depicts the physical deployment of artifacts on nodes (nodes are the existing hardware components, artifacts are the software components running on each node); and how the different pieces are connected.
Use ConceptDraw DIAGRAM with UML deployment diagram templates, samples and stencil library from Rapid UML solution to model the physical deployment of artifacts on nodes of your software system.
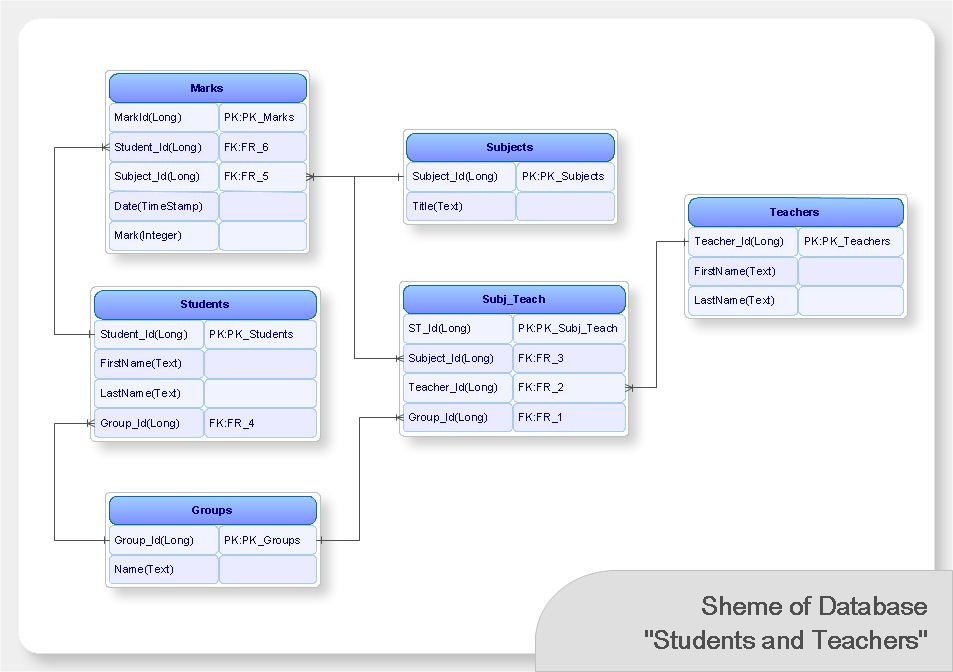
ConceptDraw DIAGRAM is a very easy-to-use and intuitive database design tool which can save you hundreds of work hours. See database diagram samples created with ConceptDraw DIAGRAM database modeling database diagram software.
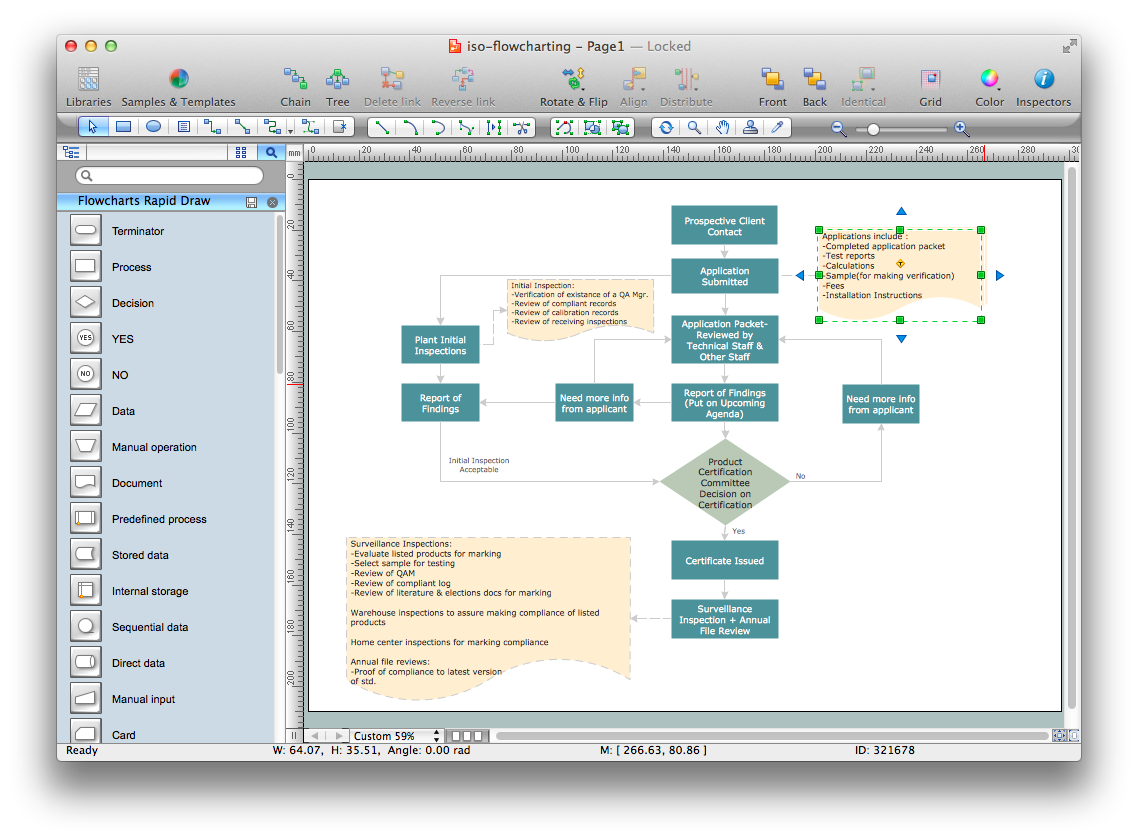
Quality Control Chart Software (ISO Flowcharting) - ConceptDraw DIAGRAM extended with Total Quality Management TQM Diagrams Solution from the Quality Management Area is the best diagramming and vector drawing software that allows you to draw the quality control charts quick and easy.
The quality control chart is a graphic that illustrates the accordance of processes or products to the intended specifications and degree of differences from them. Depending on what type of data you need analyze, there are used different types of quality control charts: X-bar charts, S charts, Np charts.
Picture: Quality Control Chart Software — ISO Flowcharting
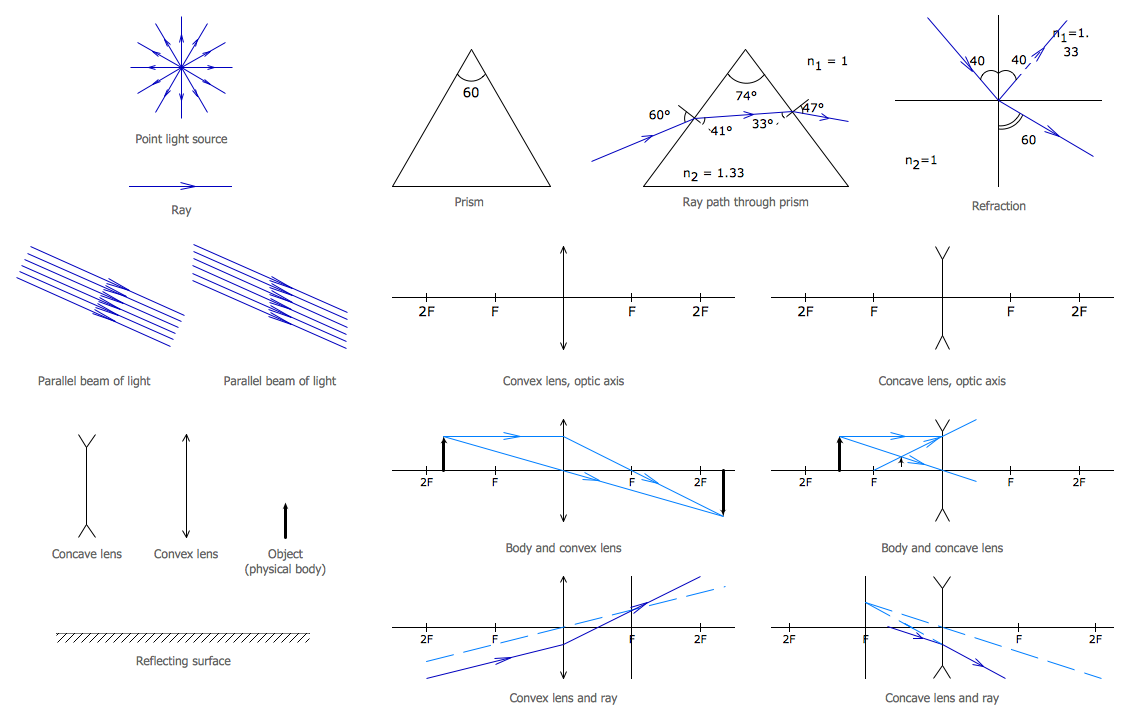
ConceptDraw DIAGRAM diagramming and vector drawing software extended with Physics solution from the Science and Education area is a powerful software for creating various physics diagrams.
Physics solution provides all tools that you can need for physics diagrams designing. It includes 3 libraries with predesigned vector physics symbols: Optics Library, Mechanics Library and Nuclear Physics Library.
Garrett IA diagrams are used at development of Internet-resources, in particulars at projecting of interactions of web-resource elements. The diagram of information architecture of the web resource which is constructed correctly with necessary details presents to developers the resource in comprehensible and visual way.
Picture: Garrett IA Diagrams with ConceptDraw DIAGRAM
With ConceptDraw Arrows10 Technology - You can delete a single connector, by using the Delete key. If you need to delete more than a single connector in a complex diagram that contains many relations there is a special Delete Links tool which deletes the connectors only, no other drawing objects are deleted.
The EPC diagram shows various business processes in terms of work flows.
Event-Driven Process chain Diagrams for improvement throughout an organisation.
ConceptDraw DIAGRAM - software that reduces the time needed to create a business process model and is great business process improvement tools.
Picture: The Best Tool for Business Process Modeling