Basic Diagramming
Examples and Templates Included in ConceptDraw
ConceptDraw contains many examples and templates for simple drawing various diagrams like flowcharts, cross-functional charts, shipping flowcharts, block diagrams, bar charts, histograms, pie charts, divided bar diagrams, line graphs, area charts, scatter plots, circular arrows diagrams, Venn diagrams, bubble diagrams, concept maps, and others.
Basic Diagramming solution includes 100+ professional-looking business templates that you can modify and make your own.

Sample 1. Flowchart - Synthetic Object Construction.
This solution extends ConceptDraw DIAGRAM with the specific tools you need to easily draw flowcharts, block diagrams, bar charts, histograms, pie charts, divided bar diagrams, line graphs, area charts, scatter plots, circular arrows diagrams, Venn diagrams, bubble diagrams, concept maps, and others.
Use ConceptDraw DIAGRAM enhanced with Basic Diagramming solution to draw you own diagrams, charts and graphs for graphic communication, explanation of business and personal ideas and concepts, simple visual presentation of numerical data, complex structures, logical relations, step-by-step flows of actions or operations.
TEN RELATED HOW TO's:
Create flowcharts, organizational charts, bar charts, line graphs, and more with ConceptDraw DIAGRAM.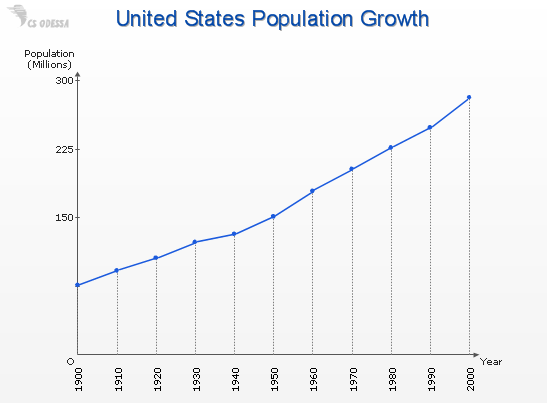
Picture: Basic Diagramming
Related Solution:
The behavior of worker in organization is influences organizational effectiveness. A simple block diagram made with ConceptDraw Block diagrams solution can improve the understanding of expectations of workers regarding what they l contribute to organization and what they wait to obtain. Making block diagram depicting the individual behavior in organization is used in HR management to obtain an optimal and positive overall contribution to the organization.
The behavior of worker in organization is influences organizational effectiveness. A simple block diagram made with ConceptDraw Block diagrams solution can improve the understanding of expectations of workers regarding what they l contribute to organization and what they wait to obtain. Making block diagram depicting the individual behavior in organization is used in HR management to obtain an optimal and positive overall contribution to the organization.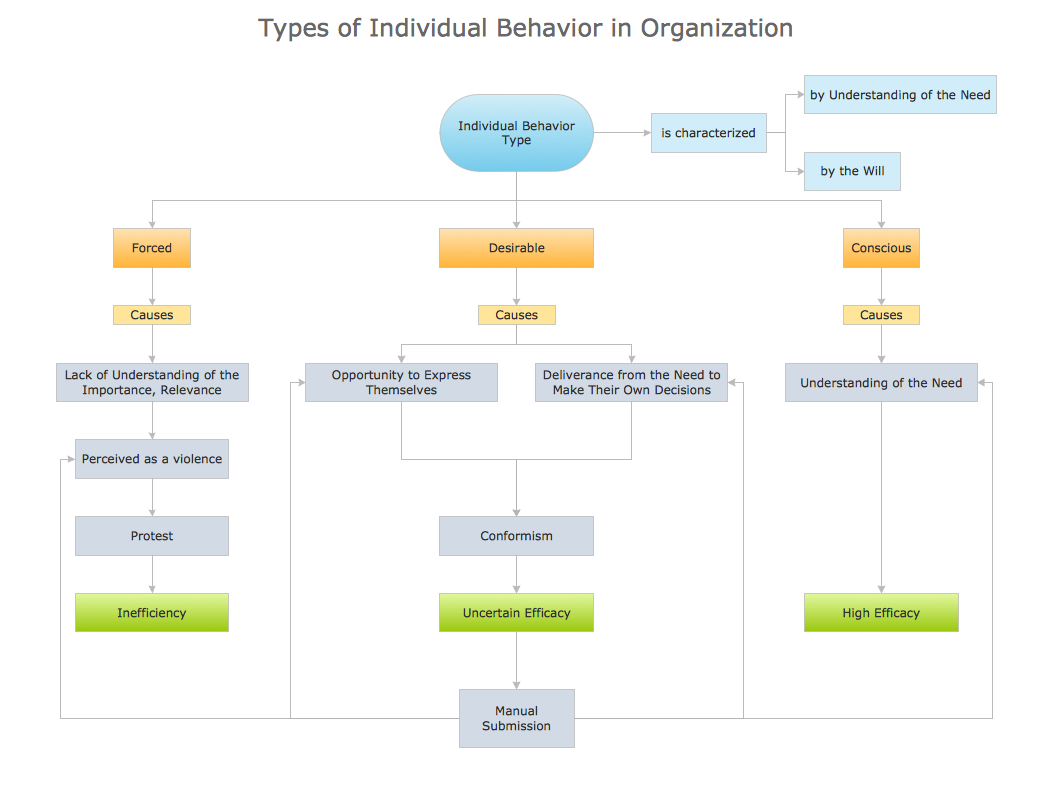
Picture: Basic Diagramming
Related Solution:
When trying to figure out the nature of the problems occurring within a project, there are many ways to develop such understanding. One of the most common ways to document processes for further improvement is to draw a process flowchart, which depicts the activities of the process arranged in sequential order — this is business process management. ConceptDraw DIAGRAM is business process mapping software with impressive range of productivity features for business process management and classic project management. This business process management software is helpful for many purposes from different payment processes, or manufacturing processes to chemical processes. Business process mapping flowcharts helps clarify the actual workflow of different people engaged in the same process. This samples were made with ConceptDraw DIAGRAM — business process mapping software for flowcharting and used as classic visio alternative because its briefly named "visio for mac" and for windows, this sort of software named the business process management tools.
This flowchart diagram shows a process flow of project management. The diagram that is presented here depicts the project life cycle that is basic for the most of project management methods. Breaking a project into phases allows to track it in the proper manner. Through separation on phases, the total workflow of a project is divided into some foreseeable components, thus making it easier to follow the project status. A project life cycle commonly includes: initiation, definition, design, development and implementation phases. Distinguished method to show parallel and interdependent processes, as well as project life cycle relationships. A flowchart diagram is often used as visual guide to project. For instance, it used by marketing project management software for visualizing stages of marketing activities or as project management workflow tools. Created with ConceptDraw DIAGRAM — business process mapping software which is flowcharting visio alternative or shortly its visio for mac, this sort of software platform often named the business process management tools.
Picture: Process Flowchart
Related Solution:
These employment forms will help you in the process of management, recruiting and hiring the employees.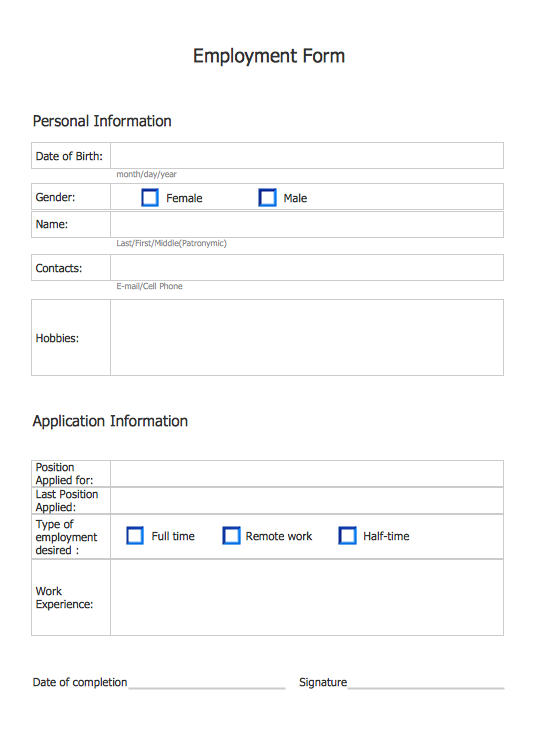
Picture: Employment Form Software
Related Solution:
Onion diagram is a type of circular diagram that consists of the core circle representing the product/solution and concentric circles around it, which dependent on the core and look like the cross sections of onion.
ConceptDraw DIAGRAM diagramming and vector drawing software supplied with Stakeholder Onion Diagrams Solution from the Management Area of ConceptDraw Solution Park is an ideal software for effective Onion diagram process design.
Picture: Onion Diagram Process Design
Related Solution:
Describing a workflow or approval process can take hours and be too complicated, especially since there are options to do it quickly and vividly. Diagrams called flowcharts replace long paragraphs of boring text and represent information in a graphic way. You can draw one on paper or you can use flowchart software to do it quickly and scalable. This kind of software is easy to use and you don’t need any special skills to start using it. In addition, there are a lot examples and predesigned templates on the Internet.
Flowcharts are a best tool for staking out a huge and complex process into some small readable parts. Surely, flowcharts can be drawn manually but the use of standard symbols that make it clear for a wide audience makes a software tool preferred for this task. The core for a successful flowchart is its simplicity. That is why often before beginning making flowchart through software, people draw the sketch on a piece of paper. Designing an effective flowchart means the combination of the data needed to be shown and the simplicity with which you depict it.
Picture: Flowchart Software
Related Solution:
Make diagrams, charts, workflows, flowcharts, org charts, project charts easily with ConceptDraw software.
Picture: Best Program to Make Diagrams
Related Solution:
ConceptDraw DIAGRAM is a business flowchart software includes the wide flowchart examples package.
Picture: Basic Flowchart Examples
Related Solution:
The ConceptDraw Flowchart component includes a set of samples and templates. This geathered as flowchart maker toolbox which focused on drawing flowcharts of any industry standards.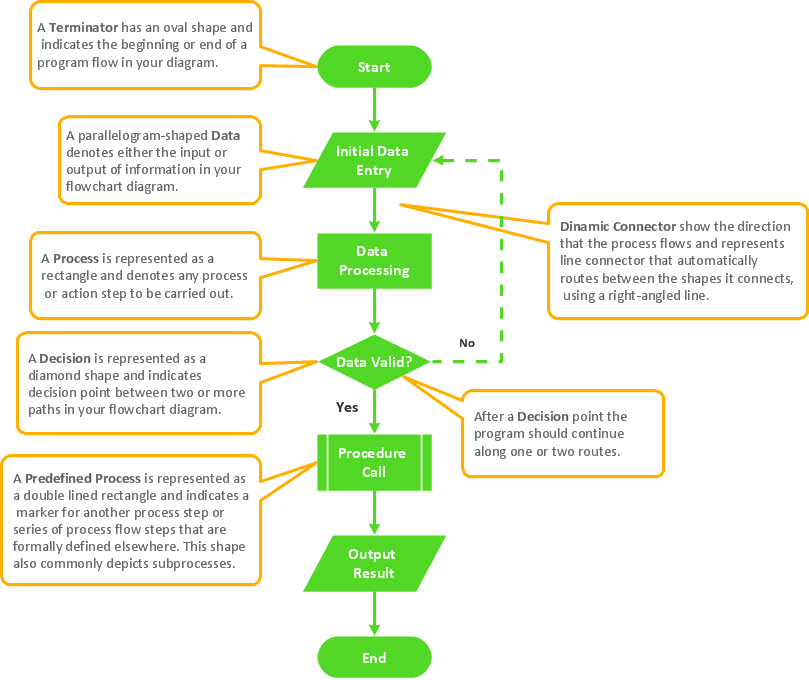
Picture: Flowchart Components
Related Solution: