SIPOC Diagram
A “diagram” is known to be a “symbolic representation of information using different visualization techniques”. Such representations are very widely used nowadays, becoming more and more popular since the “Age of Enlightenment”, or the “Age of Reason”, which was a philosophical and also intellectual movement, dominated the world of ideas in Europe in the 18th century (also known as the “Century of Philosophy”).These techniques include the use of the 3D visualization. This “three-dimensional” type of visualization is later gets projected onto a “two-dimensional” one, or 2D, surface.
The word “diagram” itself can be sometimes used instead of a word “graph”, as its synonym, although the first one is still more commonly used, having general and specific meaning. The term “diagram” is used as a collective term standing for the whole class of technical genres, such as tables, technical drawings and graphs. “Diagram” is a specific kind of a visual display, with the help of which it is simpler to show the qualitative data with the usage of the different shapes, which are connected with the aid of lines, arrows and other visual links. The term “diagram” can also be used in other ways. Thus, it is a simply pictorial and abstract representation of some particular kind of information. The “line graphs”, “maps”, “bar charts”, “architects’ sketches” and “engineering blueprints” are all the variations of diagrams.
Some of the diagrams may include images, as well as photographs and even some video, but most of them do not. Diagrams can also be described as the graphical and abstract portrayals of some subject matter, which they are meant to represent. Both diagrams and charts are known to be contrasting with any technical illustrations, technical drawings, infographics as well as computer graphics in a way of showing more abstract, but literal representations of information. The essence of a diagram can be seen as a display, not showing any of the numerical data, but the abstract information, as well as the relationship of its parts. They can be also treated as a form of so-called “visual formatting” devices. The diagrams may include the building blocks, for example: geometrical shapes all connected with the help of lines, arrows and other visual links.
One of the diagrams is a SIPOC one, also known as COPIS. In process improvement, SIPOC itself is a tool, which the help of which it is simpler to summarize all of the outputs as well as inputs of one or more processes in a way of a “table form”. The acronym “SIPOC” stands for the inputs, processes, outputs, suppliers and customers, forming the columns of the table. SIPOC was in use at least since 1980 and it is still widely utilized today in such spheres of business, as business process management, lean manufacturing and “Six Sigma”, which is a set of techniques and tools for process improvement.
To emphasize putting the needs of the customers, this tool is sometimes called as “COPIS”. The process information in this case is filled in with the customer as well as working upstream to the supplier. The “SIPOC” is often presented at the initial stage of the process improvement efforts (for example, the Kaizen events) or during the "define" phase of the so-called “DMAIC” process, which refers to a data-driven improvement cycle, being used for optimizing, stabilizing and improving the business designs and processes.
“SIPOC” has 3 typical uses, depending on its audience, which include the one to help people in defining a new process, another — to give people, who are unfamiliar with a process, a high-level overview, and the last — to reacquaint those people, whose familiarity with a process was faded or become out-of-date, because of the process changes. There are several aspects of the “SIPOC”, that may not be readily apparent and they are the inputs and outputs, which may be services, information or materials. The other aspects are “suppliers” and “customers”, which may be internal or external to the organization, which performs the process itself. The focus is usually on capturing the set of both inputs and outputs, but on the individual steps in the process.

Example 1. SIPOC Diagram — Alternative Dispute Resolution Process
Creating your own SIPOC Diagram may be a challenge, but having it made with the help of ConceptDraw DIAGRAM can take only a few hours, or even minutes, as now this software is extended with so-called “Business Process Mapping Solution”. Business Process Mapping Solution can be found in another product of CS Odessa — ConceptDraw STORE — as well as in the “Business Processes Area” of “ConceptDraw Solution Park”, and so downloaded from there. The simplest way of creating a “SIPOC Diagram” using the ConceptDraw DIAGRAM software is to use the already previously created SIPOC Diagram templates as the base. All of the samples are included in Business Process Mapping Solution, the one available for all ConceptDraw DIAGRAM users in the ConceptDraw STORE.
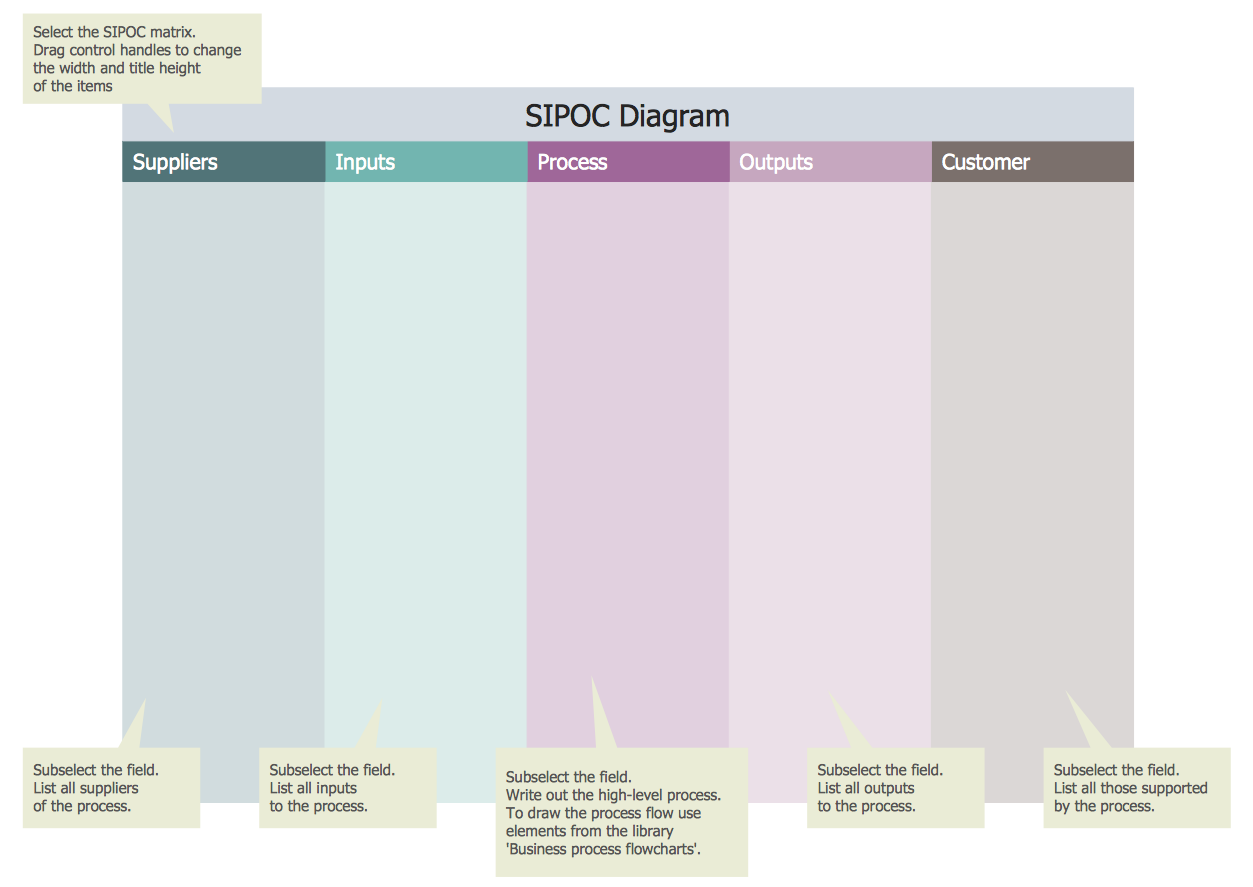
Example 2. SIPOC Diagram Template
To make the needed great looking diagram you may simply open the existing SIPOC Diagram template and fill it the way you want it to be filled. This fun and entertaining process of creating something truly good looking and smart can take only a few minutes before your professionally looking SIPOC Diagram is ready. It is always your own choice whether to edit the existing template or to create a SIPOC Diagram from a scratch, but it must be much more convenient to use the ready-to-use vector objects, which can be found in the stencil libraries — design elements and symbols. Lots of objects as well as icons were developed especially for ConceptDraw DIAGRAM users and they are represented by three different libraries of “Business Process Mapping Solution”, which are “SIPOC Diagrams library”, “Swim Lanes library” and the one called “Business Process Flowcharts library”. You can always use any of the mentioned libraries as well as the elements from them having the Business Process Mapping Solution in terms of using it while working in the ConceptDraw DIAGRAM software in order to design your own SIPOC Diagrams quickly and effectively.

Example 3. SIPOC Diagram - Hiring Process
The SIPOC Diagrams you see on this page were created in ConceptDraw DIAGRAM using the Business Process Mapping Solution for ConceptDraw Solution Park. These samples successfully demonstrate solution's capabilities and professional results you can achieve. An experienced user spent 10—15 minutes creating each SIPOC Diagram.
Use the Business Process Mapping Solution for ConceptDraw DIAGRAM software to design your own SIPOC Diagrams quick, easy and effective.
All source documents are vector graphic documents. They are available for reviewing, modifying, or converting to a variety of formats (PDF file, MS PowerPoint, MS Visio, and many other graphic formats) from the ConceptDraw STORE. The Business Process Mapping Solution is available for all ConceptDraw DIAGRAM users.
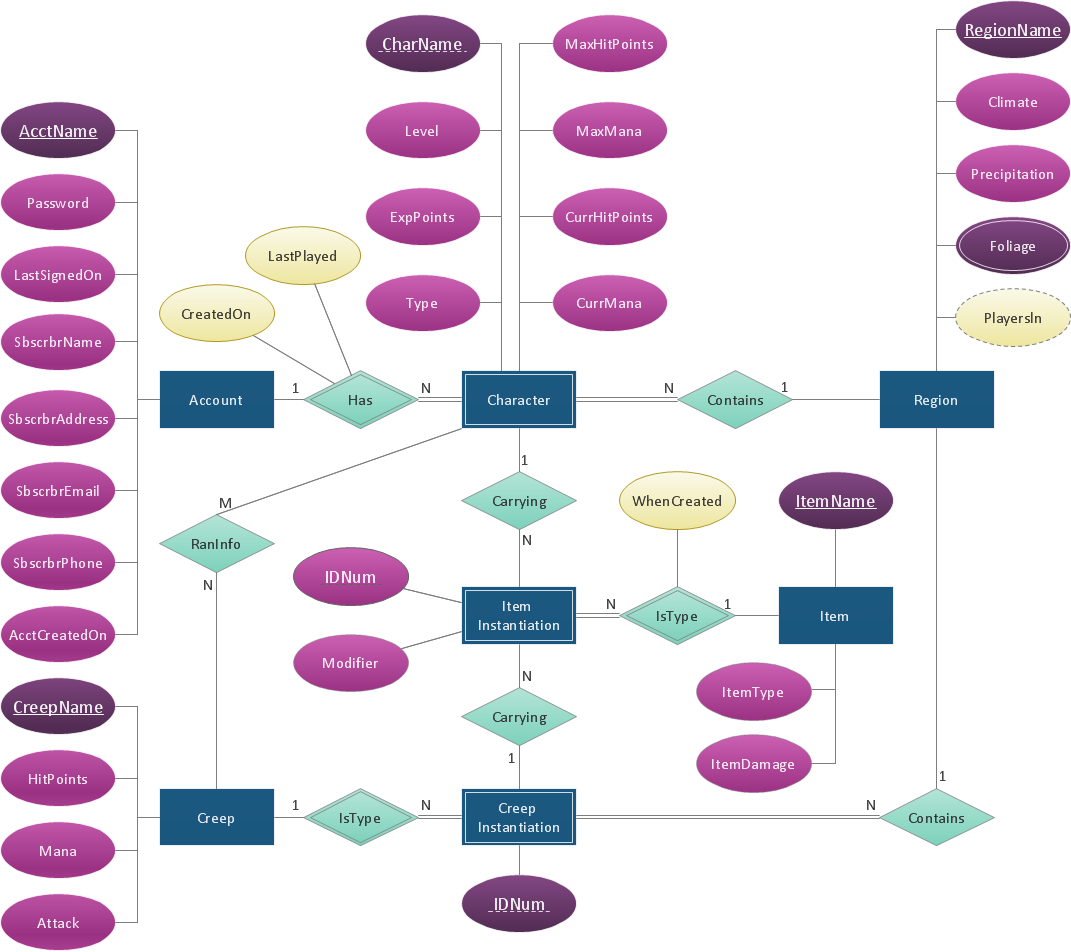
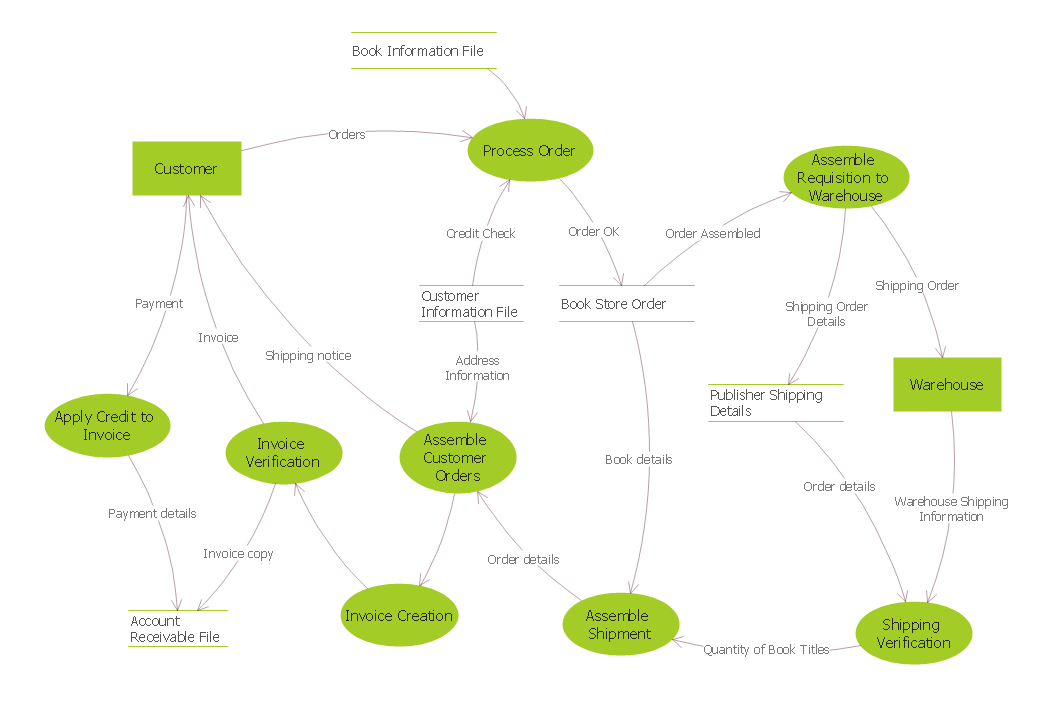

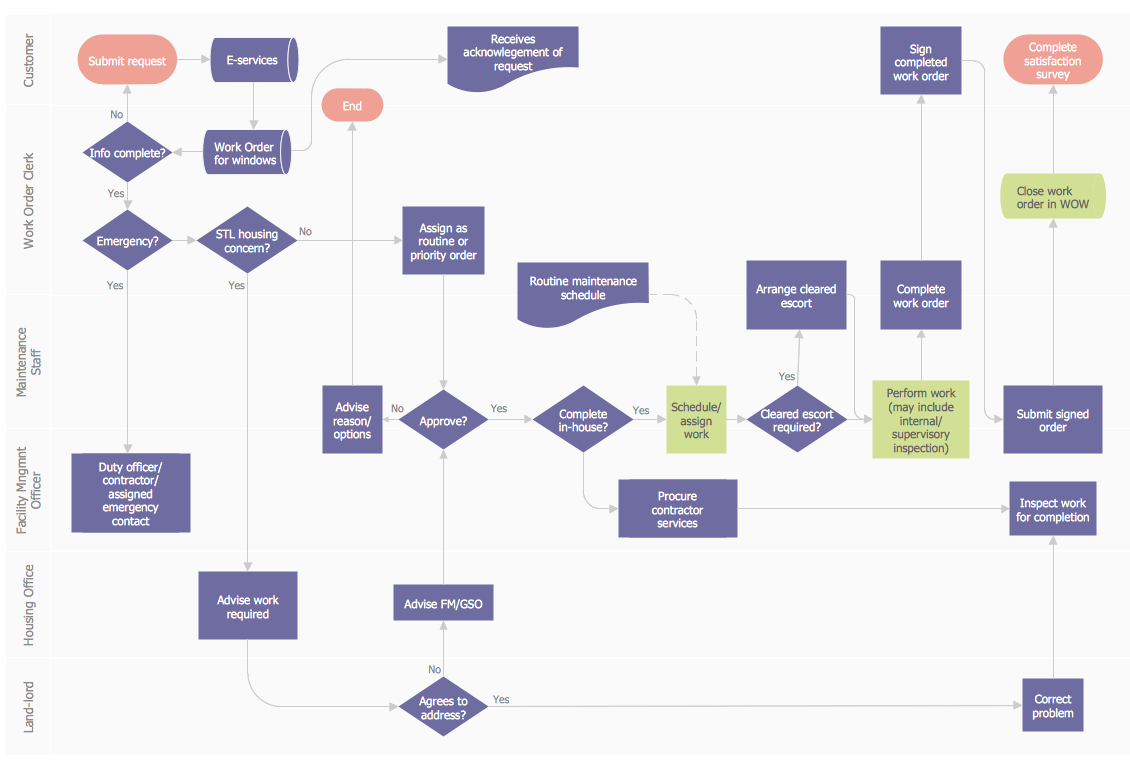


ConceptDraw DIAGRAM diagramming and vector drawing software provides the unique Flowcharts Solution from the Diagrams Area of ConceptDraw Solution Park with variety of vector objects libraries and collection of examples Flowchart. Each example flowchart included in Flowcharts solution is a real help in drawing process, it can be the good base or perfect source of inspiration.