Skype - eLearning Learning
Skype Training
ConceptDraw MINDMAP provides effective learning process with eLearning for Skype solution available to deliver lessons to a remote group via a Skype conference call.
Use mind map presentation for leading or taking instruction during elearning and allowing users to simplify training process for small groups.
eLearning solution as a communication and instructional tool allows trainers to meet with students online and run training sessions.

Sample 1. Solar System mind map
for ConceptDraw eLearning for Skype solution
This mind map was created in ConceptDraw MINDMAP An experienced user can build a map similar to the sample provided in 30 minutes or less.
Here is a visual presentation of the Solar System's structure.
Highly visual documents of this type can be presented to others using ConceptDraw MINDMAP in conjunction with the eLearning for Skype solution.
See also Samples:
SIX RELATED HOW TO's:
MindMap presentation via Skype - Control over the slide-show process which plays on each computer of Skype conference call participants synchronously.
Picture: What is MindMap presentation via Skype?
Related Solutions:
The ConceptDraw DIAGRAM Planogram Software and Retail Plan Software offers powerful tools of Enterprise Architecture Diagrams Solution for visualization the market analysis and easy making successful Retail Plans and Planograms with useful detailed recommendations about placing products and optimization the shelf space.
Picture: Planogram Software and Retail Plan Software
Related Solution:
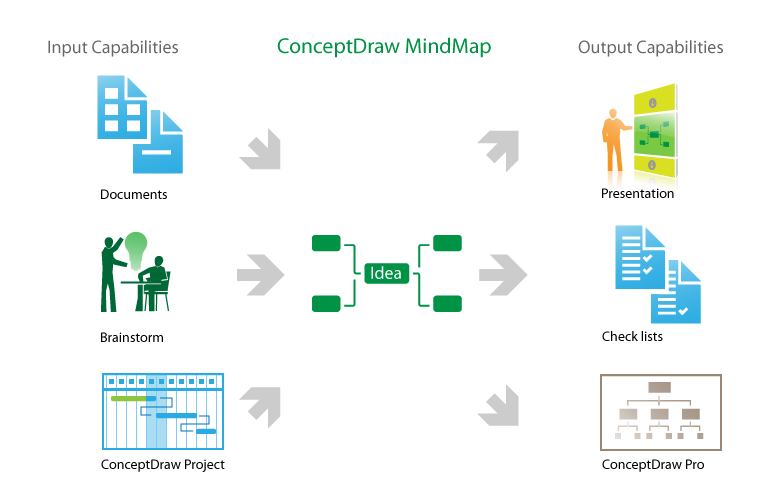
ConceptDraw MINDMAP with the ability to import presentations from Microsoft PowerPoint, as well as enhancing its existing presentation capabilities.
Picture: Best Mind Mapping Program for Making Presentations
Related Solution:
The Sales Process is a complex approach for selling a product or service which assumes many steps including the sales planning, realization of the sales marketing and management strategies, sales process analysis, etc. Now we have a ConceptDraw DIAGRAM software extended with unique Sales Flowcharts solution from the Marketing area of ConceptDraw Solution Park which ideally suits for the planning and realization the company's sales process.
Picture: The Sales Process
Related Solution:
Software for flowchart diagrams can help you: represents an algorithm or process, illustrates a solution to a given problem, represented process operations, analyzing a business process, designing a business process, documenting a business process, optimizing a business process.
The Flowcharts Solution from the Diagrams area of ConceptDraw Solution Park contains a wide set of predesigned templates, samples and 3 libraries.
Picture: Software for flowchart diagrams
Related Solution:
Sharing Documents Trough Skype: Share files, manage projects, inspire ideas, connect people.
Picture: How to Use Skype for Sharing Documents
Related Solution:


