Soccer (Football) Diagram Software
Soccer (Football) Diagram Software
The soccer (football) is the most popular sport in the world. Two teams of eleven players play with a spherical ball according to the defined rules. The team that scores the most goals wins the match.
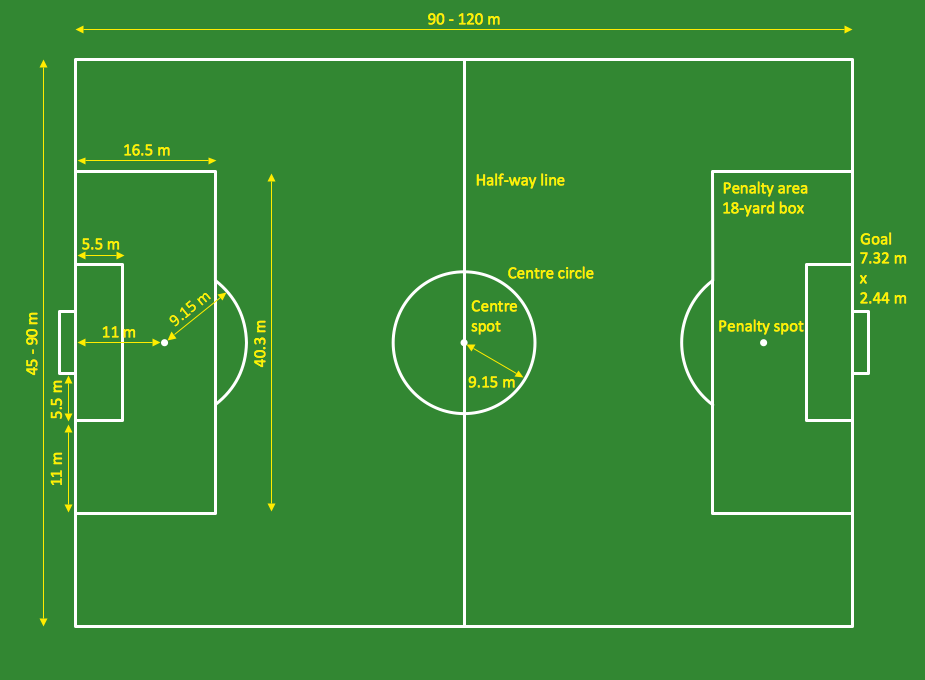
Explaining the soccer strategies and techniques is practically impossible without drawing a diagram. ConceptDraw DIAGRAM diagramming and vector drawing software extended with Soccer solution from the Sport area of ConceptDraw Solution Park is a very convenient and useful tool for designing the soccer-related diagrams.

Pic 1. Soccer (Football) Diagram Software
Soccer (Football) Diagram Elements
Soccer solution from the Sport area of ConceptDraw Solution Park provides 6 libraries with 115 ready-to-use predesigned vector objects to help you design the soccer diagrams quick, easy and effective:
- FIFA World Cup 2014 team flags
- Soccer (Football) fields
- Soccer (Football) positions
- Soccer pictograms
- Soccer silhouettes
- Football (Soccer)

Pic 2. Soccer (Football) Diagram Design Elements, Pictograms
Thanks to the Soccer solution you can design your own professional looking soccer diagram in seconds. All you need is:
- Simply drag and drop the football field from the "Soccer (Football) Fields" library;
- Drag the ready-to-use positions objects from the "Soccer (Football) Positions" library and place them on the field;
- Add vector clipart from the other libraries of the Soccer solution, arrows or text labels if needed.
Soccer (Football) Diagram Sample
The Soccer solution delivers also a wide collection of templates and samples with soccer-related diagrams. You can complete this set modifying any sample. All you need is to drag and drop objects to depict another play and then save with the different name. Feel free to add text label with the play name directly to your document.

Pic 3. Soccer (Football) Diagram Sample
This diagram was created in ConceptDraw DIAGRAM using the "Soccer (Football) fields" library from the Soccer solution and shows one of the soccer formations. An experienced user spent 5 minute creating this sample.
All source documents are vector graphic documents. They are available for reviewing, modifying, or converting to a variety of formats (PDF file, MS PowerPoint, MS Visio, and many other graphic formats) from the ConceptDraw STORE. The Ice Hockey Solution is available for all ConceptDraw DIAGRAM or later users.
TEN RELATED HOW TO's:
ConceptDraw DIAGRAM software extended with Sport Field Plans Solution from the Building Plans Area is a perfect software for drawing professional looking playground layout of any complexity.
Picture: Playground Layout
Related Solution:
The power, economy, and versatility of ConceptDraw MINDMAP takes personnel and team productivity to another level. Discover today what this means to you.
Picture: Mind Map Making Software
Related Solution:
When studying a business process or system involving the transfer of data, it is common to use a Data Flow Diagram (DFD) to visualize how data are processed. Being initially used exclusively in regards to the flow of data through a computer system, now DFDs are employed as the business modeling tools. They are applied to describe the business events and interactions, or physical systems involving data storage and transfer. ConceptDraw DIAGRAM is a powerful Data Flow Diagram software thanks to the Data Flow Diagrams solution from the Software Development area of ConceptDraw Solution Park.
Picture: Data Flow Diagram Software
Related Solution:
Thanks to Baseball solution all you need is just drag and drop ready-to-use positions objects to a template contains baseball field, and place positions on the field.
Picture: Baseball Diagram — Defence Positions
Related Solution:
While designing a conceptual data model, you should use appropriate software. For instance, ConceptDraw DIAGRAM is a user-friendly ER diagram tool that has a lot of samples and templates to facilitate your work. A clear entity-relationship diagram helps to define the relations between system’s components.
Software engineering is the section of a computer science engaged to design, realization, and support of complex software products. An ERD is a data modeling method that is widely applied in the software engineering practice. Commonly it is used for developing a structure of a a relational database. An entity relationship diagram is helpful for structuring and organizing databases that can be modeled using a relational structure. An entity relationship diagram is designed to depicts the interrelationships within the sets of entities which are accumulated in the database. Each entity represents a particular component of a data. Thus, ER diagrams depicts the logical structure of databases. ConceptDraw ER Diagrams solution provides software engineers with the professional tool for making entity-relationship diagrams.
Picture: Entity Relationship Diagram Software Engineering
Related Solution:
ConceptDraw DIAGRAM software extended with the Baseball solution delivers libraries, templates and samples allowing baseball fans or specialists to draw baseball-related schemas in minutes.
Picture: Colored Baseball Field Diagram
Related Solution:
Electronic components have two or more electrical terminals (or leads) aside from antennas which may only have one terminal. These leads connect to create an electronic circuit with a particular function (for example an amplifier, radio receiver, or oscillator). Basic electronic components may be packaged discretely, as arrays or networks of like components, or integrated inside of packages such as semiconductor integrated circuits, hybrid integrated circuits, or thick film devices.
26 libraries of the Electrical Engineering Solution of ConceptDraw DIAGRAM make your electrical diagramming simple, efficient, and effective. You can simply and quickly drop the ready-to-use objects from libraries into your document to create the electrical diagram.
Picture: Electrical Symbols — Composite Assemblies
Related Solution:
There are many ways to describe a database structure. One of the most usual is to draw an entity relationship diagram (ERD) using a Crow’s Foot notation to represent database elements. If you don’t want to draw it on paper, you should use an appropriate software.
An entity-relationship (ER) diagram is used to show the structure of a business database. ERD represents data as objects (entities) that are connected with standard relationships symbols which Illustrate an association between entities. ERD, there is a wide range of ERD notations used by data bases architects for reflecting the relationships between the data entities. According to the crow’s foot notation relationships are drawn as single labeled lines designating a certain kinds of relationship. Crow foot notation is a most frequently used ERD standard, because of improved readability of diagrams, with a more accurate use of space on the page._Win_Mac.png)
Picture: Entity Relationship Diagram - ERD - Software for Design Crows Foot ER Diagrams
Related Solution:
To maintain big and complex mechanical systems, you need an appropriate education and tools. It’s needless to say that mechanical drawing is important part of any industrial project. There are a lot of standard symbols depicting valves, pumps, motors, etc.
This drawing illustrates the content of the Fluid Power Equipment library provided by the ConceptDraw Mechanical Engineering solution. The solution is composed from the 8 libraries, containing about 500 elements related to mechanical engineering visualization. it will be helpful for drawing various schemes, charts and blueprints of pneumatic, and hydraulic equipment or other drawing related mechanical engineering. All drawings can be freely resized without loss of quality due to the vector graphics components of its facilities.
Picture:
Mechanical Drawing Symbols F.A.Q.
How to Use Mechanical Engineering Design Software
Related Solution:


_Win_Mac.png)


