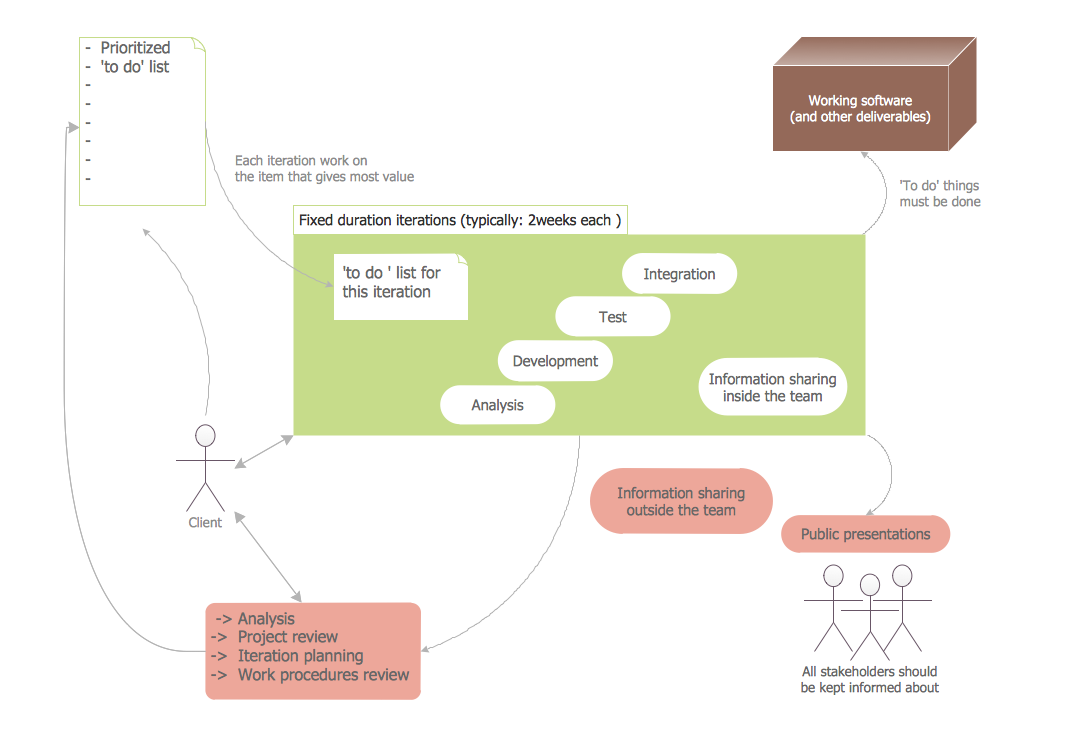
Example 2. Software Diagram Template
This software diagram template was also created in ConceptDraw DIAGRAM using the predesigned objects from the libraries of Software Development area. An experienced user spent 10 minutes creating this template for you.
Use templates from the solutions of Software Development area for ConceptDraw DIAGRAM to create your own professional looking Software Diagrams in minutes.
The Software Diagrams designed with ConceptDraw DIAGRAM are vector graphic documents and are available for reviewing, modifying, converting to a variety of formats (image, HTML, PDF file, MS PowerPoint Presentation, Adobe Flash or MS Visio), printing and send via e-mail in one moment.
See also samples:
TEN RELATED HOW TO's:
Use ConceptDraw DIAGRAM business diagramming and business graphics software for general diagramming purposes, it inludes tousands colored professional flowchart symbols, examples and samples which saves time when you prepare documents, professional presentations or make an explanation of process flow diagram.
Picture: Flow Chart Design — How to Design a Good Flowchart
Related Solution:
It doesn’t matter what kind of business you have, a bar or a gym, there are common concepts for any of them. One of those concepts is accounting, and to facilitate the work with the figures, you can use accounting flowchart symbols and create a clear and representative scheme. You can create flowchart for auditing, tax accounting and even for planning your own budget.
A graphical tool for displaying successive processes is flowchart. This method is mostly suited to represent an accounting process. The sequence of steps in the accounting process usually consists of standard accounting procedures, that can be depicted by using a minimal number of symbols, applied for the basic flowcharting. The advanced opportunity to create professional Accounting Flow charts is provided by ConceptDraw Accounting Flowcharts solution. It includes contains a library of accounting flowchart symbols used when drawing the accounting process flow.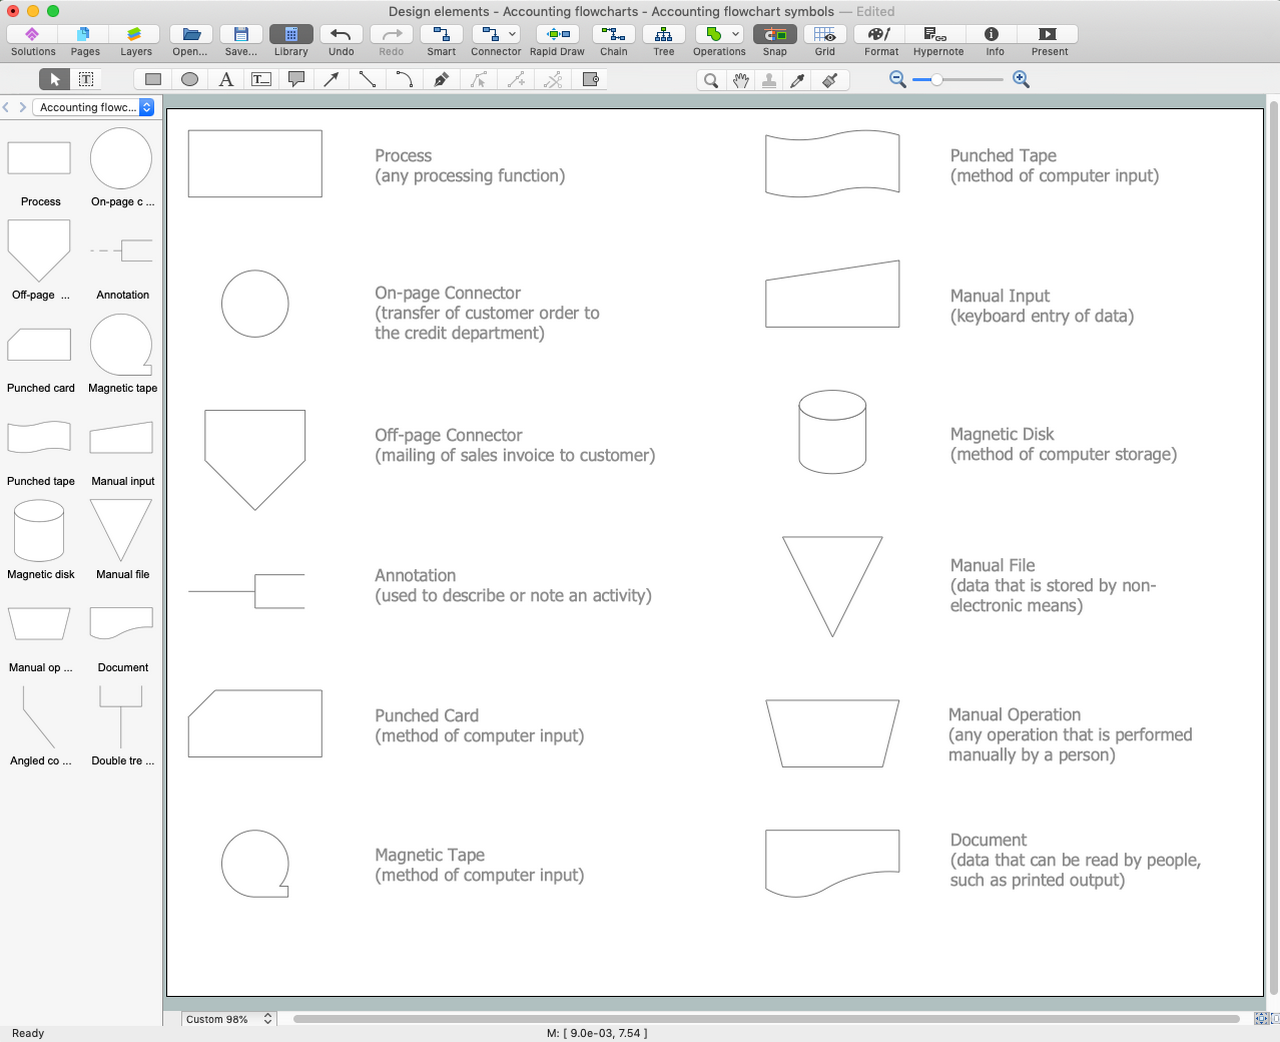
Picture: Accounting Flowchart Symbols
Related Solution:
All these bar chart templates are included in the Bar Graphs solution.
You can quickly rework these bar graph templates into your own charts by simply changing displayed data, title and legend texts.
Picture: Bar Chart Template for Word
Related Solution:
The Sales Process is a complex approach for selling a product or service which assumes many steps including the sales planning, realization of the sales marketing and management strategies, sales process analysis, etc. Now we have a ConceptDraw DIAGRAM software extended with unique Sales Flowcharts solution from the Marketing area of ConceptDraw Solution Park which ideally suits for the planning and realization the company's sales process.
Picture: The Sales Process
Related Solution:
When studying computer science, it is important to have good training manuals. To understand how the networks and data links work, you will probably need a set of network diagram examples depicting all the possible interconnections between network devices. You can find them on Internet or try to create your own.
This example of a network topology diagram was made using ConceptDraw Computer and Network Diagrams solution. It represents a bus topology network diagram. A bus topology means that computers and peripherals in the network are connected to a mutual cable (backbone). This topology is often used for small networks. This diagram was designed using vector libraries of network equipment symbols. They also can be applied while creating various LAN and WAN diagrams.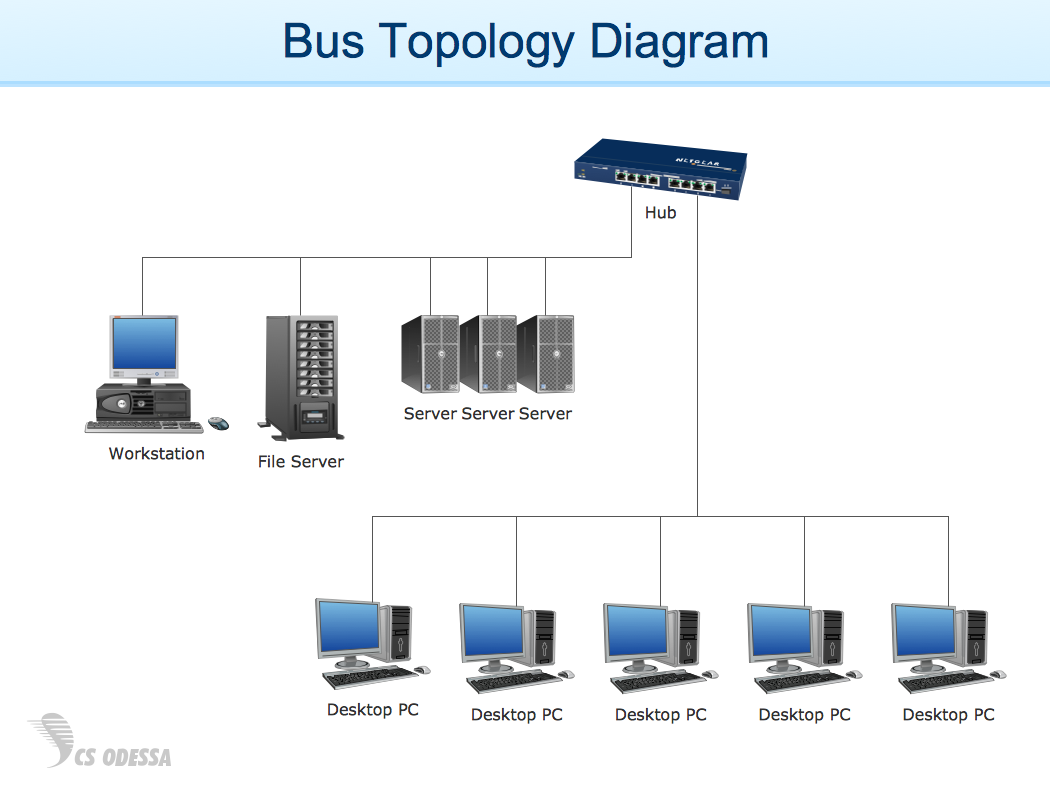
Picture: Network Diagram Examples
Local area network connects computers and other network appliances within an area, such as office building or a campus. It can be difficult to provide such network without a predesigned plan. For these purposes you can use network diagram software, which helps you to create LAN network diagrams and office network diagrams quickly and effortless. This will speed up your work and you can save the diagram for the future network improvements.
The following diagram illustrates a network topology of the small office. LAN configuration has a star topology. The local network joins 8 computers among which are several desktop PCs, laptop, two iMacs and iBook. The end-point devices are divided into three groups. Each group is connected to its hub. There is a network printer and a modem, which are interconnected with other devices through a network server. Each computer on the LAN can access the server through a corresponding hub.
Picture: Network Diagram Software. LAN Network Diagrams. Physical Office Network Diagrams
Related Solution:
The Accounting flowchart shows how information flows from source documents through the accounting records. The are based on the accounting procedures or processes.
Flowcharts are used to represent accounting information in a system. There are special symbols which are used to create accounting flowcharts. Try conceptdraw flowcharting set of symbols to draw a professional charts.
Picture: Why Flowchart Important to Accounting Information System?
Related Solution:
The ER diagram is constructed from the specific ERD graphic elements. There are used 2 types of ERD notations: Chen and Crow's Foot.
A complete set of work flow shapes, notation & symbols for ERD, entity relationship stencils, included in Entity-Relationship Diagram (ERD) solution for ConceptDraw DIAGRAM software, makes drawing diagrams based on ERD notation as smooth as possible.
Picture: Notation & Symbols for ERD
Related Solution:
Affinity Diagram Software - ConceptDraw DIAGRAM is a powerful diagramming and vector drawing software that allows quick, easy and effective create the Affinity Diagrams.
Seven Management and Planning Tools solution from the Business Productivity area of ConceptDraw Solution Park provides templates, samples and ready-to-use vector stencils that will help you design the professional looking Affinity Diagrams in a few moments.
Picture: Affinity Diagram Software
Related Solution:
When you need a drawing software to create a professional looking cross-functional charts, ConceptDraw with its Arrows10 Technology - is more than enough versatility to draw any type of diagram with any degree of complexity.
Use templates with process maps, diagrams, charts to get the drawing in minutes.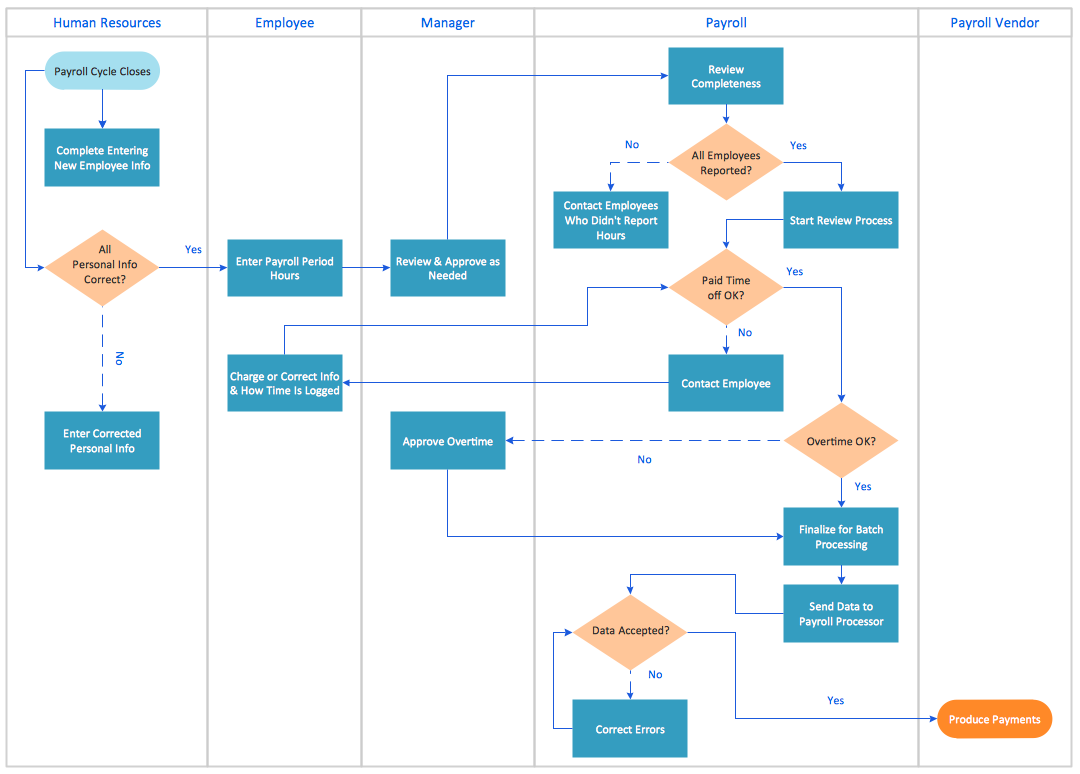
Picture: Cross-Functional Process Map Template

 Template")


