Structured Systems Analysis and Design Method. SSADM with ConceptDraw DIAGRAM
Structured Systems Analysis and Design Method (SSADM) is the method which is used at projecting and analysis of information systems. This method was developed for government of Great Britain in the beginning of 80th of the past century. It was accepted as the national standard of Great Britain for information systems development in 1993. Thus SSADM usage is expedient for those who work with governmental organizations as this method is a standard for these organizations.
SSADM is based on the data flow diagrams. At the early stages of projecting at description of models (functional, informational and event-trigger) the top-down method is used.
At the description of data flows out of the system and into the system DFD, which denote boundaries of the system, are used.
At the description of data models LDS (Logical Data Structure) diagrams are used. LDS describes which data the system operates with. It is created for existing system and is added at the development of the new one.
For modelling events, happened in the system, ELN (Entity Life History) diagrams are used. These diagrams support states indications and the possibility of description not only consecutive but parallel or reiterative events and also description of the choice of events course.
ELN describes how data change in the system in the course of time at different variants of events.
Thus, the most important SSADM elements are flows modelling with the help of DFD, data logic modelling with the help of LDS and description of entities behavior.

Analysis, projecting and documenting of information system accordingly to SSADM involves 6 main stages.
Each stage is divided into several steps, which define tasks that should be fulfilled at the given stage. The system is studied for getting system requirements. Detailed project is created on the logic level and then transformed into physical project.
SSADM stages:
- Analysis of the existing system or estimation of practicability. It involves the analysis of the existing system and creation of DFD for visualization of known problems and system description. If the system is developed from the beginning than the projecting starts from definition of new system requirements.
- Requirements definition. On the basis of available data about the system new functions, which the system must execute are defined. Also boundaries of the future system and data which will be processed by the system are defined. Infological model of requirements is constructed.
- Definition of technical requirements and device equipment cost. Definition of the expected profit with the introduction of new functions.
- Development of logical data model. Specification of the list of functional requirements. After development of the logical project the adding of new requirements on SSADM is forbidden. Only correction of the existing requirements, their specification and concrete definition are allowed.
- Projecting of logical requirements. Specification of requirements.
- Physical projecting. Physical information model and specification to program elements are developed and optimized. Specifications to program elements are specified and documentation is drawn up.
The advantages of SSADM are the precise definition and support of so-called “non functional requirements”. Such requirements define the level of the quality with which the system must execute its functions. For example, access limitations, the mean time of lifelength to denial, time of the response, safety requirements, etc.
In comparison with other methods of information system projecting, particularly with E. Yordon and A. Young methods, SSADM is characterized with presence of clear consecution of steps at projecting.
-solution.png "Structured Systems Analysis and Design Method solution")

Pic.1. Structured Systems Analysis and Design Method solution
The following features make ConceptDraw DIAGRAM the best Data Flow Diagram software:
- You don't need to be an artist to draw professional looking diagrams in a few minutes.
- Large quantity of ready-to-use vector objects makes your drawing diagrams quick and easy.
- Great number of predesigned templates and samples give you the good start for your own diagrams.
- ConceptDraw DIAGRAM provides you the possibility to use the grid, rules and guides. You can easily rotate, group, align, arrange the objects, use different fonts and colors to make your diagram exceptionally looking.
- All ConceptDraw DIAGRAM documents are vector graphic files and are available for reviewing, modifying, and converting to a variety of formats: image, HTML, PDF file, MS PowerPoint Presentation, Adobe Flash, MS Visio.
- Using ConceptDraw STORE you can navigate through ConceptDraw Solution Park, managing downloads and updates. You can access libraries, templates and samples directly from the ConceptDraw STORE.
- If you have any questions, our free of charge support is always ready to come to your aid.
TEN RELATED HOW TO's:
ConceptDraw DIAGRAM is a professional software for building of great-looking Flowcharts ✔️ of various types and any degree of complexity, ✔️ in a few simple steps, ✔️ even if you have no experience, ✔️ using RapidDraw technology, ✔️ to perform different tasks in different fields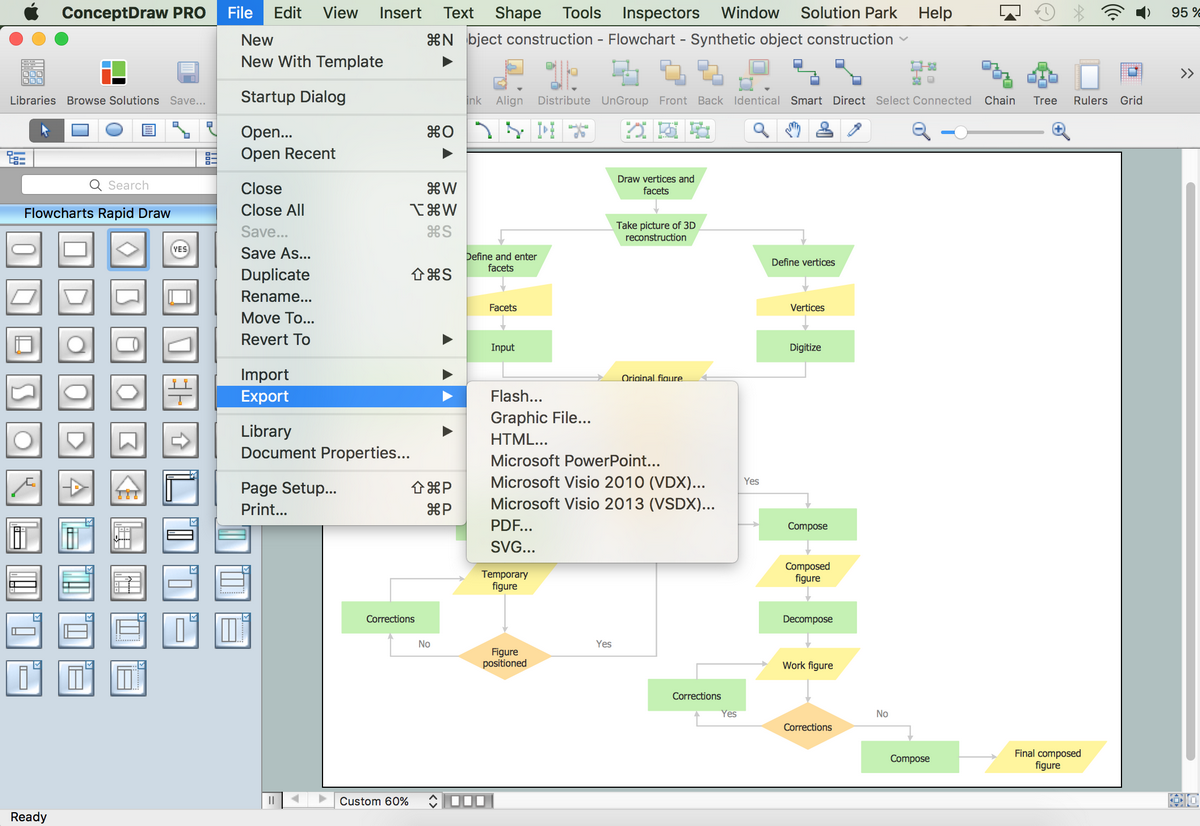
Picture: How to Build a Flowchart
Related Solution:
You need to draw the Circular Arrows Diagram, Segmented Diagram or Circular Flow Diagram? Any of these diagrams can be fast and easy designed in ConceptDraw DIAGRAM software, which offers the Business Diagrams Solution from the Management Area with extensive drawing tools, predesigned samples and circular flow diagram template. The use of ready template is the easiest way of drawing.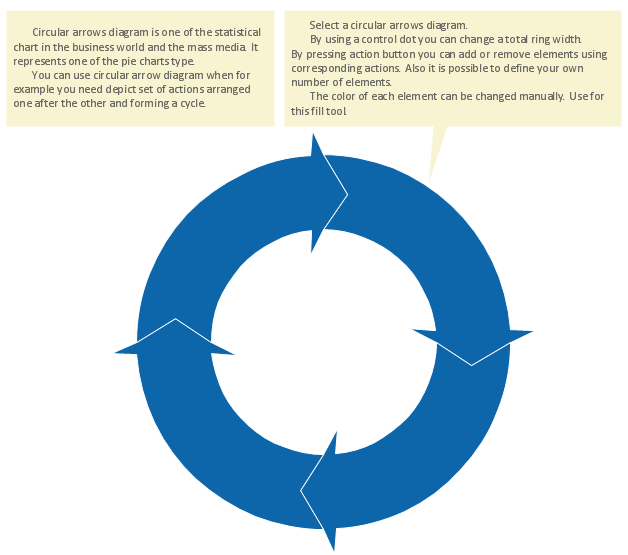
Picture: Circular Flow Diagram Template
Related Solution:
Cisco switches and hubs deliver the best performance, and often used as network solutions for small businesses, enterprises, data centers. Cisco switches are the core interconnect devices of each computer network. The numerous Cisco switches specifically designed for various applications. Network switches are separated for two types: fixed configuration and modular switches. The fixed configuration switches deprecate swapping or adding another module, and vice versa for modular switch.
Picture: Cisco Switches and Hubs. Cisco icons, shapes, stencils and symbols
Related Solution:
Sometimes it's difficult to find a path in work processes or to understand the requirements, especially when you are a newcomer. To get your thoughts straight, create a workflow diagram, and put everything on it. This will not only help you to get into the workflow, but also show it’s weaknesses.
This illustration captures the workflow process of payment an invoice for the electricity consumed by certain enterprise. It was drawn in ConceptDraw DIAGRAM using its solution for Workflow Diagrams. Making a workflow charts means that you need to depict consistently all processes engaged to the workflow process. Then, you should connect them with symbols meaning study and analysis. Next, add symbols of decisions. A work flow diagram made precisely and correctly can help to clarify your work flow to any person.
Picture: Workflow Diagram
Related Solution:
UML Component Diagrams are used to illustrate the structure of arbitrarily complex systems and illustrates the service consumer - service provider relationship between components.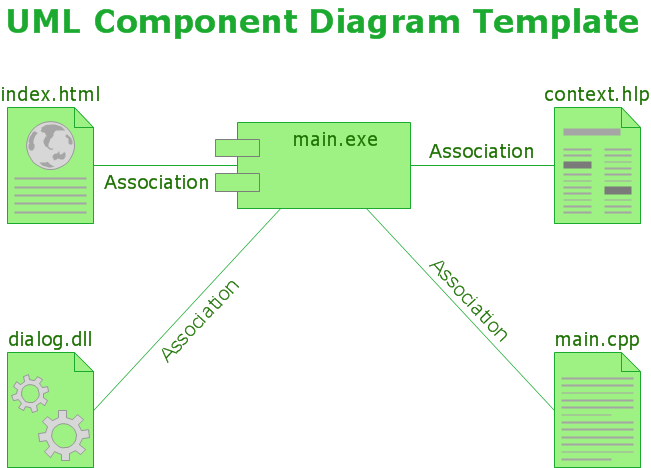
Picture: UML Component Diagram
Computer networks nowadays are spread all across the world. The large number of parameters, such as geographic scale or communication protocols, can divide networks. One of the most common types of networks is called local area network (LAN). It convenient to represent network examples by means of diagrams.
This local area network (LAN) diagram provides an easy way to see the way the devices in a local network are interacted. The diagram uses a library containing specific symbols to represent network equipment , media and the end-user devices such as computers (PC, mac, laptop) , network printer, hubs, server and finally a modem. There are two types of network topologies: physical and logical. The current diagram represents precisely a physical type of LAN topology because it refers to the physical layout of a local network equipment.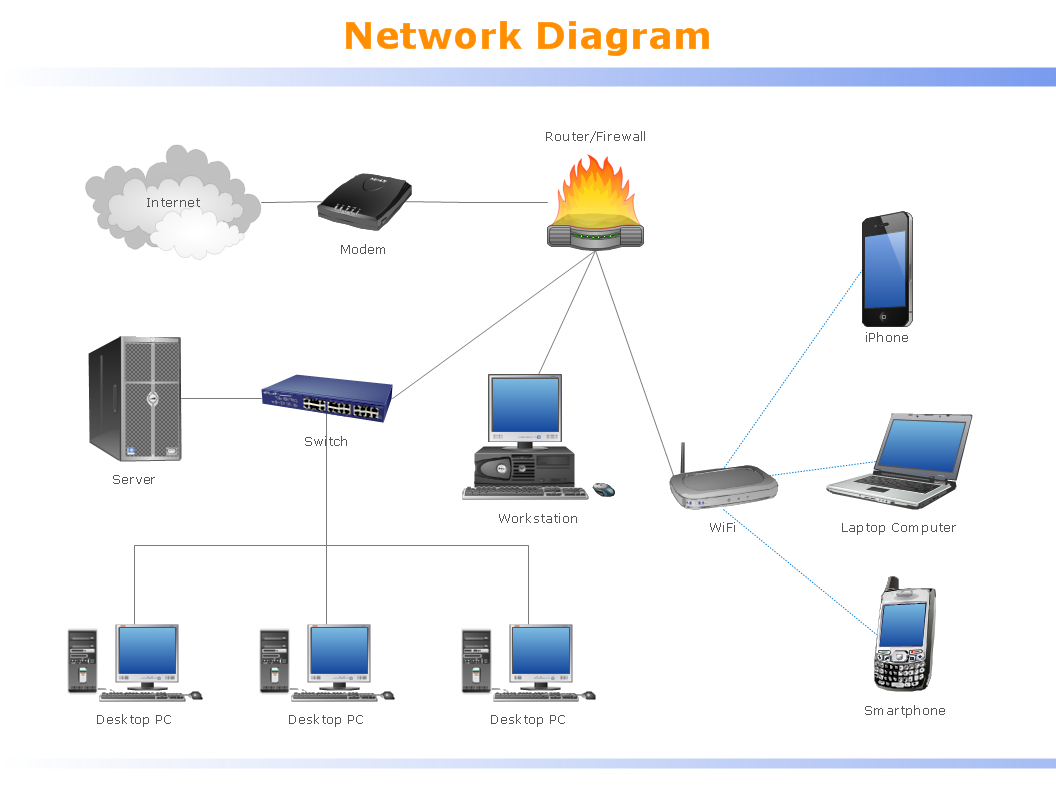
Picture:
What is a Local Area Network?
Examples of LAN Diagrams
Related Solution:
You want to connecting objects manually?
You don't know how should diagramming software work?
Is it possible to develop a diagram as quickly as the ideas come to you?
Yes. The innovative ConceptDraw Arrows10 Technology - This is more than enough versatility to draw any type of diagram with any degree of complexity.
You can start draw your diagram manually now.
Picture: ConceptDraw Arrows10 Technology
You can use many tools to create a representation of a system behavior or a scheme of objects relationships. Some of them are quite abstract and useless, and some, like UML tools help clarifying both the structure and the behavior of a system. There are various types of uml diagrams and tons of examples explaining the difference between them.
UML 2.2 specification has many kinds of diagrams. They are divided into two groups( structure and behavior diagrams). This class diagram shows the hierarchical structure of UML 2.2 specification. Class diagram - the most suitable tool for this task because it is designed to describe basic structure of a system. This diagram can be use as a visual aid for learning UML.
Picture: UML Tool & UML Diagram Examples
Related Solution:
ConceptDraw DIAGRAM diagramming and vector drawing software extended with Fishbone Diagrams solution is a perfect tool for software designers and software developers. If you need to create Cause and Effect diagram, Fishbone diagram, Ishikawa diagram from templates and examples, or using the predesigned elements, ConceptDraw DIAGRAM can do this easily.
ConceptDraw DIAGRAM software gives ability to design Fishbone diagrams that identify many possible causes for an effect for problem. Each Fishbone diagram design element included to Fishbone Diagrams library is vector and ready-to-use..png)
Picture: Fishbone Diagram Design Element
Related Solution:
Zooko's triangle is known to be a trilemma which is a concept in international economics which states that it is impossible to have a fixed foreign exchange rate, a free capital movement and an independent monetary policy at the same time.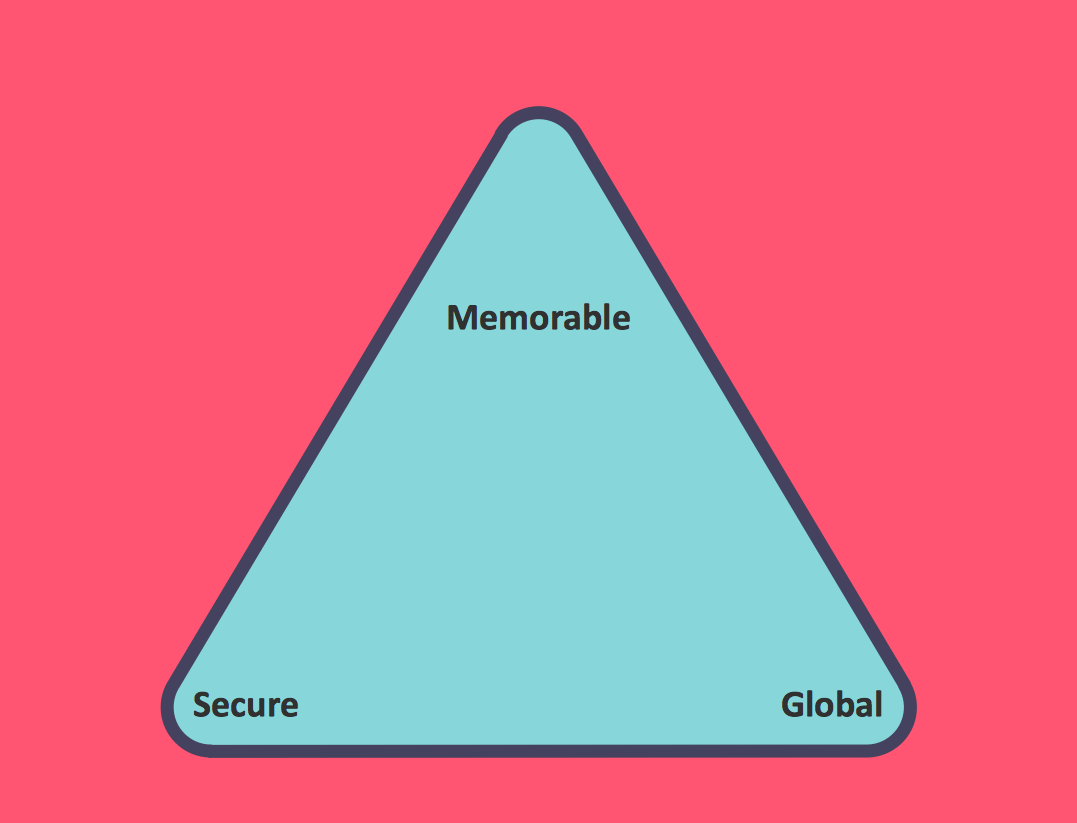
Picture: Pyramid Diagram
Related Solution: