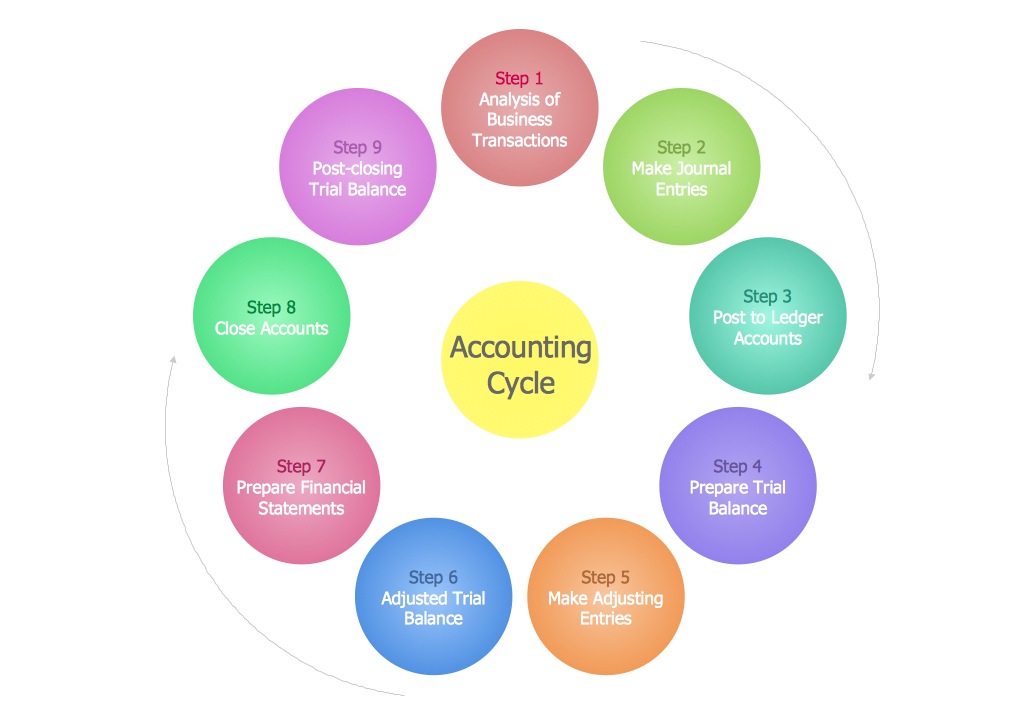
Sample 1. Steps in the Accounting Process
This diagram was created in ConceptDraw DIAGRAM and illustrates the steps in the accounting process.
ConceptDraw DIAGRAM extended with Accounting Flowcharts Solution will help you facilitate your accounting process. Accounting Flowcharts Solution contains the useful and convenient tools for easily drawing the Accounting Flowcharts.
Designing the accounting flowcharts with complex steps in the accounting process, you can use the useful technique – replace some details in a separate flowchart.

Sample 2. Accounting Flowchart – Procurement Process Mapping
This sample was created in ConceptDraw DIAGRAM using the Accounting Flowcharts library from the Accounting Flowcharts Solution and shows the accounting flowchart of the procurement process mapping. An experienced user spent 10 minutes creating this sample.
Use the ConceptDraw DIAGRAM with Accounting Flowcharts Solution to show the steps in the accounting process, the steps of accounting cycle and to create your own professional looking Accounting Flowcharts of any complexity quick and easy.
The Accounting Flowcharts produced with ConceptDraw DIAGRAM are vector graphic documents and are available for reviewing, modifying, and converting to a variety of formats (image, HTML, PDF file, MS PowerPoint Presentation, Adobe Flash or MS Visio).
TEN RELATED HOW TO's:
The audit process is a definite set of steps used in a financial, operational or compliance audit. This set of steps depends of the audit services company. The auditing process usually includes three main steps: planning, fieldwork and reporting.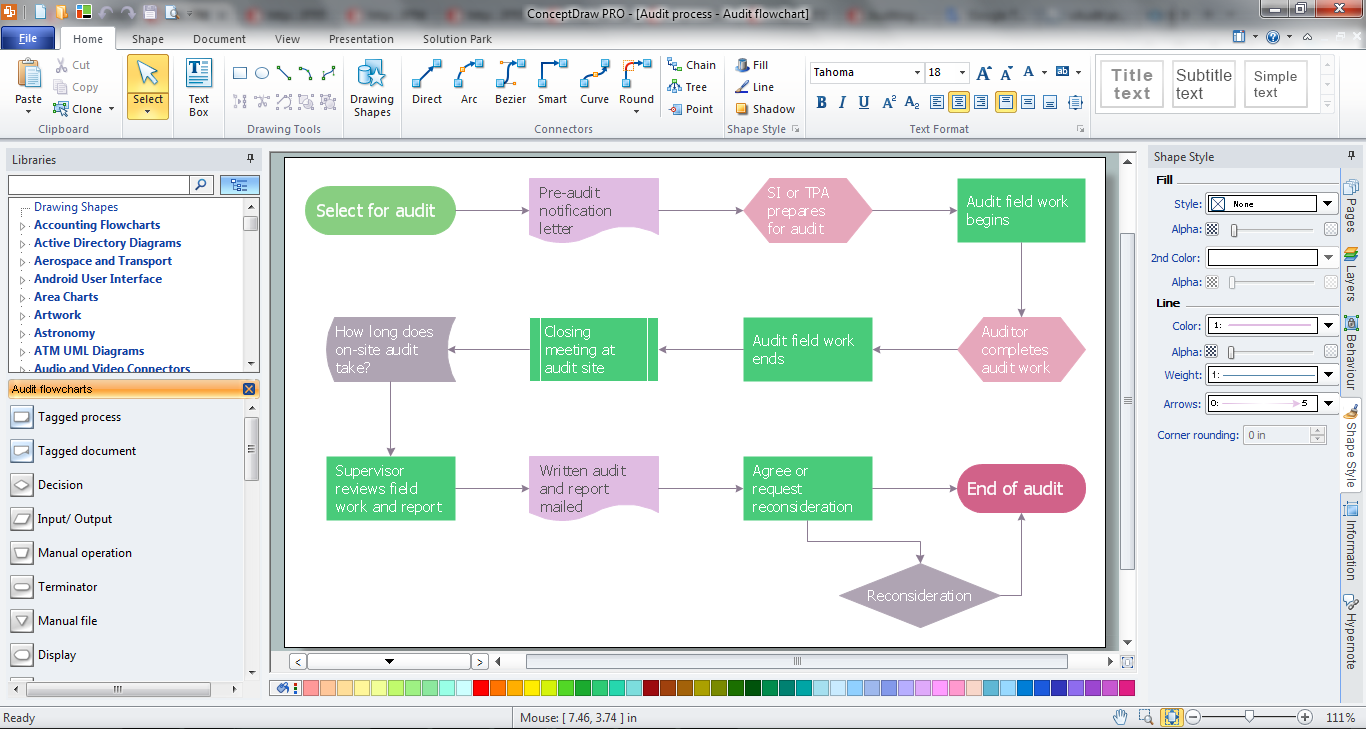
Picture: Audit Process
Related Solution:
ConceptDraw DIAGRAM extended with Interactive Voice Response Diagrams Solution from the Computer and Networks Area enables to make quick and effective drawing the IVR diagrams describing the IVR systems of any complexity quick and effective.
Picture: IVR Systems
Related Solution:
How to build segregation of duties using drawing tools from Accounting Flowcharts Solution for ConceptDraw DIAGRAM software.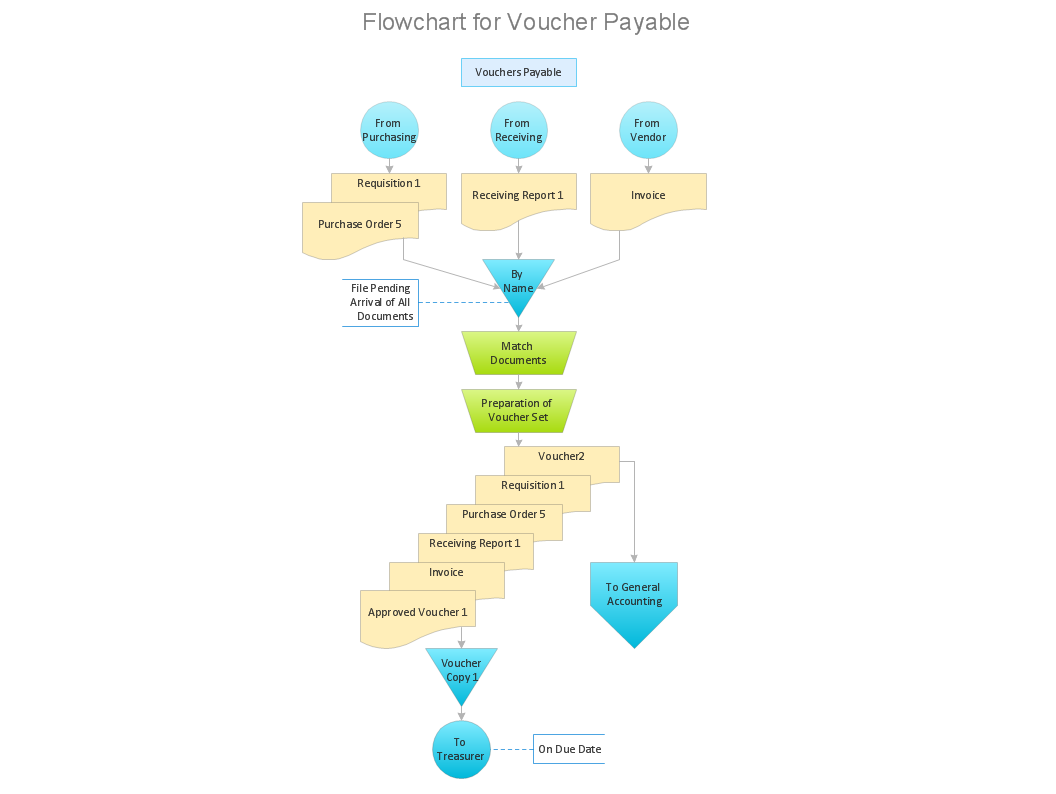
Picture: Approval Process and Segregation of ResponsibilitiesAccounting Flowchart Example
Related Solution:
Working with disordered network data can be quite exhausting. Sometimes it's necessary to find a network diagramming software to design Cisco network diagrams that would be easy to use and would be able to export diagrams to various graphic formats. ConceptDraw DIAGRAM is a great diagramming tool that is able to perform all these tasks easily.
This vector library represents a set of 26 objects depicting the manufacturer - standard equipment of Cisco switches and hubs. This is only a small part of the vector graphic objects of Cisco equipment that comprise the Cisco Network Diagrams solution. In full the ConceptDraw Cisco Network Diagrams solution has 15 libraries, containing more then 500 objects to create a Cisco network diagrams. They can be used by IT specialists and corporative IT divisions, system and network administrators to make the visual documentation of Cisco networks topology.
Picture: Network Diagramming Software for Design. Cisco Network Diagrams
Related Solution:
Use ConceptDraw DIAGRAM diagramming and business graphics software for drawing your own PM life cycle flow charts.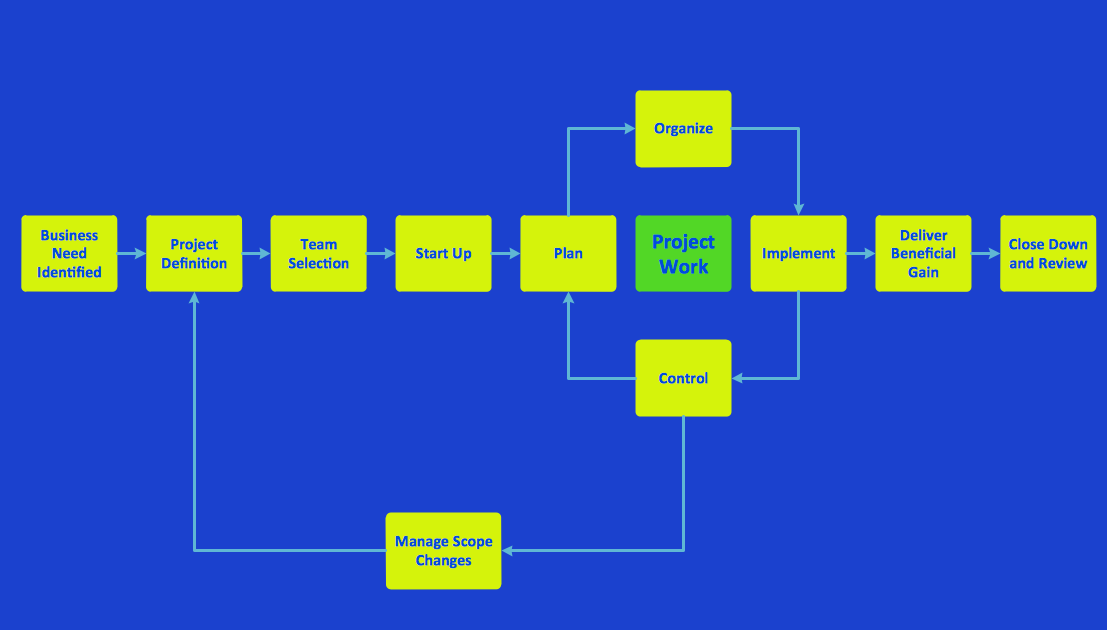
Picture: Program to Make Flow Chart
Related Solution:
ConceptDraw RapidDraw DIAGRAM helps create visually document and communicate Business Process (BPMN 2.0) information.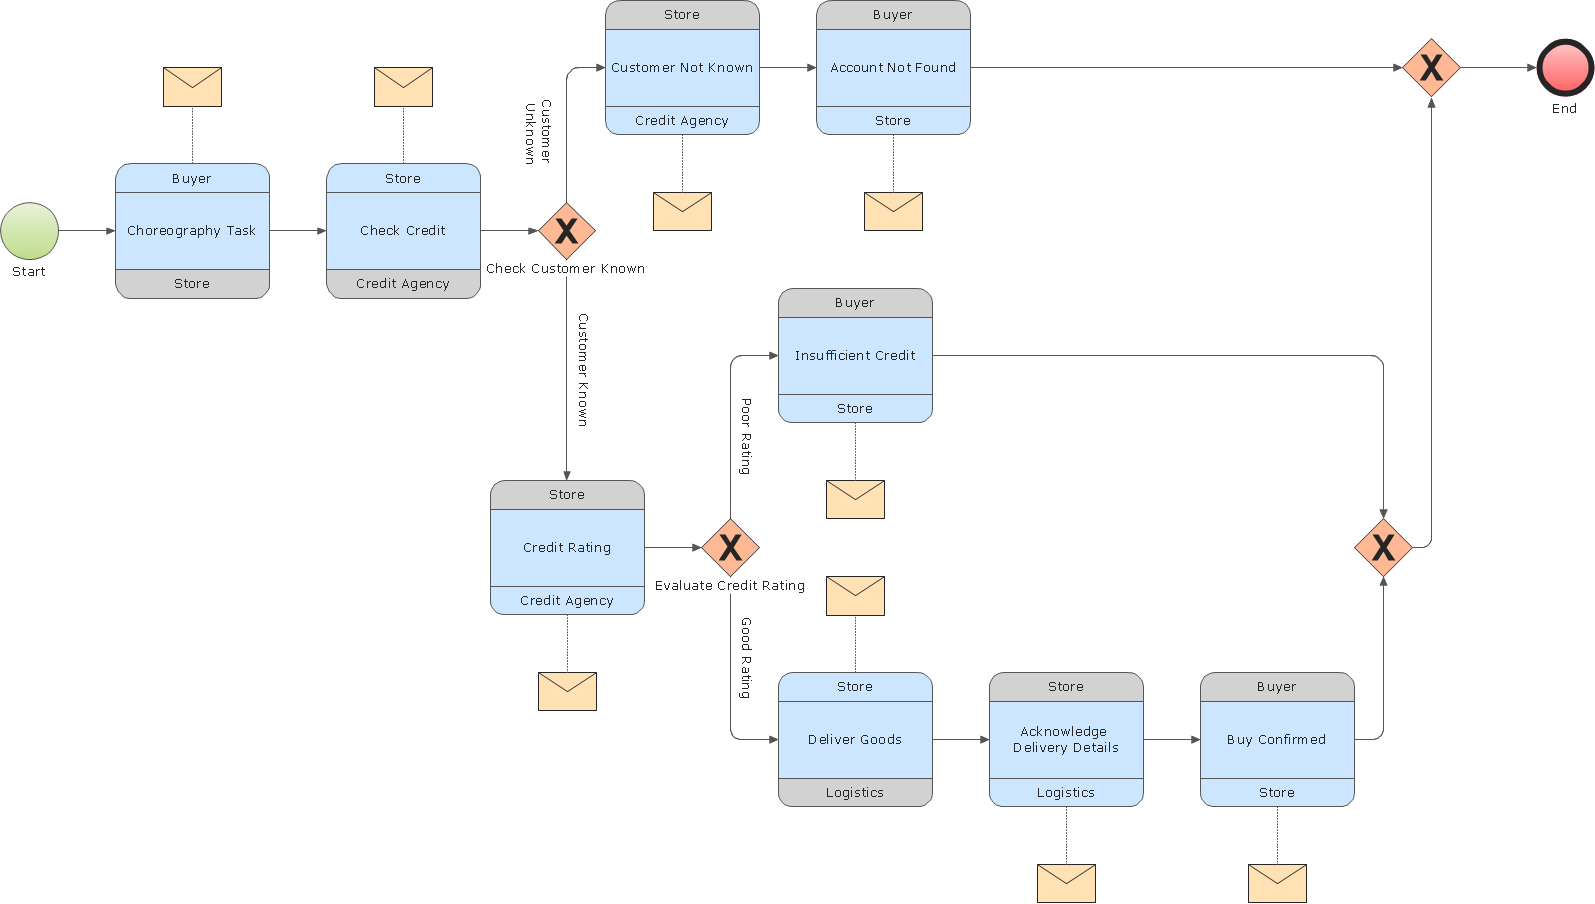
Picture: Business Process Modeling
If your company is in chaos in clutter and no one understands their rights and responsibilities, maybe it's time to change that. One of the ways to put the company in order is to draw an organization chart that would reflect the structure and show the relationships among departments and positions. This is a very useful and easy to understand scheme.
This is example of the one of the most typical kind of organizational chart. It depicts an organizational structure of the hierarchical type. Its construction is similarv to pyramid. The single main position on the top - in this case, the mayor's position followed by sub-levels of authority in his command. Each position in the pyramid reports only to his supervisor, and takes only a report of direct subordinates. Such scheme limits the number of communications. This organizational structure is effectively used in public organizations. Also it is suitable for any organization with the need for multiple levels of middle managers. The ability to create organizational charts of different types is supplied with ConceptDraw Ogrcharts solutions.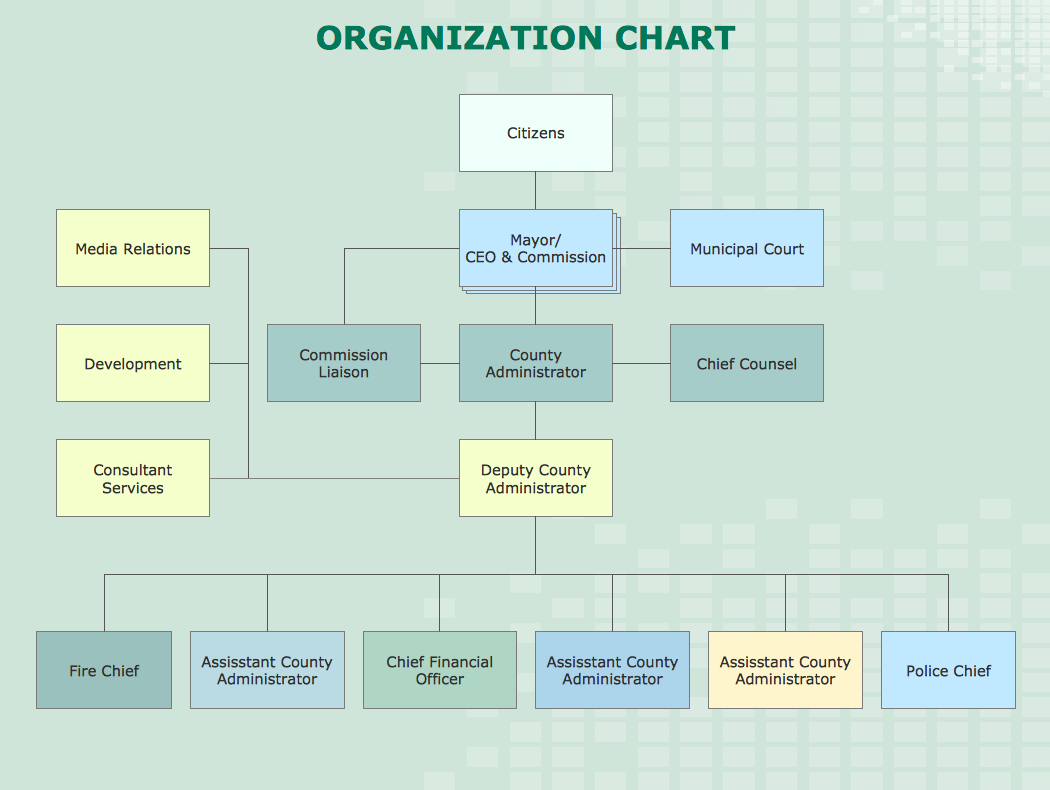
Picture: How to Draw an Organizational Chart
Related Solution:
Chart Audits, Chart Auditor - Designing the chart auditor can use the audit flowchart symbols from the Audit Flowcharts library for Audit Flowcharts Solution. Moreover it is convenient to use anyone of samples or templates offered by Audit Flowcharts Solution and design its own chart audits and audit flowcharts on the base of them.
Picture: Chart Audits. Chart Auditor
Related Solution:
This sample shows the Flowchart of the testing the work of the lamp and decision making about what to do to lamp will work.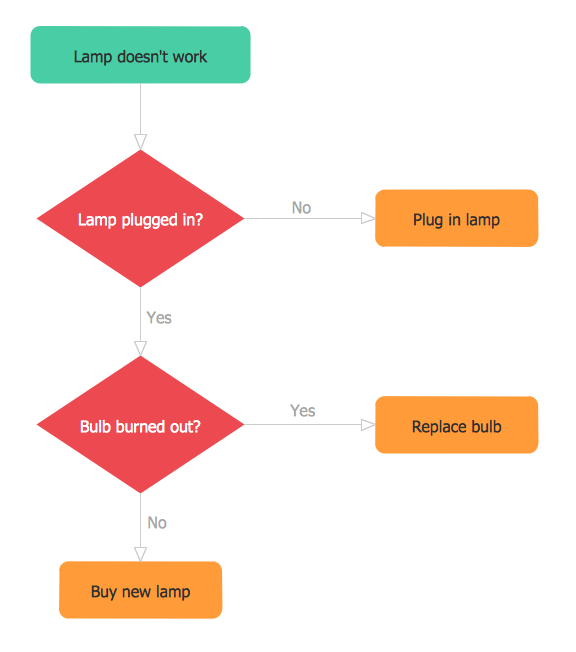
Picture: Samples of Flowchart
Related Solution:
This sample shows the Flowchart for determine is a species heterotroph or autotroph, or a subtype. This diagram has start point and end points. The diamonds on the Flowchart represent the decisions. The Flowcharts are widely used in science, analytics, government, politics, business, engineering, architecture, marketing, manufacturing, administration, etc.
Picture: Samples of Flowcharting
Related Solution: