Structure Chart Generator
A Structure chart is a modular design tool, which shows the breakdown of a system to several manageable levels. As a rule, it is developed in the form of a top-down hierarchical diagram, however, other representations are also acceptable. As a result, the Structure Chart represents the hierarchical structure of functional modules. Each module represents the process or task of the system. Therefore, the chart is also called a Module chart or Hierarchy chart and is similar in appearance to an Organizational chart. It describes functions and sub-functions of each system's module, reflects the size and complexity of the system, and serves as a visual decomposition of a problem into subproblems. The Structure chart is read from top to bottom and left to right.
Structure charts are widely used in different fields: software engineering, structured programming, software development, organizational theory, and many others. An Organization chart of a company is also a Structure chart. It helps to depict a complex company structure. The design of the Structure chart is a universal benefit for any company, but it is especially important for large companies. The Structure chart reflects the chain of command, the hierarchy of the business teams, leaders, managers, and other employees, the span of control, and the centralization of the company. You can oversee employees’ titles and relationships across teams or departments. Show how each role, team, or department fits into the overall picture.
Based on the Structure diagram, you can visualize how the workflows are organized and performed in a company. The Structure diagram is similar to a map reflecting the company's work, the distribution of roles and interactions of employees with each other. It is a real help for business leaders, especially as the company grows and gets bigger. It is also helpful for new employees to learn who manages what processes in the company, who reports to whom, and how decisions are made in the company. A clear understanding of their roles within a company, helps employees to perform their tasks efficiently, manage expectations and goals, and affects the company's success. Depending on the field, size of the business, its goals, and other parameters, the organizational structure of the company and its Structure chart vary.
Being applied in software development, the Structure chart helps to show the architecture of a computer program, arrange program modules into a tree, and show the relationships between modules and data passing. Usually, programmers break down a task on the subtasks that should be performed by the program to solve the problem. Next, these sub-tasks are broken again into smaller tasks, and so on to the smallest parts. The number of modules can differ, sometimes the problem should be broken down into very small components.
There are used different types of modules. Usually, a control module branches to several sub-modules. As a rule, the rectangles show the modules of the system and the lines connecting them show the relationships among the parts. A curved arrow represents a loop in the module that is a repetitive call of the module by the sub-module. One module calls another, passes the defined parameters, and receives results. A library module is reusable and called from any module. A conditional call usually represents the choice of the called sub-module based on the defined condition.
The different types of Structure diagrams exist, these are transform-centered structures, transaction-centered structures, company structure charts, governance charts, management charts, and many others.
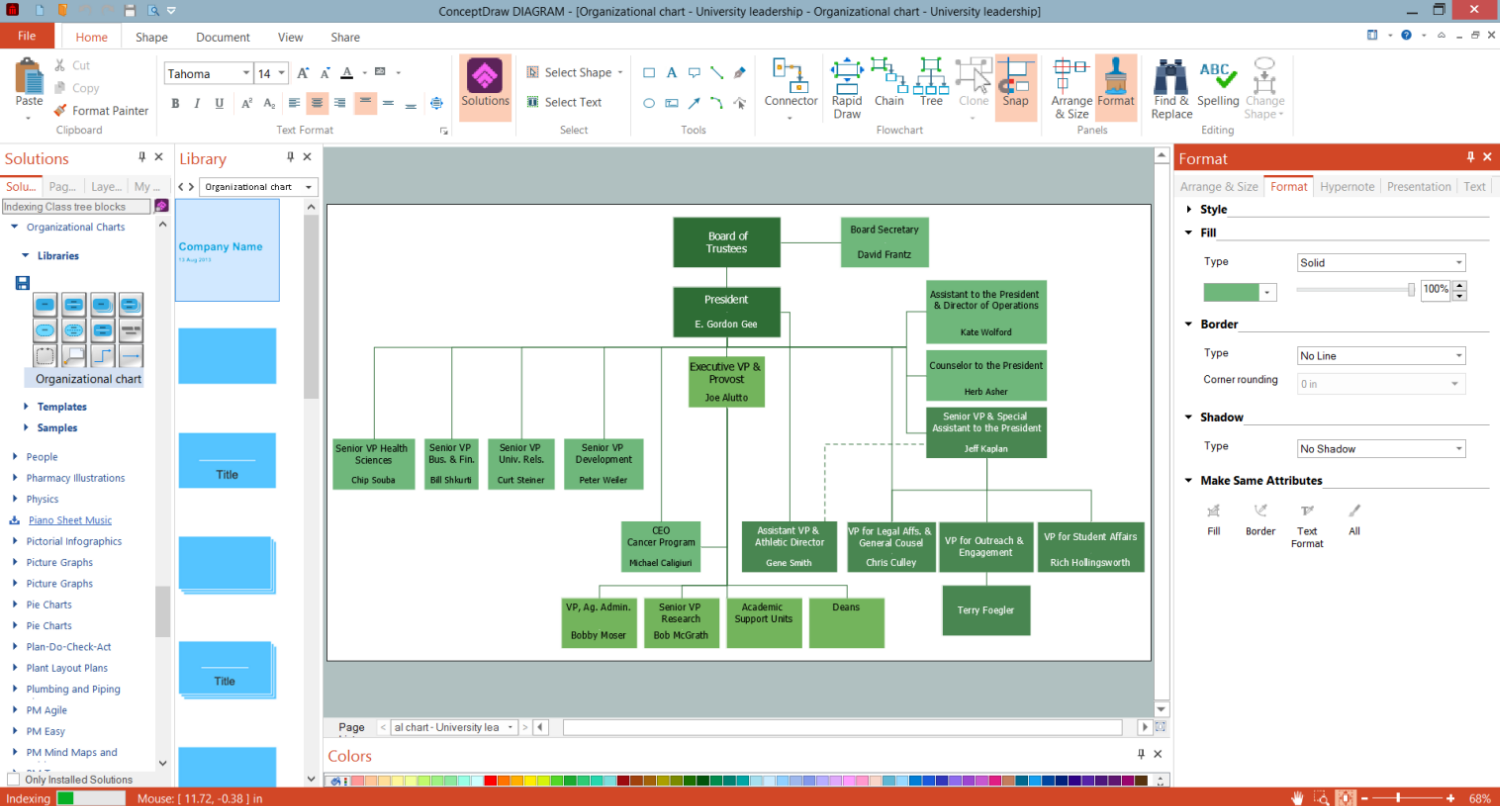
Example 1. Structure Chart Generator - ConceptDraw DIAGRAM
Construct your clear and especially-looking Structure chart, visually break down a problem into parts, or reflect the architecture of a projected computer program easily and quickly in structure chart generator ConceptDraw DIAGRAM. And don't forget to update your Structure chart if the current structure changes. Start inspired with predesigned samples included in ConceptDraw's Organisational Charts solution. Use any of them as a template to get started and simply edit it. Save time and effort with an intuitive application interface, powerful drawing tools, and a variety of pre-made graphics, design elements — organizational chart, and symbols from the solution library.

Example 2. Organizational Chart Library Design Elements
The following features make ConceptDraw DIAGRAM the best Structure Chart Generator:
- You don't need to be an artist to draw professional-looking diagrams in a few minutes.
- Large quantity of ready-to-use vector objects makes your drawing diagrams quick and easy.
- Great number of predesigned templates and samples give you the good start for your own diagrams.
- ConceptDraw DIAGRAM provides you the possibility to use the grid, rules and guides. You can easily rotate, group, align, arrange the objects, use different fonts and colors to make your diagram exceptionally looking.
- All ConceptDraw DIAGRAM documents are vector graphic files and are available for reviewing, modifying, and converting to a variety of formats: image, HTML, PDF file, MS PowerPoint Presentation, Adobe Flash, MS Visio.
- Using ConceptDraw STORE you can navigate through ConceptDraw Solution Park, managing downloads and updates. You can access libraries, templates and samples directly from the ConceptDraw STORE.
- If you have any questions, our free of charge support is always ready to come to your aid.