Swim Lane Diagrams
In each company business-processes are allotted among workers and departments. One the same process may be fulfilled by several workers simultaneously or by turns. In such cases it is quite difficult to define the reasons of delays, defects and narrow places during the process. The documenting of business-processes in the company is required. One of the tools for documenting of business-processes is the Swim Lane diagram.
Swim Lane diagrams are the variety of process flow diagrams and are based on the IDEF3 standard. They were developed by Lynn Shostack for usage in projecting. With their help organization diagrams are combined with process flow, as they visually display an object of the production system which is charged with given concrete processes in general flow of processes of the production system.
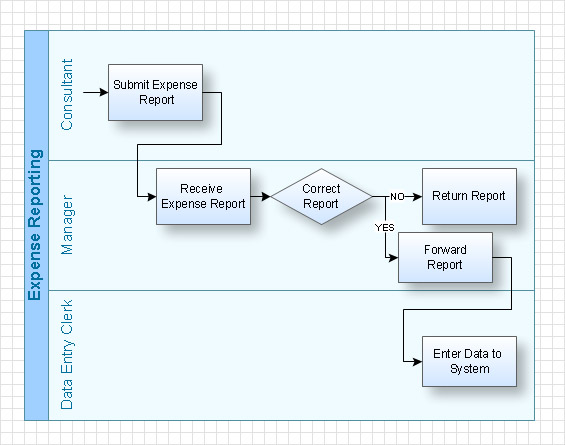
Swim Lane diagram was named this way because all blocks which denote compound parts of processes are located on the definite lanes accordingly to belonging to responsible worker. Thus the diagram resembles a swimming pool with lanes. Lanes may be located either horizontally or vertically, depending on the existing process flow diagram. These lanes are denoted accordingly to resource name, which is charged with execution of the given part of the process.

Pic 1. Swim Lane Diagram
As s result, working process is found divided into parts, with indication of the responsibility for fulfillment of the given part of the process. This significantly facilitates the comprehension of the working process in general and helps to discover weak points, reasons of delays and defects and people responsible for them.

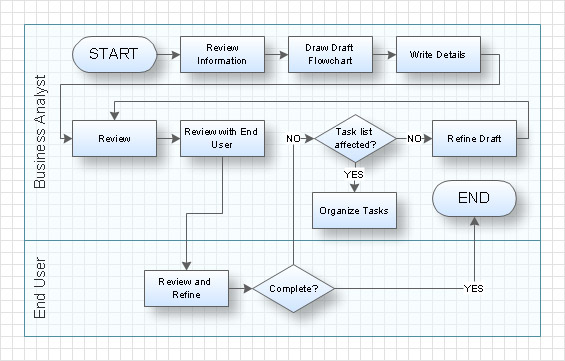
Pic 2. Swim Lane Diagram - Working Process
With the help of Swim Lane diagrams you can always represent working processes of any complication in a simple and visual graphic form and define participants of separate parts of the working process. Besides, Swim Lane diagrams is a simple way to show responsibility zones of personal and interaction points of separate participants of the working process.
Swim Lane diagrams are used in modelling of business processes BPMN and in UML methodology. Such diagrams are called Line of Visibility charts in IBM and Cross-Functional Flow Charts in MS Visio.
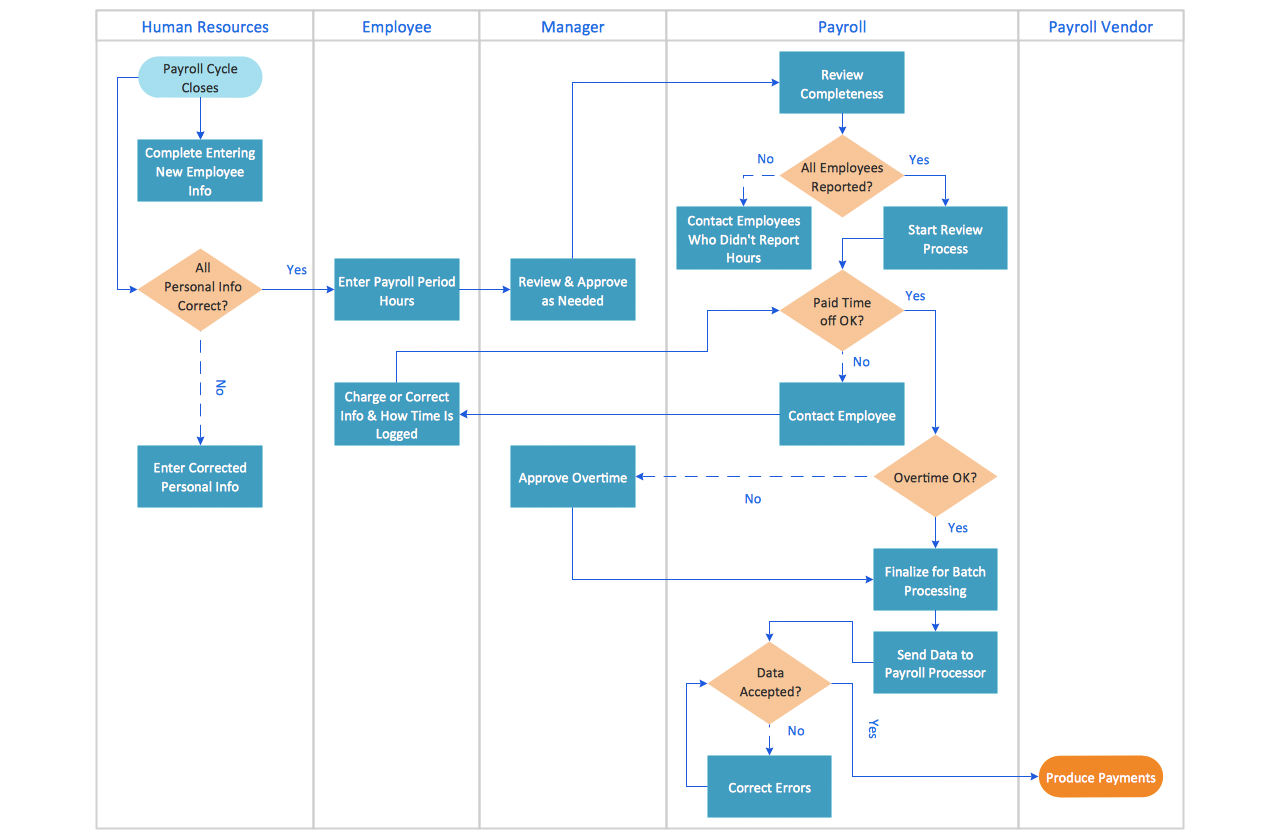
Pic 3. Swim Lane Diagram Example
How to Create a Swim Lane Diagram Using ConceptDraw DIAGRAM
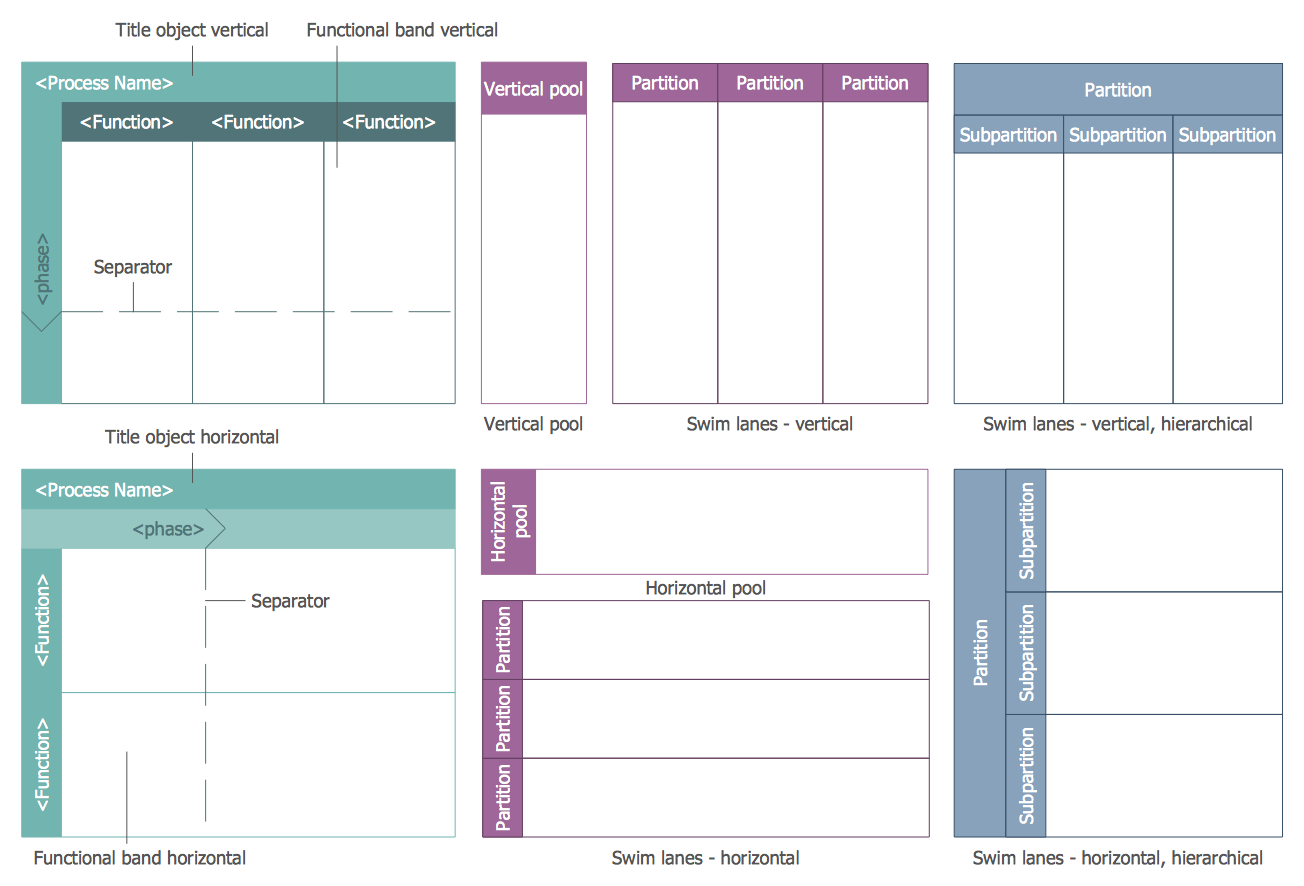
It's incredibly convenient to develop Swim Lanes Flowchart in ConceptDraw DIAGRAM using the predesigned vector objects offered by Swim Lanes library of Business Process Mapping Solution.
Drag the Swim Lanes Vertical object from the Swim Lanes library to the document’s page.
Next add text to the diagram and format the objects.
When releasing the mouse button, the object automatically resizes according to the page size. The Action button chain mode button mac allows you to easily add lanes and then equalize them.
Add the shapes to the diagram from the Cross-Functional Flowchart library. They appear on the flowchart as connected objects.
Result: A professional-looking flowchart, that demonstrates the document flow in your organization.
NINE RELATED HOW TO's:
Create bar charts for visualizing problem solving in manufacturing and economics using the ConceptDraw DIAGRAM diagramming and vector drawing software extended with the Bar Graphs Solution from the Graphs and Charts area of ConceptDraw Solition Park.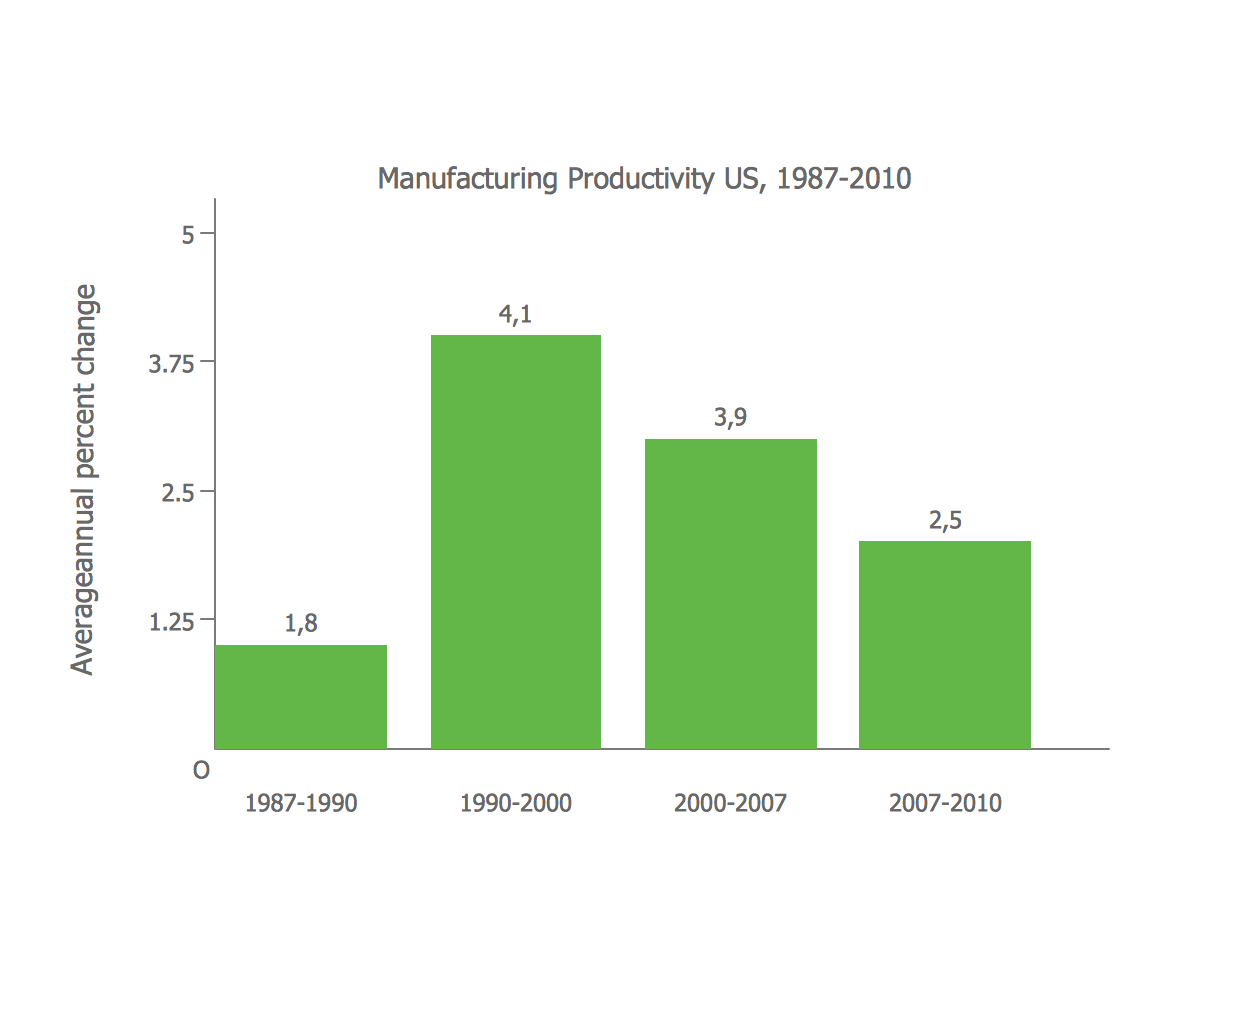
Picture: Bar Diagrams for Problem Solving. Create manufacturing and economics bar charts with Bar Graphs Solution
Related Solution:
These vector illustrations and cliparts are created for drawing the Project management Illustrations and contain plenty of project management design elements. The clipart library Project management includes 35 icons.
Picture: Project management - Design Elements
Related Solution:
Charting Software allows you to create diagrams, charts, graphs, flowcharts, and other business graphics. ConceptDraw DIAGRAM include simple shape drawing tools, examples, templates, and symbol libraries.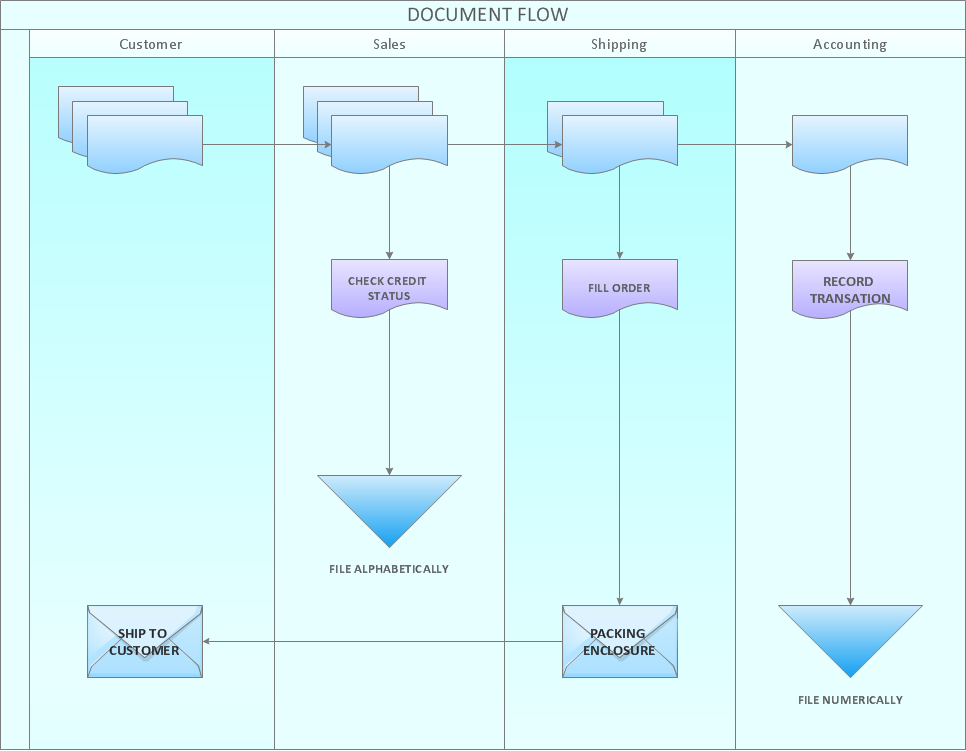
Picture: Create Graphs and Charts
Related Solution:
The entity–relationship (ER) model is a data model that lets graphically represent the information system and depict the relationships between people, objects, concepts, places, and events within a given system. It is also convenient to use the ER Diagram for Cloud computing representation and description the Cloud computing architecture, design them with pleasure using the extensive tools of the Cloud Computing Diagrams solution from the Computers and Network area of ConceptDraw Solution Park.
Picture: ER Diagram for Cloud Computing
Related Solution:
Diagramming is an astonishing way to visualize business processes. The list of the most common business process flowchart symbols is quite long starting from basic flowcharts, continuing with SIPOC diagrams. Business process modeling was never easier than now, with special ConceptDraw Business Process Mapping solution.
To carry out all professional standard requirements for business processes mapping, it is necessarily to follow the special graphical notations. ConceptDraw Business Process Mapping solution offers an exhaustive suite of tools to aid business process mapping. There are three vector libraries SIPOC Diagrams, Business Process Flowcharts, and Swim Lanes that contains totally more than 50 symbols of standard BPM notations. This is all that professionals need to effectively evaluate and manage quality in business processes.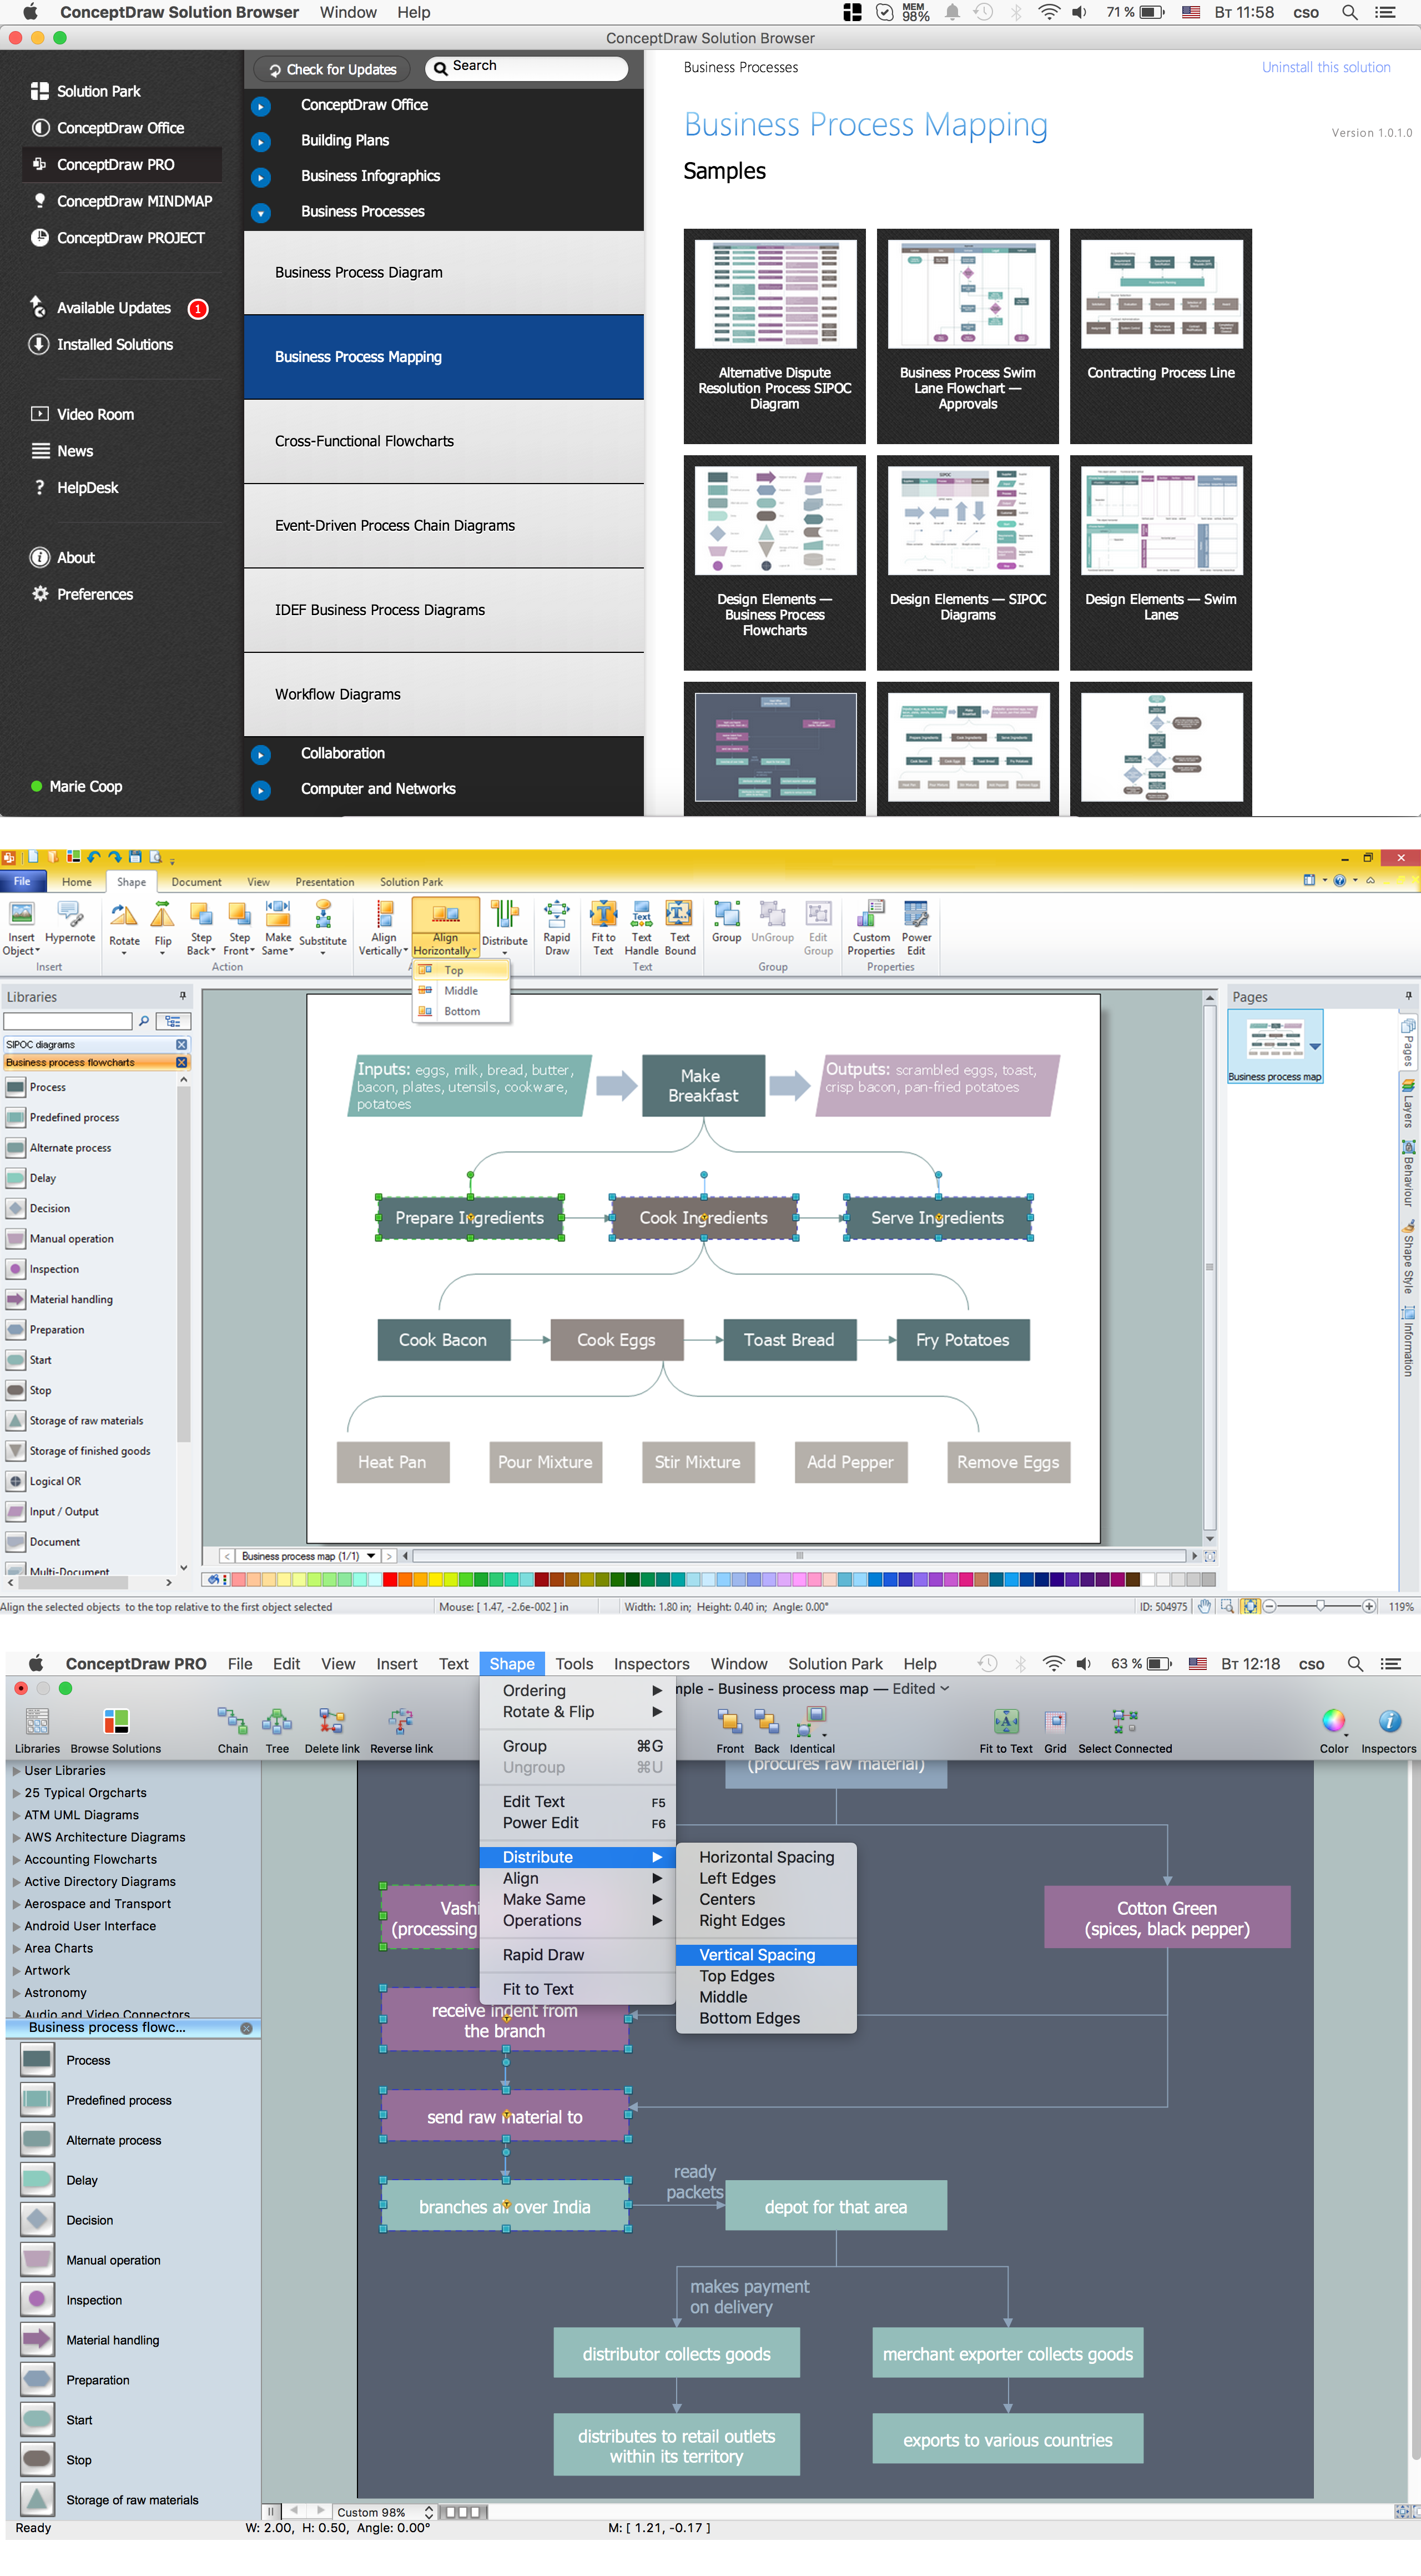
Picture: Business Process Flowchart Symbols
Related Solution:
UML Communication diagramming software with rich examples and template. ConceptDraw is ideal for software designers and software developers who need to draw UML Communication Diagrams.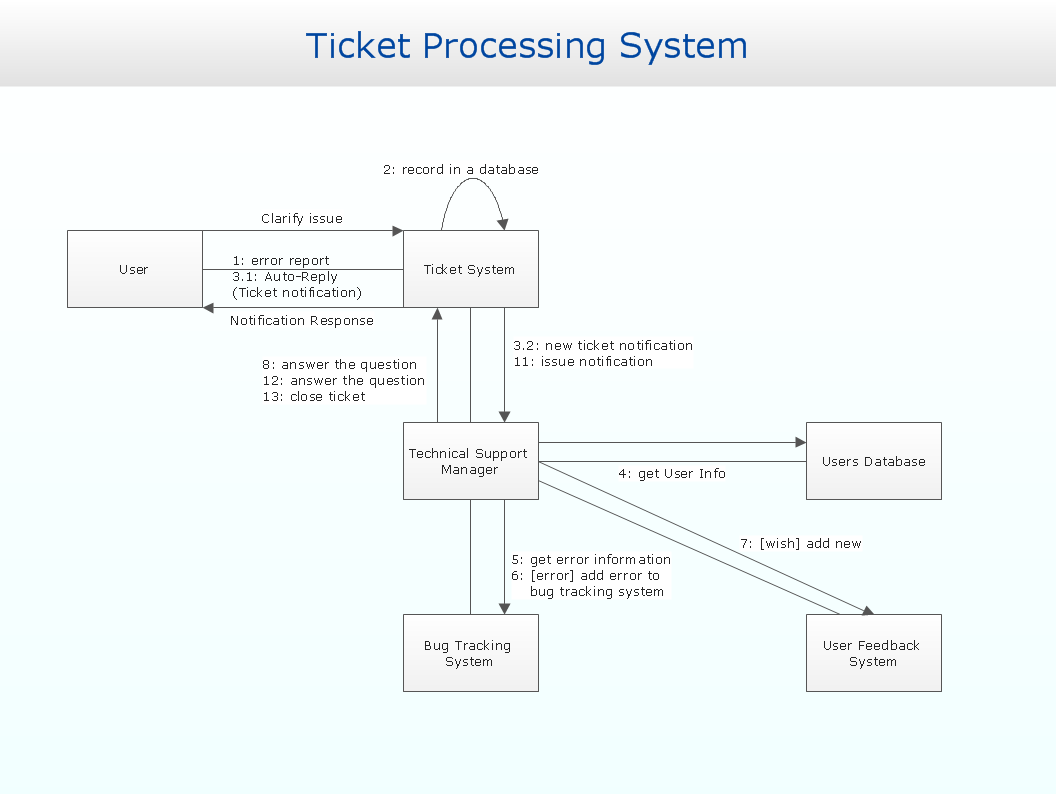
Picture: Communication Diagram UML2.0 / Collaboration UML1.x
It doesn’t matter what kind of business you have, a bar or a gym, there are common concepts for any of them. One of those concepts is accounting, and to facilitate the work with the figures, you can use accounting flowchart symbols and create a clear and representative scheme. You can create flowchart for auditing, tax accounting and even for planning your own budget.
A graphical tool for displaying successive processes is flowchart. This method is mostly suited to represent an accounting process. The sequence of steps in the accounting process usually consists of standard accounting procedures, that can be depicted by using a minimal number of symbols, applied for the basic flowcharting. The advanced opportunity to create professional Accounting Flow charts is provided by ConceptDraw Accounting Flowcharts solution. It includes contains a library of accounting flowchart symbols used when drawing the accounting process flow.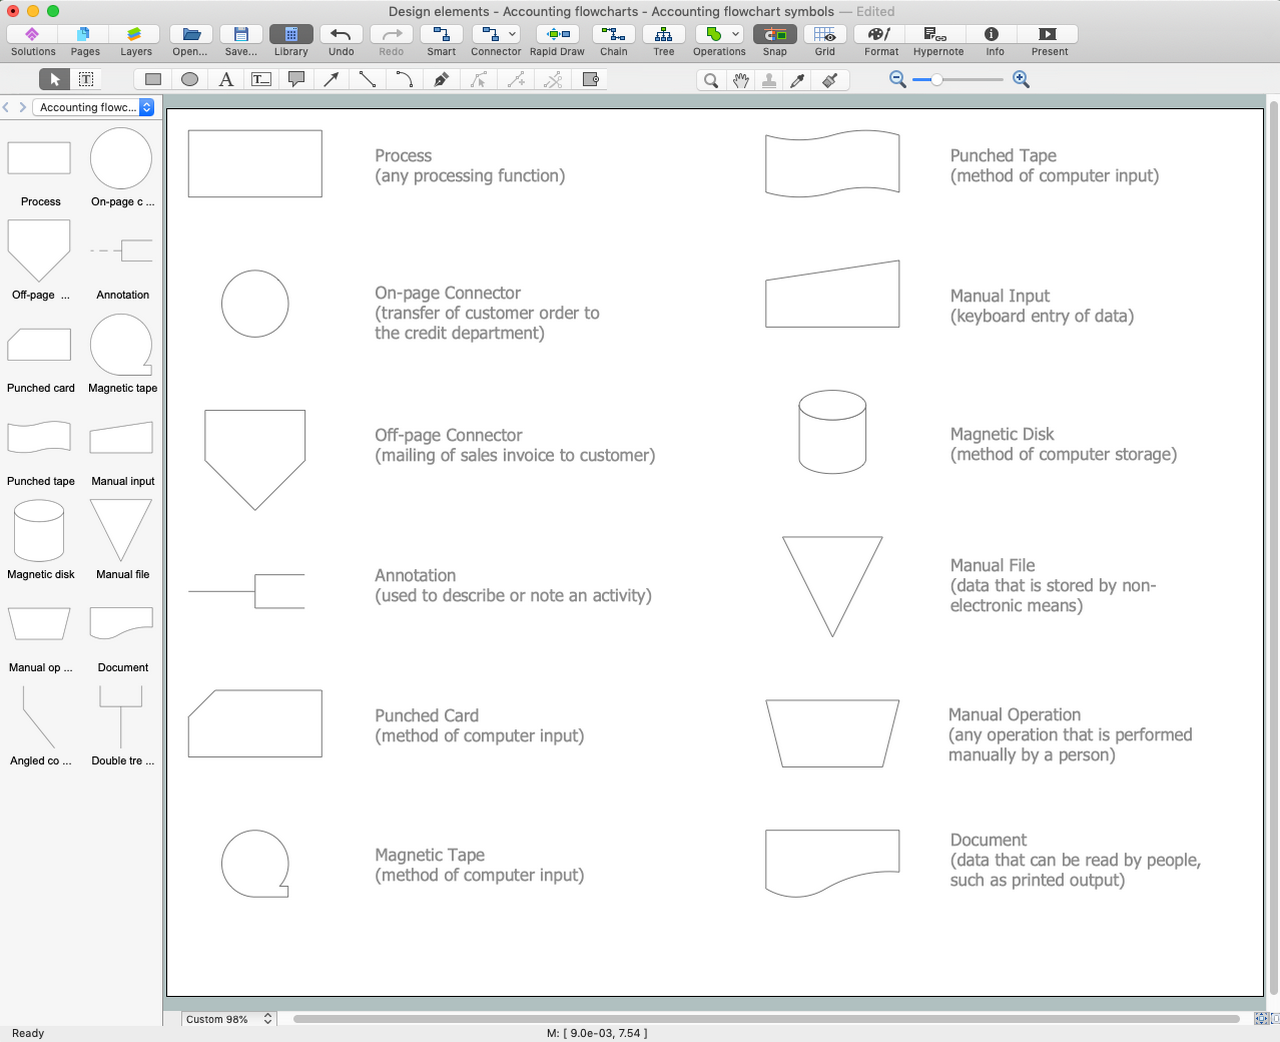
Picture: Accounting Flowchart Symbols
Related Solution:
This sample shows the Polar Graph. The Polar Graph is a graph in the polar coordinate system in which the each point on the plane is defined by two values - the polar angle and the polar radius. The certain equations have very complex graphs in the Cartesian coordinates, but the application of the polar coordinate system allows usually produce the simple Polar Graphs for these equations.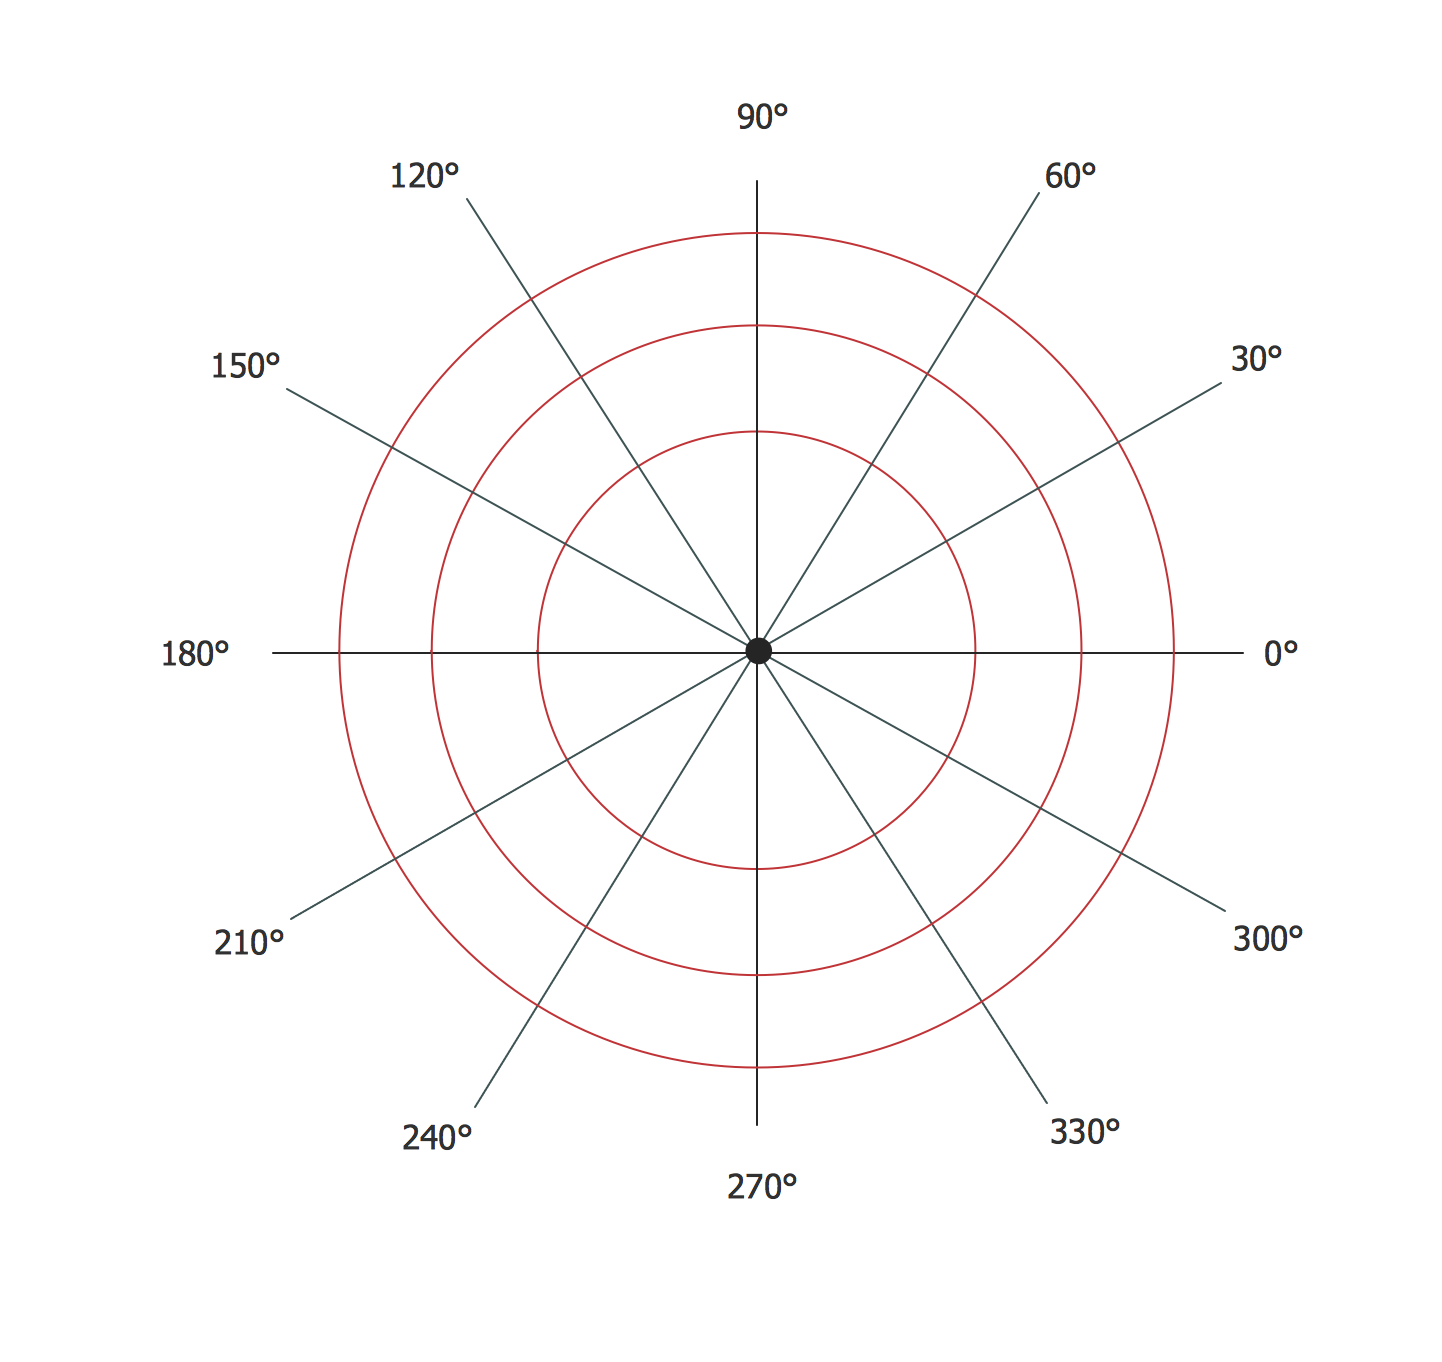
Picture: Polar Graph
If you are an advanced diagramming software user, you might use it daily. Traversing the Internet in searching of alternative to MS Visio for MAC and PC, you can fulfill all your requirements with ConceptDraw DIAGRAM. Don’t hesitate to transfer your documents to another operating system.
When looking for a smart and simple tool for business diagrams as alternative to MS Visio for Apple OS X platform, ConceptDraw DIAGRAM certainly is the best choice. Making many kinds of business charts, numerous technical drawings is what ConcepDraw DIAGRAM is the best. One can easy create any diagram and complete it perfectly and quickly. The big collection of vector object libraries, templates and samples, make it the best Microsoft Visio alternative: ConceptDraw DIAGRAM is simpler to use, less expensive, and supports project management and mind mapping methods.
Picture:
In Searching of Alternative to MS Visio for Mac and PC
with ConceptDraw DIAGRAM