Swim Lanes
Swim lanes are visual elements used in Business Process Maps, Process Flow Diagrams and Flowcharts. Parallel lines which can be arranged horizontally or vertically divide the diagram into lanes. Processes and decisions are visually grouped in these lanes, the arrows between them can be used to represent how information or material is passed between the subprocesses of a business process.
ConceptDraw DIAGRAM diagramming and vector drawing software extended with Business Process Mapping Solution from the Business Processes Area of ConceptDraw Solution Park is ideal for drawing Business Process Maps and Swim Lanes Flowcharts.
Example 1. Swim Lanes Flowchart in ConceptDraw DIAGRAM
It's incredibly convenient to develop Swim Lanes Flowcharts in ConceptDraw DIAGRAM using the predesigned vector objects offered by 3 libraries of Business Process Mapping Solution:
- Business Process Flowcharts library
- SIPOC Diagrams library
- Swim Lanes library

Example 2. Business Process Flowcharts Library Design Elements
All that you need is simply choose the needed objects from the offered, drag them from the libraries to your document and place in desired order.
You can create your diagram from the beginning in new document or use as the base one of the professionally designed samples offered by Business Process Mapping Solution in ConceptDraw STORE.

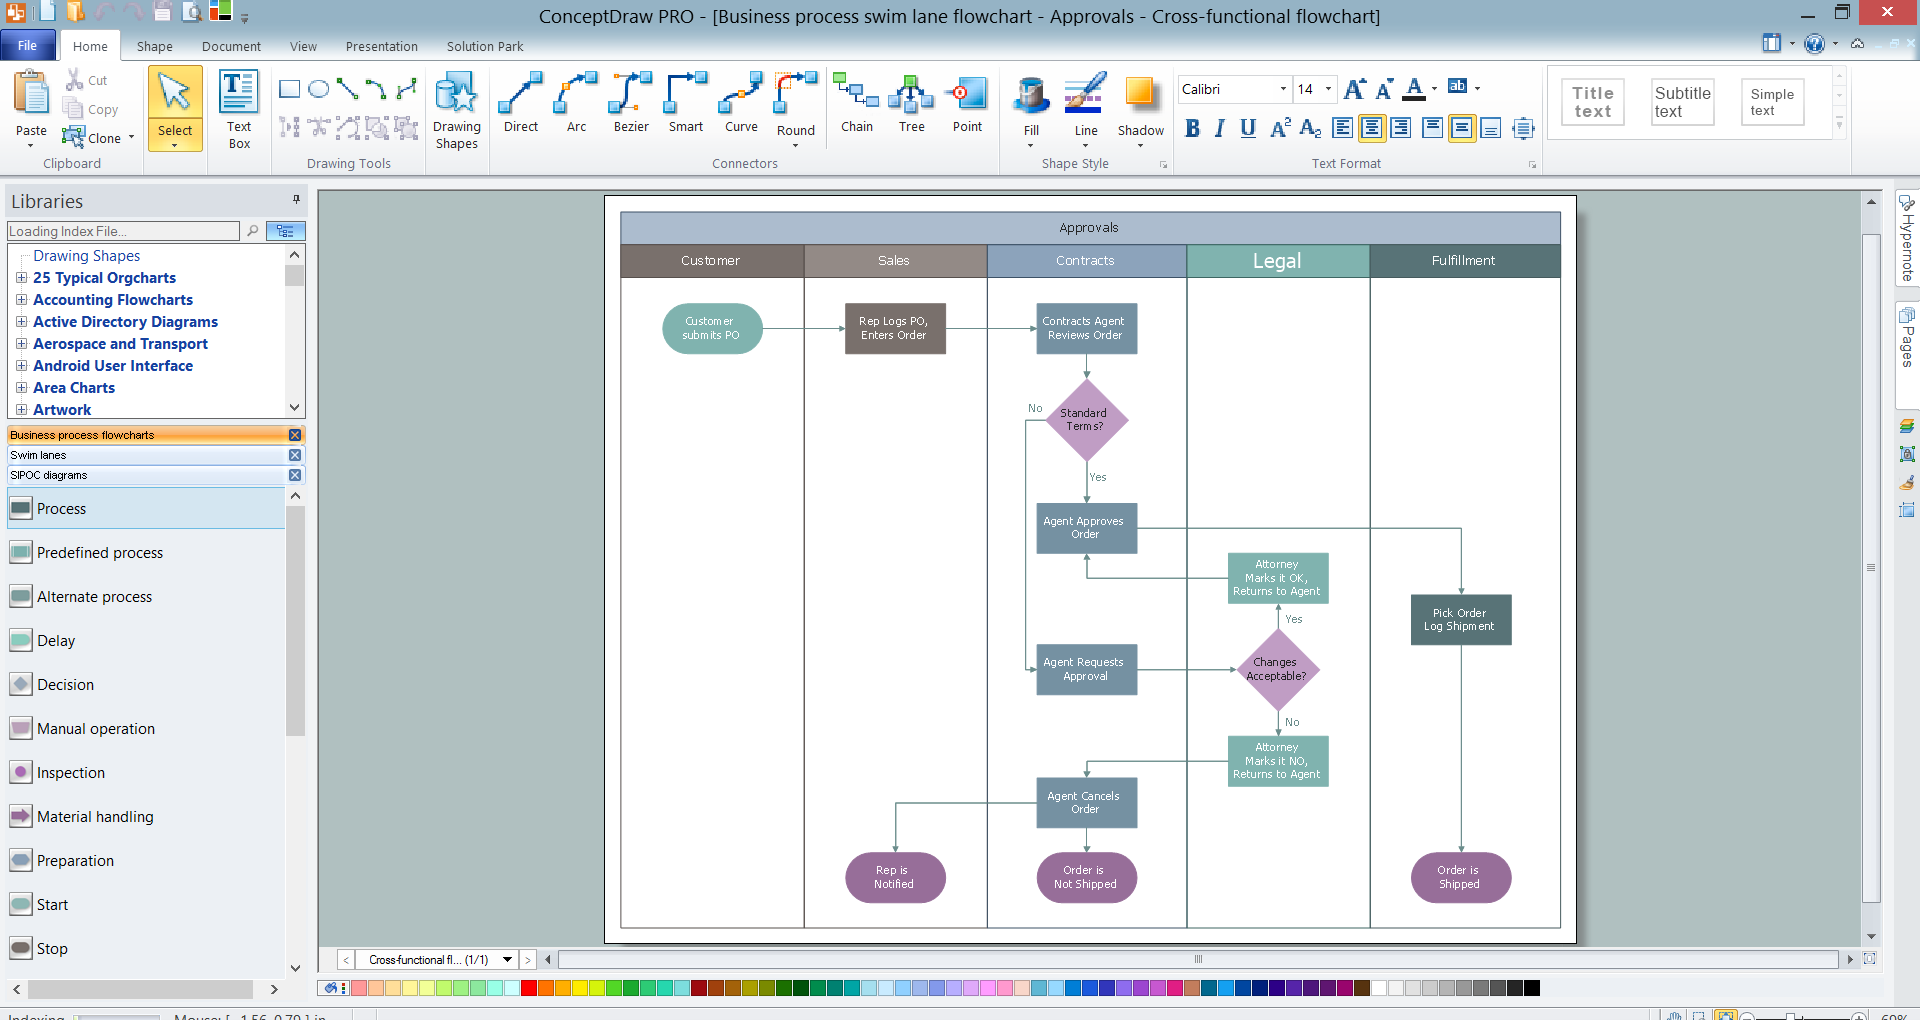
Example 3. Swim Lanes Flowchart - Approvals
The sample you see on this page was created in ConceptDraw DIAGRAM software using the tools of Business Process Mapping Solution and demonstrates the Swim Lanes Flowchart. This sample was included in Business Process Mapping Solution and is available from ConceptDraw STORE. An experienced user spent 10 minutes creating this sample.
Use the Business Process Mapping Solution for ConceptDraw DIAGRAM software to design your own Swim Lanes Flowcharts, Business Process Maps and SIPOC Diagram fast, easy and effective.
All source documents are vector graphic documents. They are available for reviewing, modifying, or converting to a variety of formats (PDF file, MS PowerPoint, MS Visio, and many other graphic formats) from the ConceptDraw STORE. The Business Process Mapping Solution is available for all ConceptDraw DIAGRAM users.
TEN RELATED HOW TO's:
Process Flow Chart is a visual diagram which shows the processes and relationships between the major components in a system, and uses for this the special process flow chart symbols: special shapes to represent different types of actions and process steps, lines and arrows to represent relationships and sequence of steps. It often named process flow diagram, it use colored flowchart symbols.
It is incredibly convenient to use the ConceptDraw DIAGRAM software extended with Flowcharts Solution from the Diagrams Area of ConceptDraw Solution Park for designing professional looking Process Flow Charts.
Picture: Process Flow Chart Symbols
Related Solution:
Data flow diagrams are the graphical tool, used in the visualization of data flow of some data processing systems. It is the valuable process modeling tool. Also designing DFD is the important component of the initial part of any information system development project. The standard symbols are used to represent the interaction of a system components and how various kinds of components influence on data flow. The ConceptDraw Data Flow Diagrams solution is design to assist professional software engineers in making DFDs according to Gane and Sarson, and Yourdon and Coad notations.
Do you imagine yourself as a successful IT specialist? To your mind, they all use data flow diagram examples to learn and to get inspired. Aren’t you still with us?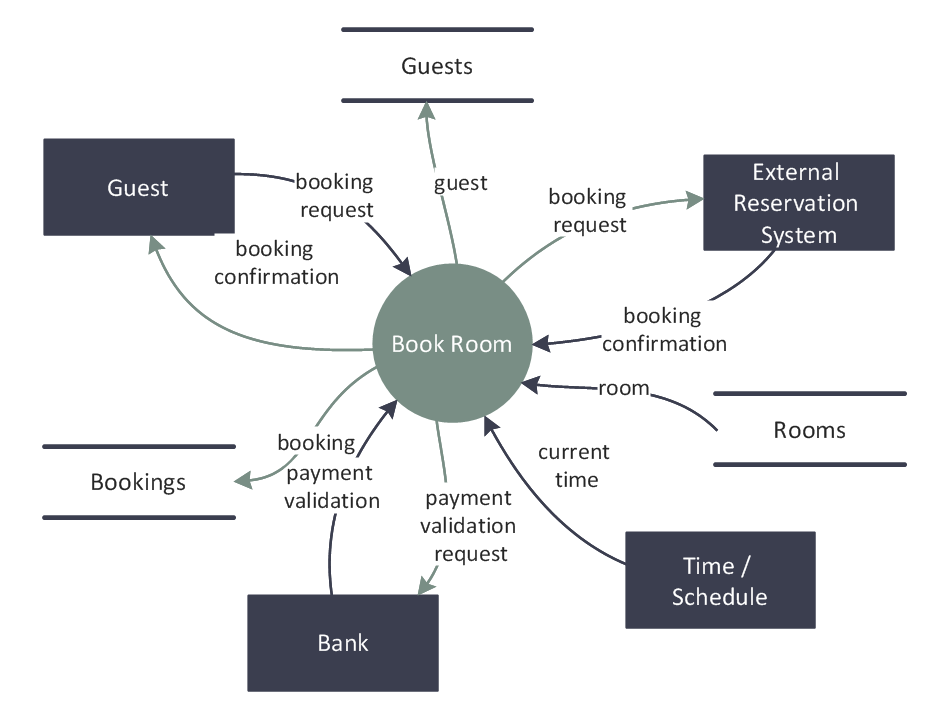
Picture: Data Flow Diagram Examples
Related Solution:
A competent delegation of responsibilities between workers guarantees business success in most cases. At first sight, it might seem that workflow diagram symbols are quite similar to a regular flowchart. But workflow diagram is a more accurate way to present working processes.
Workflow diagrams are helpful for a working process analyzation, to depict a pathway of process issues, personalize responsibilities and identify resources that will help to optimize a workflow. Generally, Workflow diagram deploys flowchart symbols for displaying work process steps and relationships. But, often it require some additions and improvements to become more professional and illustrative. The Workflow solution for ConceptDraw DIAGRAM provides the user with a big library of symbols that are designed especially for workflow diagrams.
Picture: Workflow Diagram Symbols
Related Solution:
Flowcharts can be used in designing and documenting both simple and complex processes or programs and, similar to the other types of diagrams, they can help visualize what happens and so help understand some definite process, and, as a result, find flaws, bottlenecks and other features within it.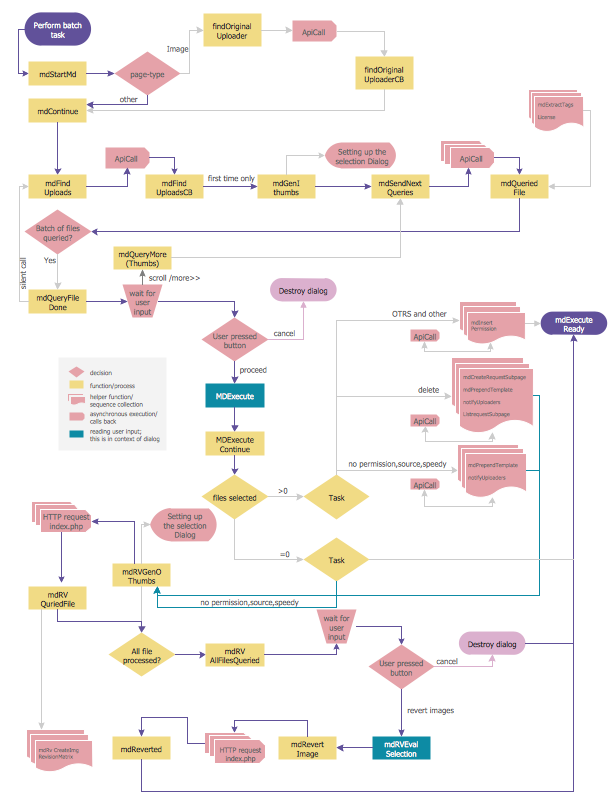
Picture: Flowchart Programming Project. Flowchart Examples
Related Solution:
It's very simple, convenient and quick to design professional looking Flowcharts of any complexity using the ConceptDraw DIAGRAM diagramming and vector drawing software extended with Flowcharts Solution from the Diagrams Area of ConceptDraw Solution Park which provides a wide set of predesigned objects, templates, samples and Flowchart examples.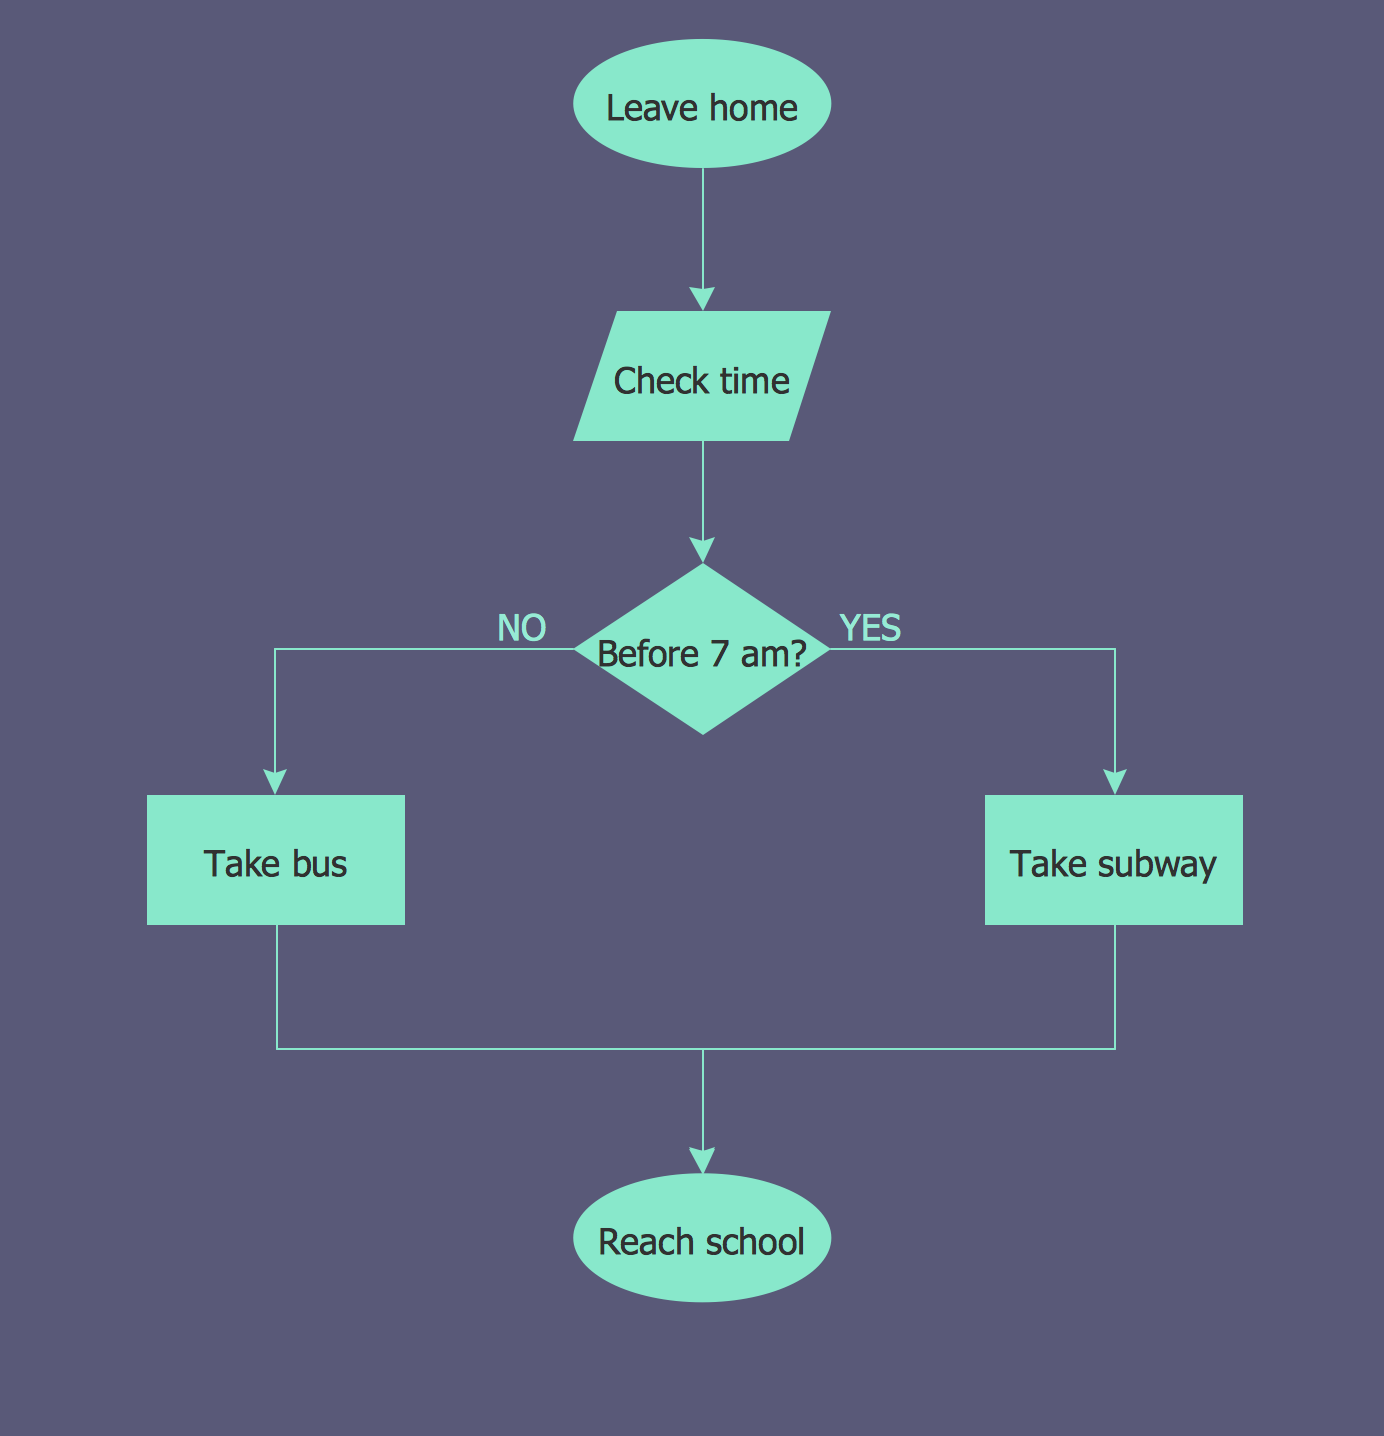
Picture: Flowchart Examples
Related Solution:
The vector stencils library IDEF0 Diagram from the solution IDEF0 Diagrams contains specific IDEF0 diagram symbols such as arrow symbols and entity symbols for ConceptDraw DIAGRAM diagramming and vector drawing software. The IDEF0 Diagram solution is contained in the Software Development area of ConceptDraw Solution Park.
Picture: IDEF0 Diagram
Related Solution:
ConceptDraw DIAGRAM diagramming and vector drawing software extended with Bar Graphs solution from the Graphs and Charts area of ConceptDraw Solution Park is ideal for drawing the Bar Charts fast and simply.
Picture: Bar Charts
Related Solution:

