SWOT Analysis
The SWOT Analysis provides information that is helpful in matching the firm's resources and capabilities to the competitive environment in which it operates. As such, it is instrument in strategy formulation and selection.
The ConceptDraw DIAGRAM extended with SWOT and TOWS Matrix Diagrams Solution and ConceptDraw MINDMAP software allow professional to make well-designed SWOT matrix in minutes.
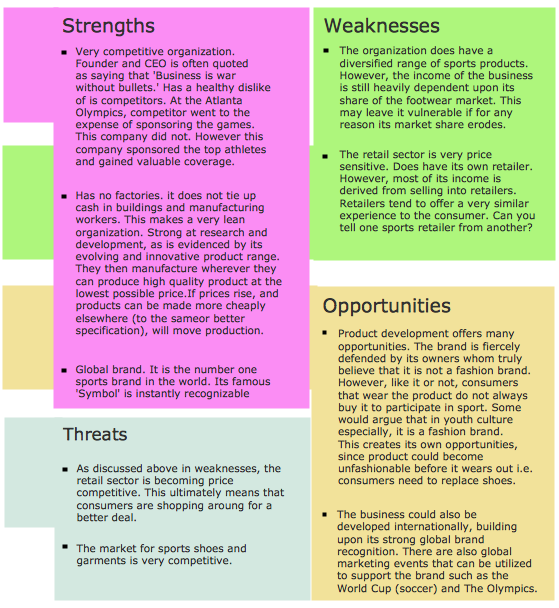
Example 1. SWOT Analysis - Athletic Shoe Company
SWOT analysis is a method of strategic planning which identifies the factors internal and external environment of the firm and divides them into 4 categories:
- Strengths are company's resources and capabilities that can be used as a basis for developing a competitive advantage.
- Weaknesses are the competitive capabilities absence may be viewed as a weakness.
- Opportunities are the external environment may reveal certain new opportunities for profit and growth.
- Threats are changes in the external environmental also may present threats to the firm.

Example 2. SWOT Analysis
The SWOT and TOWS Matrix Diagrams Solution contains easy-to-use templates, samples and examples that help identify Strengths, Weaknesses, Opportunities, and Threats using ConceptDraw DIAGRAM software.
Use SWOT and TOWS analysis to plan strategic actions for your company, department, team, project, process, marketing campaign, or even self-improvement with help of ConceptDraw DIAGRAM

Example 3. SWOT Analysis Positioning Matrix
The samples you see on this page were created in ConceptDraw DIAGRAM using the tools of SWOT and TOWS Matrix Diagrams Solution. These TOWS matrices successfully demonstrate solution's capabilities and professional results you can achieve. An experienced user spent 10 minutes creating every of these samples.
All source documents are vector graphic documents. They are available for reviewing, modifying, or converting to a variety of formats (PDF file, MS PowerPoint, MS Visio, and many other graphic formats) from the ConceptDraw STORE. The SWOT and TOWS Matrix Diagrams Solution is available for all ConceptDraw DIAGRAM or later users.
TEN RELATED HOW TO's:
A list of parameters on which networks differ is very long. A large network with a range up to 50 kilometers is called metropolitan area network (MAN), and this type of network can include several local area networks. Metropolitan networks in their turn connect into global area networks.
Here you will see a Metropolitan Area Network (MAN). This is an extensive network which occupies a large territory including a few buildings or even the whole city. The space of the MAN is bigger than LAN, but lower than WAN. MAN comprise a lot of communication equipment and delivers the Internet connection to the LANs in the city area. Computer and Networks solution for ConceptDraw DIAGRAM provides a set of libraries with ready-to-use vector objects to design various kinds of computer networks.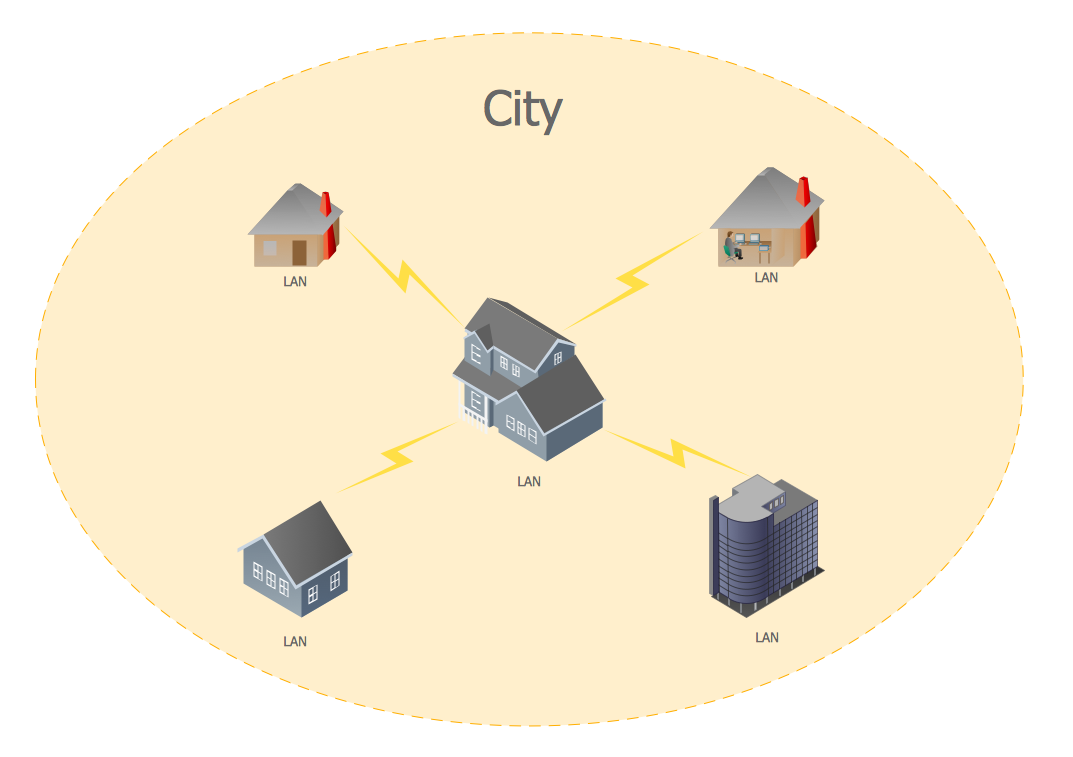
Picture: Metropolitan area networks (MAN). Computer and Network Examples
Related Solution:
There are numerous articles about the advantages of flowcharting, creating business graphics and developing different charts. Nevertheless, these articles are almost useless without the main component - the examples of flowcharts, org charts and without a fine example, it is difficult to get all the conveniences of creating diagrams. You can find tons of templates and vivid examples on Solution Park.
This illustration shows a variety of business diagrams that can be created using ConceptDraw DIAGRAM. It comprises a different fields of business activities: management, marketing, networking, software and database development along with design of infographics and business illustrations. ConceptDraw DIAGRAM provides a huge set of sample drawings including business process modeling diagrams,, network diagrams, UML diagrams, orgcharts, DFD, flowcharts, ERD, geographical maps and more.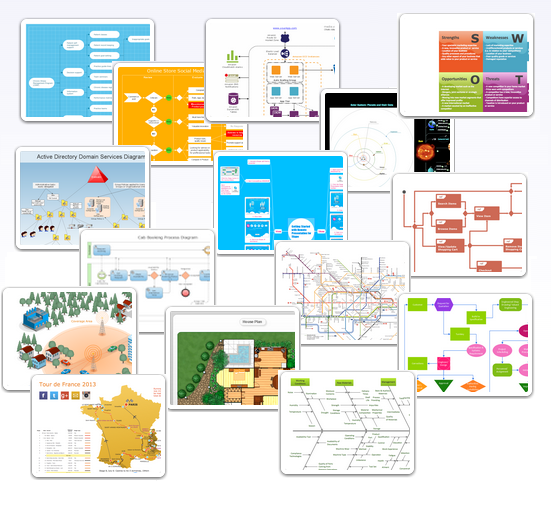
Picture: Examples of Flowcharts, Org Charts and More
Related Solution:
Comparing ConceptDraw DIAGRAM to Omnigraffle - Cross-platform product. While most drawing tools are designed for use on one operating system, ConceptDraw DIAGRAM is available as two independent and concurrent versions on both Macintosh (macOS) and PC (Windows).
License is per named user. That means you can use a single license for Macintosh and PC. Users can install at work and at home with a single license.
Picture: Comparing ConceptDraw DIAGRAM to Omnigraffle
Related Solution:
If you want to find a way to understand complex things in minutes, you should try to visualize data. One of the most useful tool for this is creating a flowchart, which is a diagram representing stages of some process in sequential order. There are so many possible uses of flowcharts and you can find tons of flow charts examples and predesigned templates on the Internet. Warehouse flowchart is often used for describing workflow and business process mapping. Using your imagination, you can simplify your job or daily routine with flowcharts.
Warehouse flowcharts are used to document product and information flow between sources of supply and consumers. The flowchart provides the staged guidance on how to manage each aspect of warehousing and describes such aspects as receiving of supplies; control of quality; shipment and storage and corresponding document flow. Warehouse flowchart, being actual is a good source of information. It indicates the stepwise way to complete the warehouse and inventory management process flow. Also it can be very useful for an inventory and audit procedures.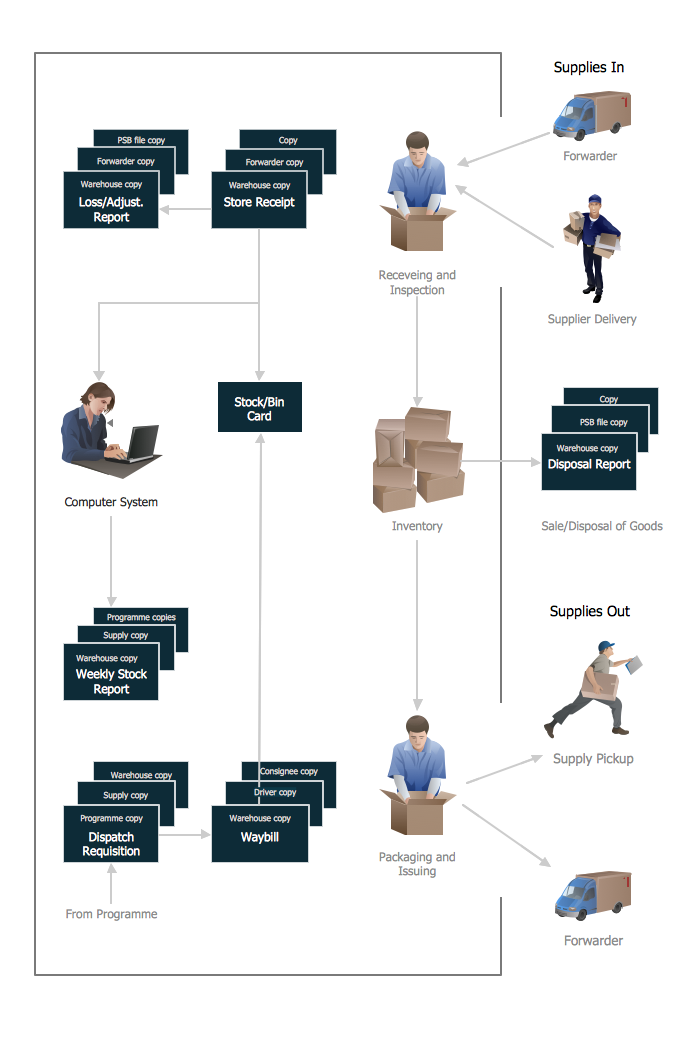
Picture:
Flow chart Example
Warehouse Flowchart
Related Solution:
The Total Quality Management Diagram solution helps your organization visualize business and industrial processes. Create Total Quality Management diagrams for business process with ConceptDraw software.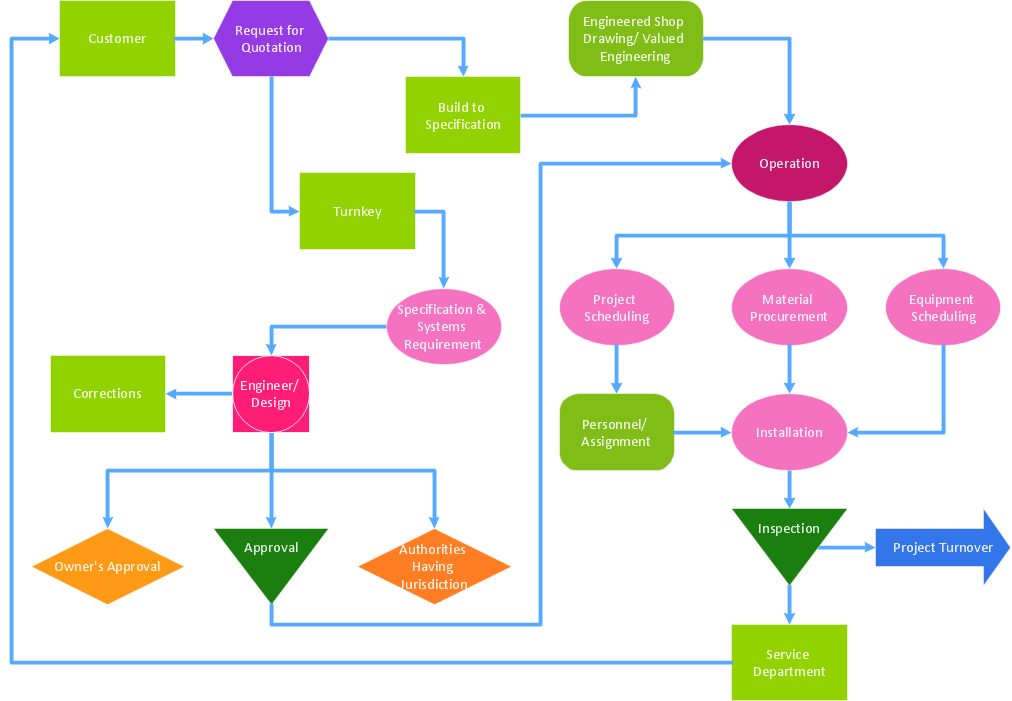
Picture: Identifying Quality Management System
Related Solution:
This sample was created in ConceptDraw DIAGRAM diagramming and vector drawing software using the Organizational Charts Solution from the Software Development area of ConceptDraw Solution Park.
This sample shows the organizational chart in the field of Architect Engineering. Create your own orgchart professional drawings using ConceptDraw.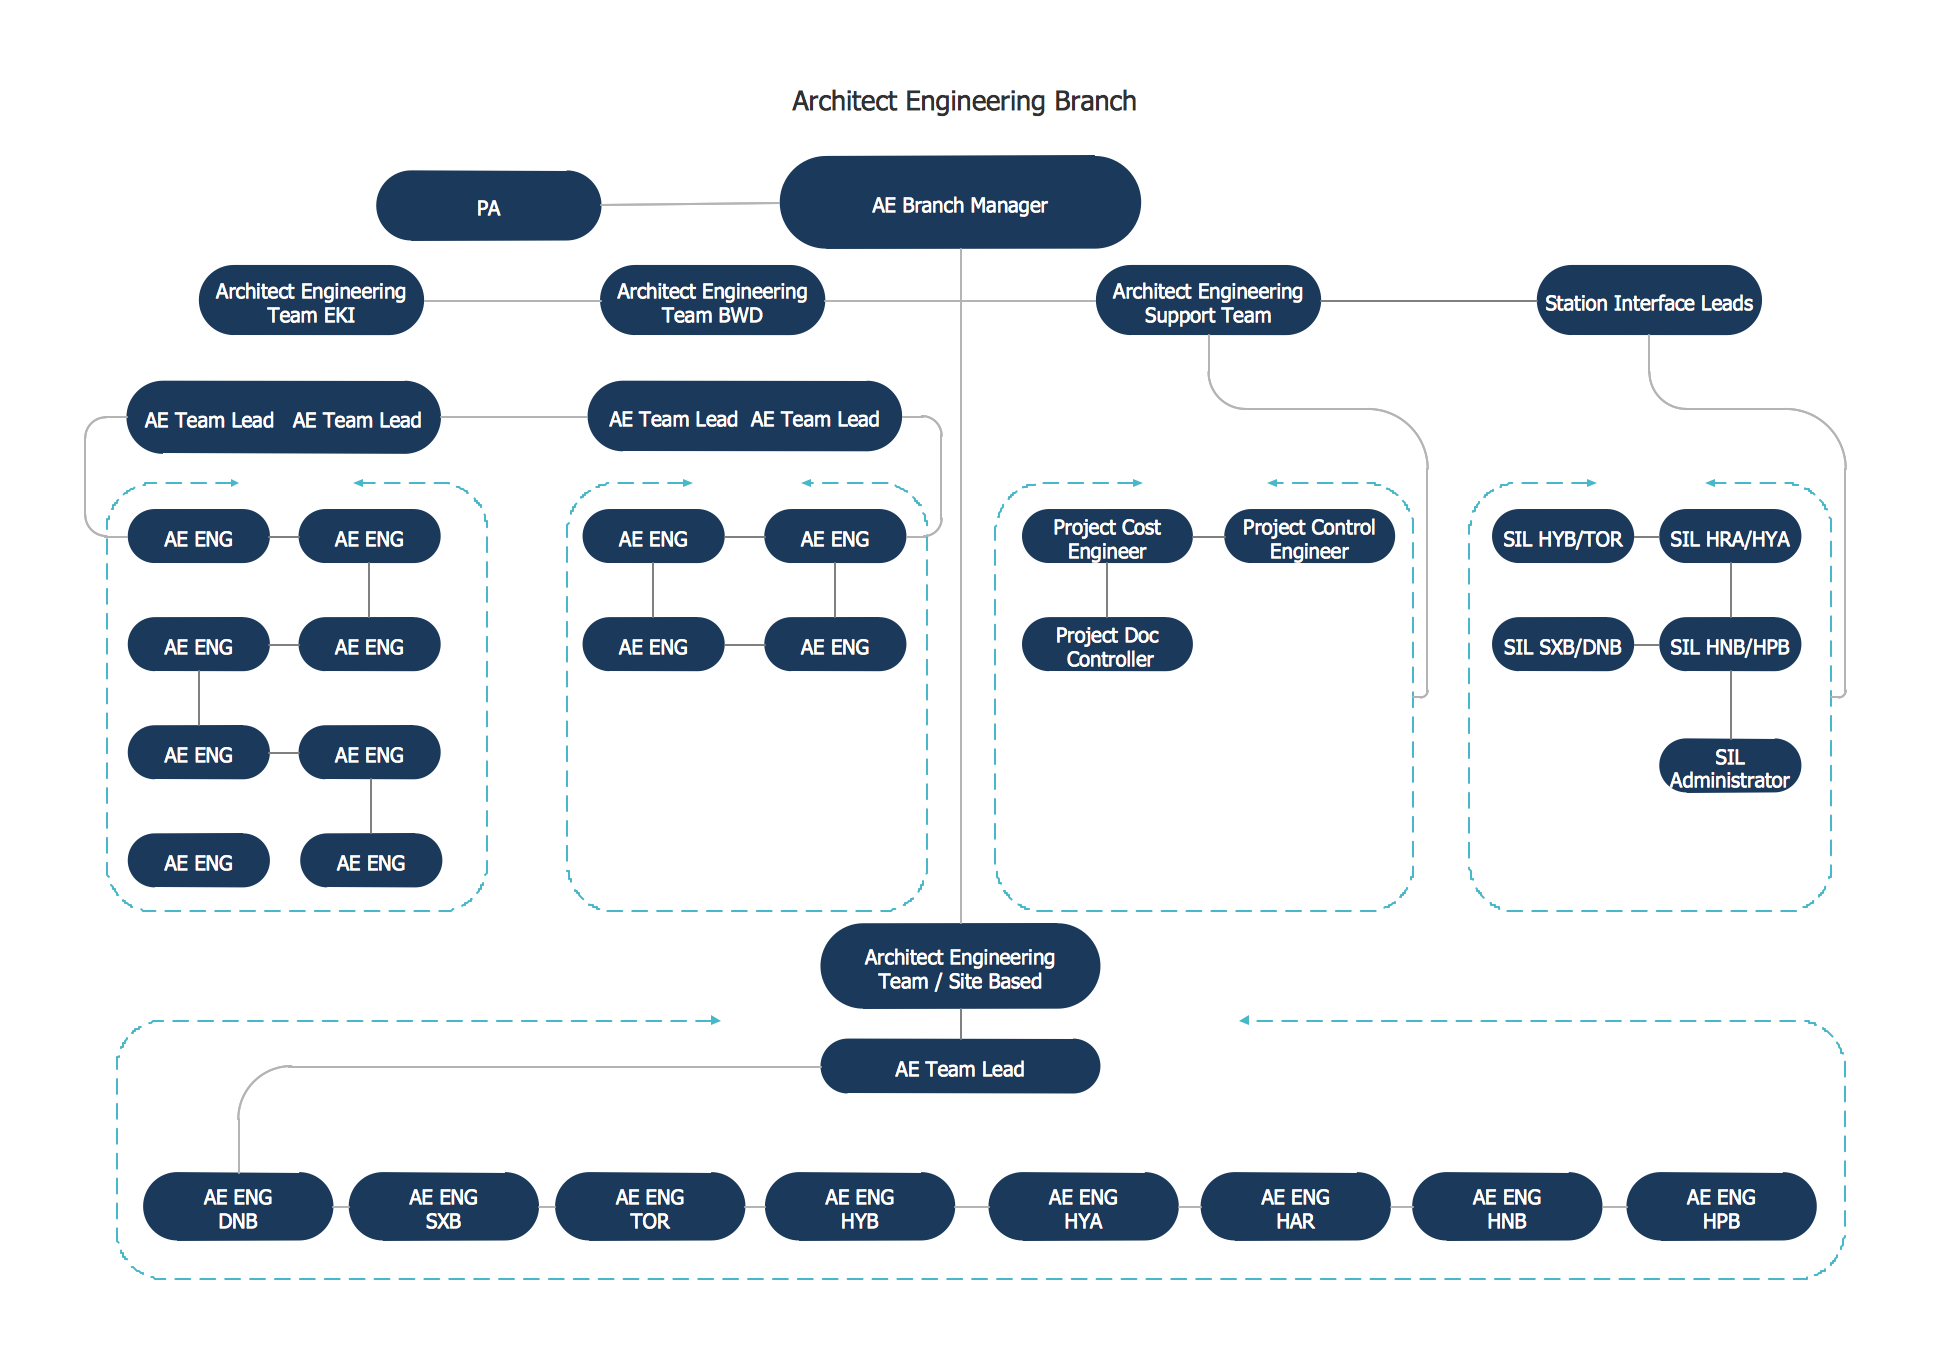
Picture: Business Board Org Chart
Related Solution:
Collaborative Project Management via Skype is an ideal tool for project teams who need to master a growing project complexity.
Picture: How To Implement Collaborative Project Management
Related Solution:
ConceptDraw DIAGRAM diagramming and vector drawing software enhanced with Fishbone Diagrams solution from the Management area of ConceptDraw Solution Park gives the ability to draw Fishbone diagram, which identifies many possible causes for an effect for problem solving. Fishbone Diagram procedure of creation includes the set of steps easy for execution in ConceptDraw DIAGRAM.
Picture: Fishbone Diagram Procedure
Related Solution:
The most worked out and commonly used methodology of business processes description is IDEF methodology. Besides business processes it allows to describe functional blocks, for example production and marketing. ConceptDraw lets creation of business processes description using IDEF0 and IDEF2 methods.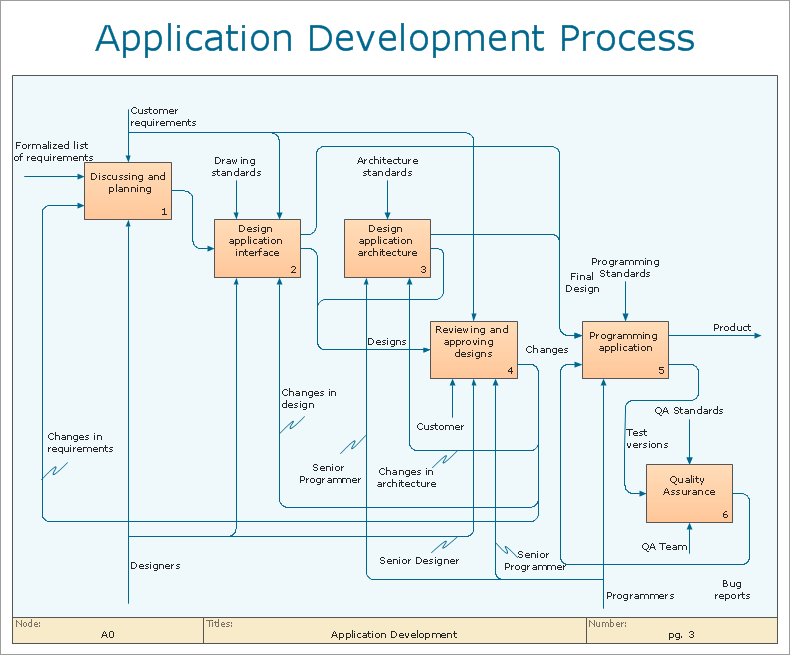
Picture: Business Processes
Related Solution:

