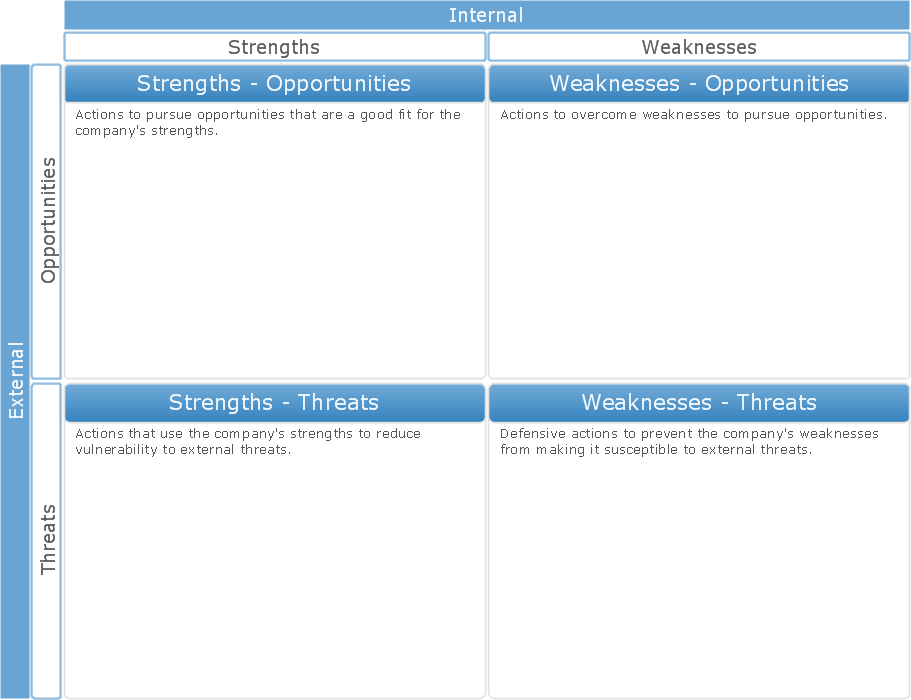
TOWS matrix template contains a blank TOWS Matrix to be filled with the user’s data. After SWOT analysis, TOWS analysis focuses on external factors and action planning.
This sample of a completed TOWS matrix diagram with example entities provides an example to help you start your SWOT and TOWS analysis.
TEN RELATED HOW TO's:
Tracking Olympic results in visual format is the most modern way to deliver statistics to a broad audience. This is a good example of an illustrated table you may easily modify, print, or publish on web from ConceptDraw Winter Sports solution.
Picture: Winter Sports Vector Clipart. Medal Map. Spatial Infographics
Related Solution:
TOWS analysis is a method of strategic analysis which is oriented on the study of the threats (T) which are danger for the company and new opportunities (O) which are closely connected with weaknesses (W) and strengths (S) sides of its activity.
ConceptDraw DIAGRAM diagramming and vector drawing software extended with SWOT and TOWS Matrix Diagrams Solution from the Management Area is the best for realization TOWS analysis and for quick and easy construction TOWS Matrix.
Picture: TOWS Analysis Software
Related Solution:
For vector shapes and connector tools for quick and easy drawing diagrams for business, technology, science and education - The best choice for Diagramming is ConceptDraw DIAGRAM.
Picture: Diagram Software - The Best Choice for Diagramming
TOWS Analysis is a variant of the classic business tool - SWOT analysis, but it is directed more outside. It allows you to analyze the internal environment (weaknesses and strengths) and to plan your own changes through the analysis of changes in the external environment (threats and opportunities).
ConceptDraw DIAGRAM extended with unique SWOT and TOWS Matrix Diagrams Solution from the Management Area is a powerful software for effective TOWS analysis.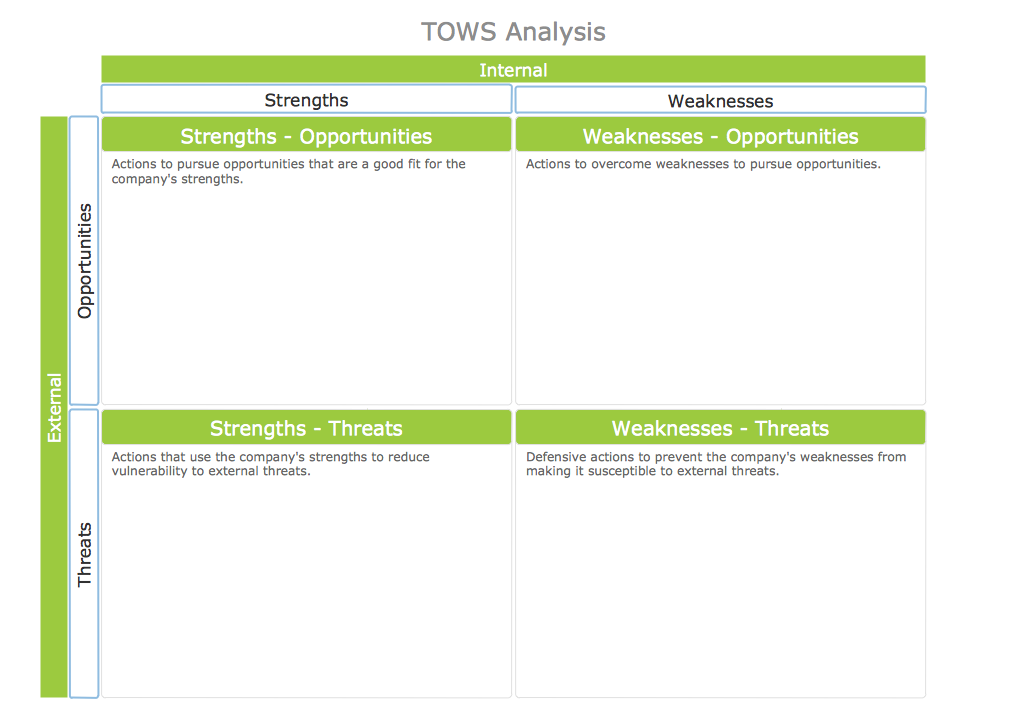
Picture: TOWS Analysis
Related Solution:
All these bar chart templates are included in the Bar Graphs solution.
You can quickly rework these bar graph templates into your own charts by simply changing displayed data, title and legend texts.
Picture: Bar Chart Template for Word
Related Solution:
Gant Chart is a graphical representation of tasks as segments on a time scale. It helps plan and monitor project development or resource allocation. The horizontal axis is a time scale, expressed either in absolute or relative time.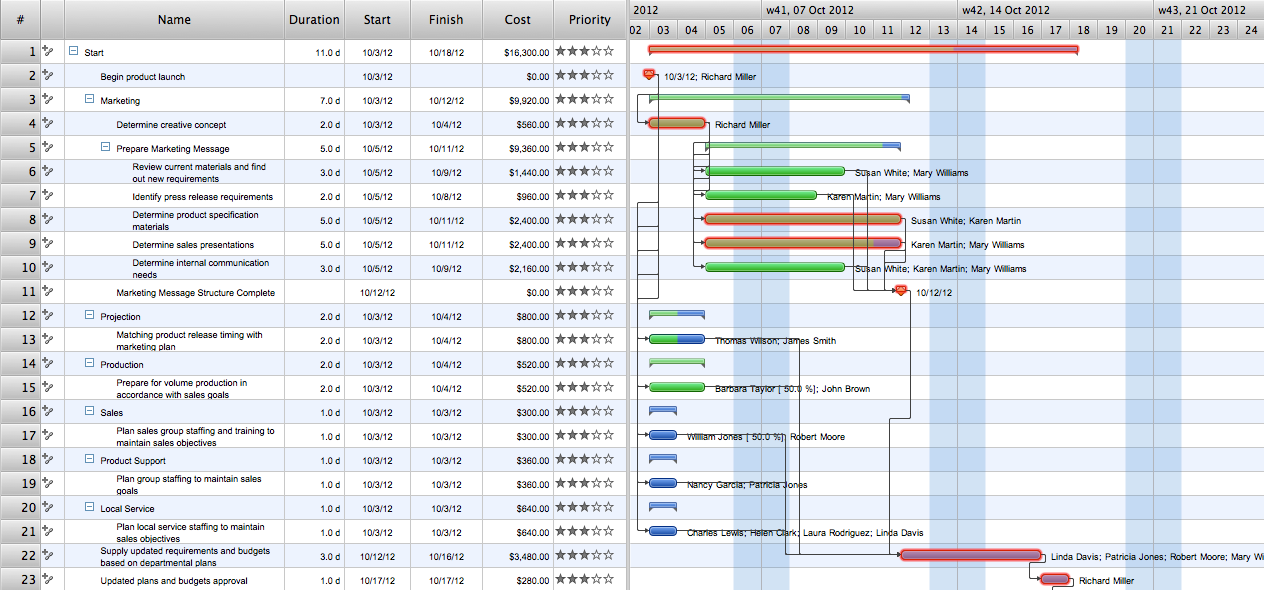
Picture: Gant Chart in Project Management
Related Solution:
Collaborative Project Management via Skype is an ideal tool for project teams who need to master a growing project complexity.
Picture: How To Implement Collaborative Project Management
Related Solution:
The Ishikawa diagram, Cause and Effect diagram, Fishbone diagram — all they are the names of one and the same visual method for working with causal connections. Originally invented by Kaoru Ishikawa to control the process quality, the Ishikawa diagram is well proven in other fields of management and personal scheduling, events planning, time management. It is a chart in the form of a fish, whose head is a problem, the fins are variants for its causes.
To design easily the Fishbone diagram, you can use a special ConceptDraw DIAGRAM vector graphic and diagramming software which contains the powerful tools for Fishbone diagram problem solving offered by Fishbone Diagrams solution for the Management area of ConceptDraw Solution Park.
Picture: Fishbone Diagram Problem Solving
Related Solution:
Working with personnel might be difficult if you are not prepared enough. To explain your workers all the details of communication with customers, you can draw an order process flowchart which will describe every step of the process and answer all the questions that might appear. You can view a lot of business process mapping diagram examples here, in ConceptDraw Solution Park.
This business process flow chart is created to illustrate the sample work order process. Before an organization can make some work for a person, the customer work order request must be completed. It is needed for tracking and accountability objectives. We used this business process flowchart to show a certain tasks and actions assumed by an organization. This flowchart depicts the outside inputs that are needed to launch a process, and ways the organization delivers its outputs. This business process flowchart was created with a help of ConceptDraw Business Process Mapping solution.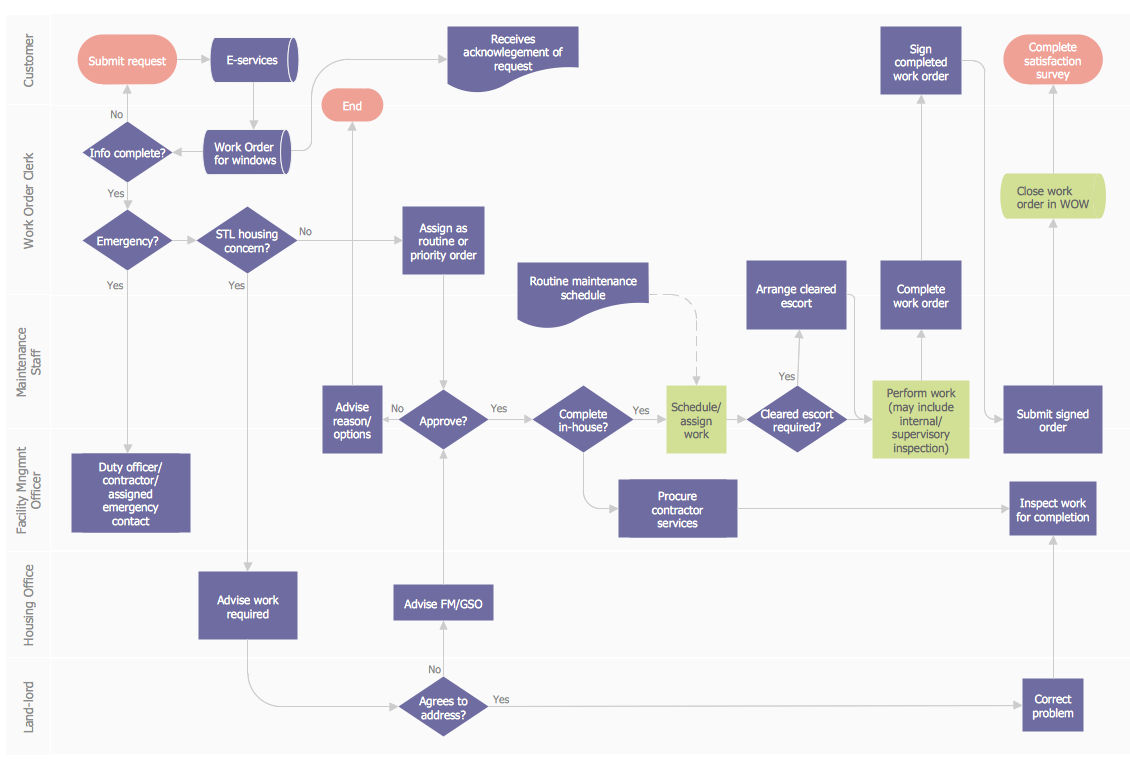
Picture: Work Order Process Flowchart. Business Process Mapping Examples
Related Solution:
ConceptDraw is a best data visualization tool that will allow everyone to create rich infographics and visualizations quickly and easily.
Picture: Best Tool for Infographic Construction