SWOT Sample in Computers
SWOT analysis is a method of the making plan for evaluate the Strengths, Weaknesses, Opportunities, and Threats involved in a project. It involves specifying the objective of the project and identifying the internal and external causes for the accomplishing project goals.
The ConceptDraw DIAGRAM is a best diagram software. The SWOT Analysis solution includes the SWOT matrix samples, and templates that allow users create own SWOT diagram.
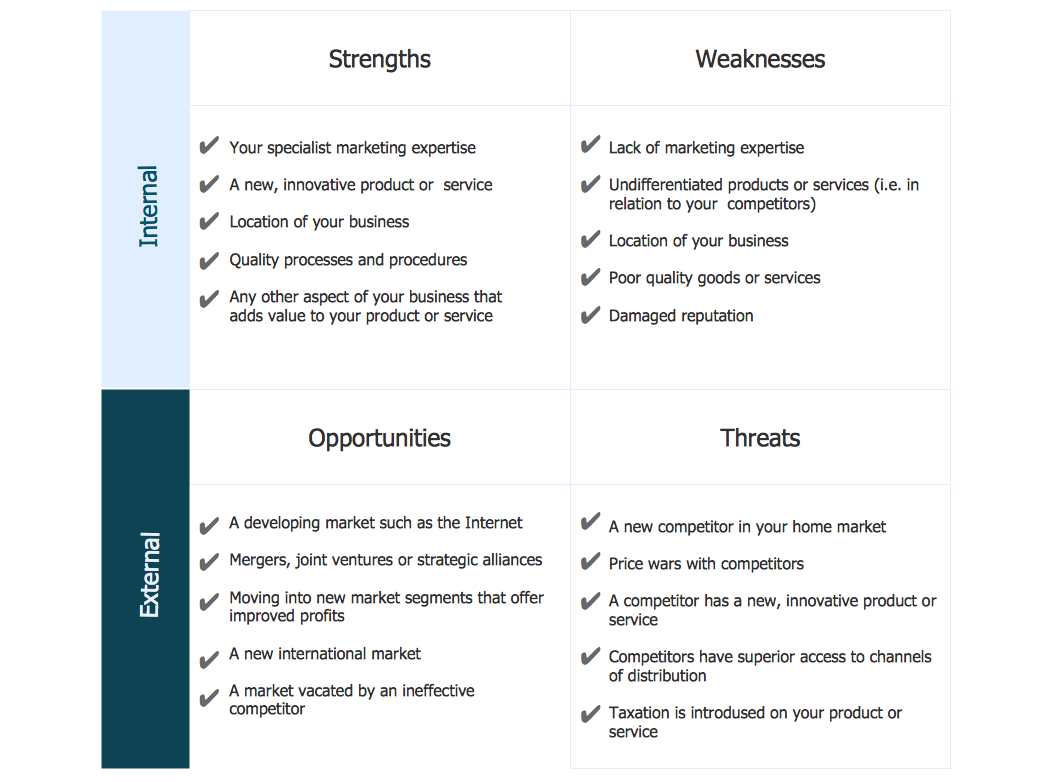
Sample 1. SWOT analysis sample - Innovative business.
This sample of a completed SWOT Matrix with example entities provides an example to help you start your analysis of Strengths, Weaknesses, Opportunities and Threats facing a project or business.
See also:
Marketing — Matrices
- Marketing positioning matrix - Product positioning map
- Product-market matrix - Ansoff matrix
- BCG matrix - Boston growth-share matrix
- Feature comparison chart - Digital scouting cameras
- Marketing matrix diagram - Competitive strategies
- Marketing matrix diagram - Porters value chain
- Marketing mindmap - Marketing research project
- Marketing mind map - Strategic accomplishment mapping
- Twitter Compaign for New Software Product
- Marketing mind map - Sales Call
TEN RELATED HOW TO's:
The intuitive interface of ConceptDraw MINDMAP and the Functional Tools overview below will guide you in creating and demonstrating powerful mind map presentations using template.
An advanced tool allows you effectively generate, change, and update your presentation.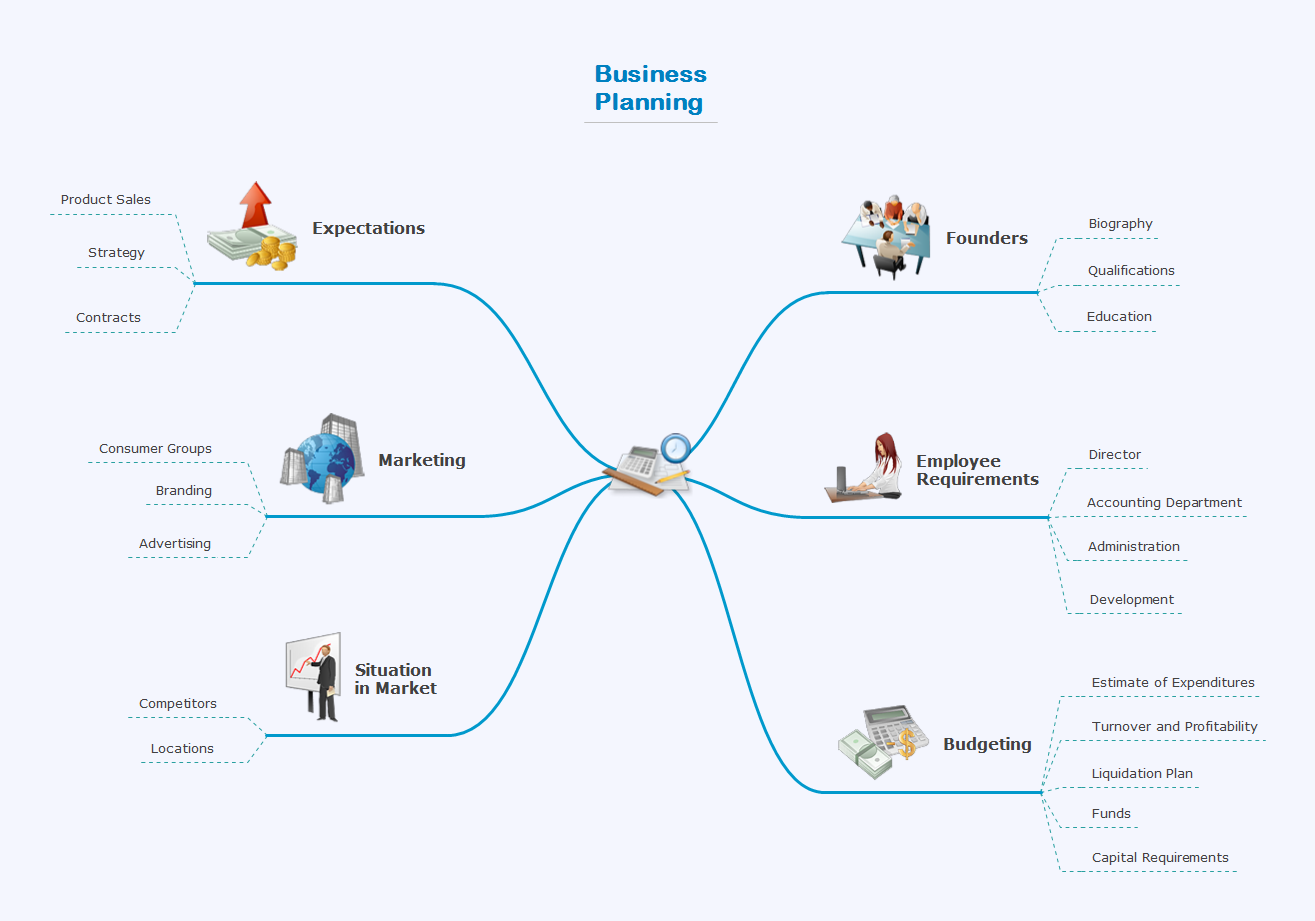
Picture: Create a Presentation Using a Design Template
Related Solution:
Use diagrams and infographics designed in ConceptDraw DIAGRAM to explain efficiently ✔️ basics of the baseball game, ✔️ rules, ✔️ positions, ✔️ strategies, ✔️ defensive and offensive insights, ✔️ game situations
Picture:
Baseball Diagram
Baseball Field — Corner View — Sample
Related Solution:
ConceptDraw DIAGRAM extended with Matrices solution from the Marketing area of ConceptDraw Solution Park is the best Deployment Chart Software.
The Matrices solution offers you the useful tools for creating Deployment Charts in just minutes.
The Deployment Charts designed with ConceptDraw DIAGRAM are vector graphic documents and are available for reviewing, modifying, converting to a variety of formats (image, HTML, PDF file, MS PowerPoint Presentation, Adobe Flash or MS Visio XML), printing and send via e-mail in one moment.
Picture: Deployment Chart Software
Related Solution:
Fishbone Diagram, also referred as Cause and Effect diagram or Ishikawa diagram, is a fault finding and problem solving tool. Construction of Ishikawa diagrams is quite complicated process and has a number of features.
Fishbone Diagrams solution included to ConceptDraw Solution Park contains powerful drawing tools and a lot of examples, samples and templates. Each Fishbone diagram example is carefully thought-out by experts and is perfect source of inspiration for you.
Picture: Fishbone Diagram Example
Related Solution:
Wireless Networks solution from ConceptDraw Solution Park extends ConceptDraw DIAGRAM to help network engineers and designers efficiently illustrate wireless network mode diagrams.
Picture: Wireless Network Mode
Related Solution:
Target Diagram is a convenient and visual way of presentation information which is popular and widely used in marketing, business and economics. ConceptDraw DIAGRAM diagramming and vector drawing software extended with Target and Circular Diagrams solution from the Marketing area of ConceptDraw Solution Park is ideal for fast and easy drawing a Target Diagram.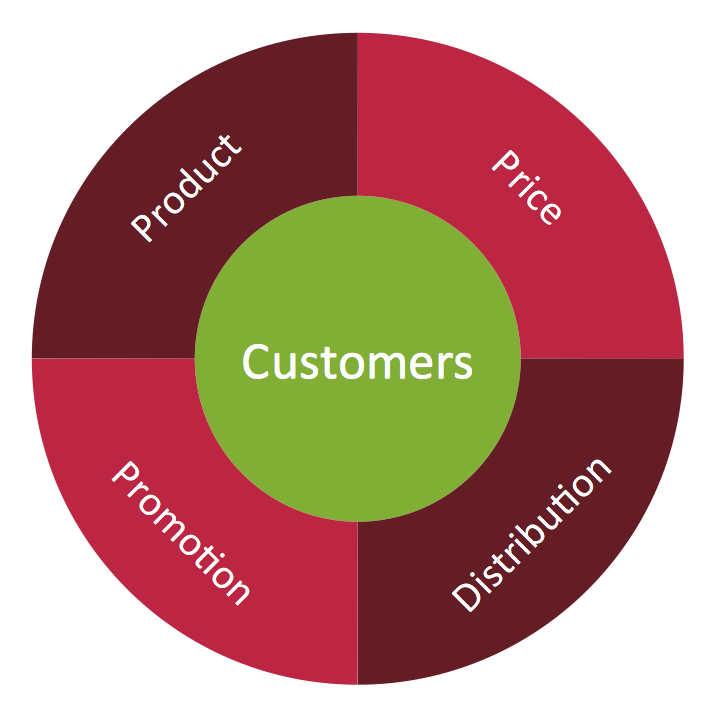
Picture: Target Diagram
Related Solution:
You need create a Sales Process Map? Use the ConceptDraw DIAGRAM software which is ideal for the sales process management, marketing and engineering thanks to the powerful Sales Flowcharts solution from the Marketing area of ConceptDraw Solution Park.
Picture: Sales Process Map
Related Solution:
Use ConceptDraw MINDMAP for creative thinking, planning, organization, problem solving, presentations, decision making, note taking, team brainstorming and other tasks.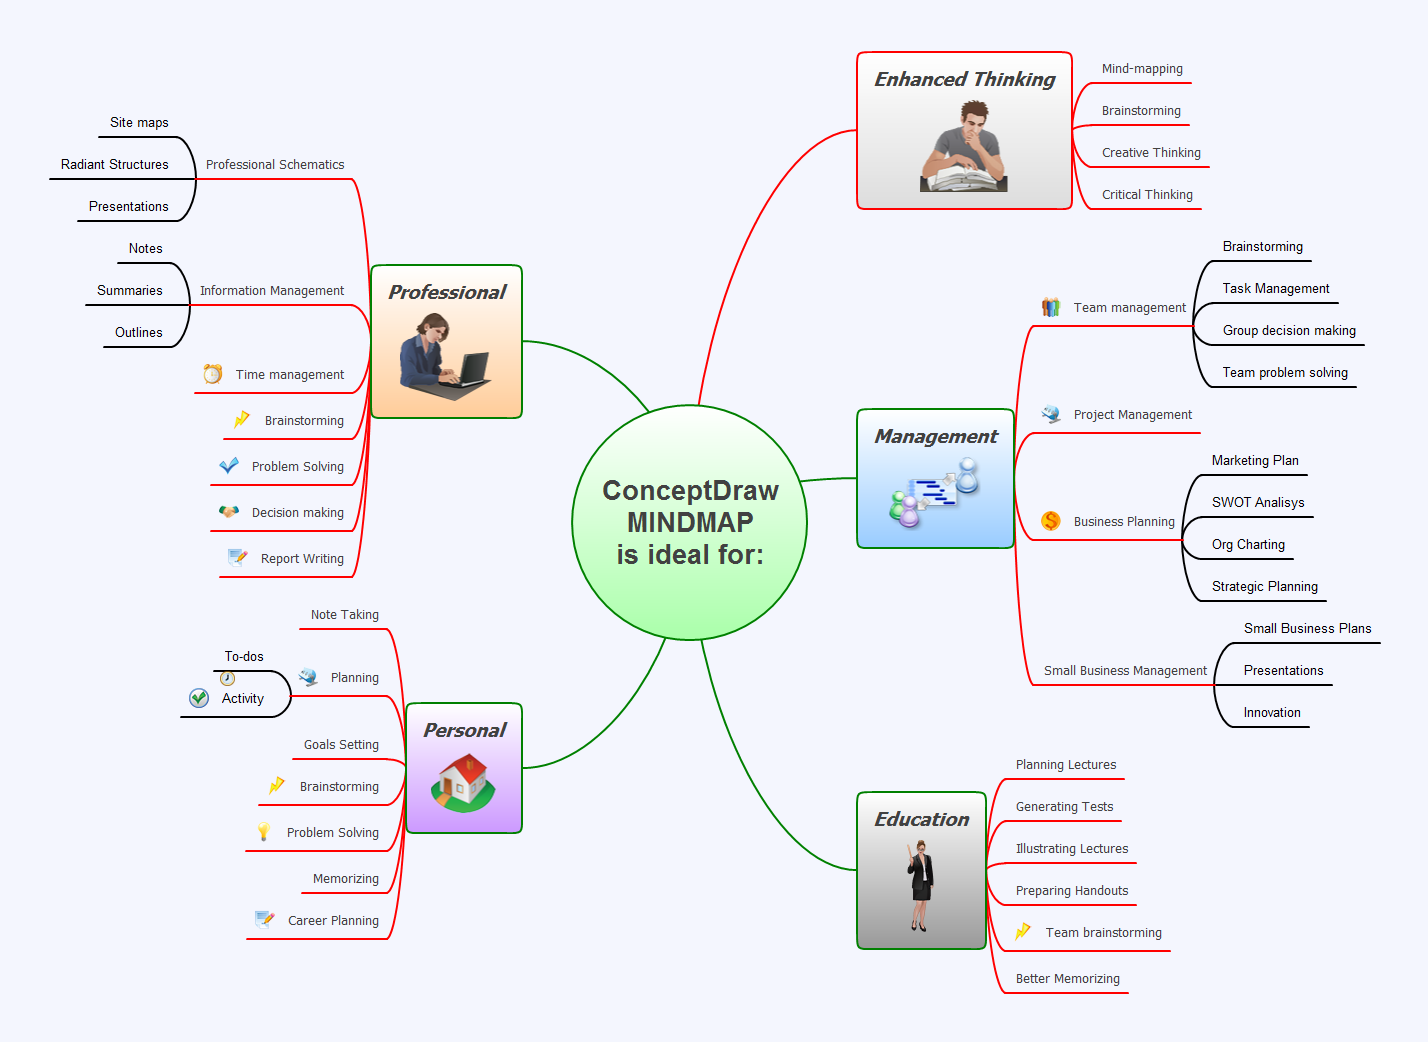
Picture: Applications
When talking about engineering, one should define all the terms used, so anybody could understand the topic. Typical network glossary contains definitions of numerous network appliances, types of networks and cable systems. The understanding of basic is crucial for server management, network administration and investigating problems.
The network glossary defines terms related to networking and communications. The most of glossary items has their visual representation in ConceptDraw DIAGRAM libraries of the Computer Network Diagrams solution. This illustration presents a local area network (LAN) diagram. It designed to show the way the interaction of network devices in a local network. The diagram uses a library containing symbols of network equipment, connections and the end-point devices such as network printer, hubs, server, modem and finally computers (PC, mac, laptop). This diagram depicts a physical LAN topology.
Picture: Network Glossary Definition
Related Solution:
ConceptDraw MINDMAP with the ability to import presentations from Microsoft PowerPoint, as well as enhancing its existing presentation capabilities.
Picture: Best Mind Mapping Program for Making Presentations
Related Solution:
ConceptDraw
DIAGRAM 18