SysML Diagram
Systems Modeling Language (SysML) Diagrams
ConceptDraw DIAGRAM software is the one developed for the purpose of providing its users, who may be the systems engineers as well as other specialists, a chance to use the already previously created design elements for designing the various model systems with SysML, or simply Systems Modelling Language. The mentioned modelling language is usually used by the systems engineering for creating different applications. It supports analysis, specification, validation, verification as well as the design of the different systems, including the so called “systems-of-systems”.
Systems Modelling Language can be defined as an extension of a subset of the UML, or “Unified Modelling Language”. It uses the Systems Modelling Language’s profile mechanism, allowing all the systems engineers to use a few improvements over Unified Modelling Language, including the SysML's semantics. How it works: the SysML reduces the UML's software restrictions adding two new diagram types: the requirement diagrams and the parametric diagrams. It can model many different systems, including information, hardware, software, facilities, personnel, processes, etc.
The mentioned language is a comparatively small. This fact makes it easier to learn it and to apply it. SysML re-uses seven out of fourteen UML 2's diagrams, adding two more already previously mentioned diagrams – the parametric and the requirement ones. The parametric diagrams are usually used within “SysML” for defining all the quantitative constraints as well as the performance itself. There is no straightforward mechanism for capturing this sort of the quantitative information or the essential performance. Considering the rest of the automotive system, the “state machine” and the activity diagrams can be both used for specifying the information flows for the automotive computers and the embedded software control logic.
You can always use both the behavioural and the structural diagrams to model the factories for building the automobiles and the interfaces between different companies. Despite the fact that SysML is quite a simple language, it is still not as simple to learn, especially for those who do not know any other language. This conventional language is used for conducting the “model-based systems” in such field of the business activity, such as engineering. Nevertheless, there are a few limitations reducing its efficiency as well as its acceptance. But, never mind, the Systems Modelling Language is a well-known “hermetic” language and it may be quite difficult to learn it straight away.
Although, knowing this extension of UML, you can always create any of the existing nine types of SysML diagrams, such as “Block Definition”, “Activity”, “Internal Block” diagram, “Parametric”, “Package”, “Requirement”, “State Machine”, “Use Case” or “Sequence” one, some of which can be created in a way of the extending the intended use of block definition diagrams with help of ConceptDraw DIAGRAM as well as ConceptDraw STORE applications developed by CS Odessa. The mentioned language is known to be improving nowadays becoming more and more convenient and progressive enabling its users to create more other types of the diagrams in the future, as all the diagrams generated by “SysML” are known to be quite complicated including some of the elements being slightly counter-intuitive, leading to both confusion and errors.
All the diagrams, created within the system by the IT engineers can be accessed by only those who are some kind of the system engineers, because all of the other users are known to be unlikely knowing “SysML” that well to use it on the everyday basis.
All the SysML diagrams you can create with help of ConceptDraw DIAGRAM taking into consideration the SysML rules usually include the so called “redundant pieces” of all the model information, which leads to the impairing their interpretations. You can always use any of the existing modelling tool vendors offered by the SysML support and, of course, you can always use the progressive software, such as ConceptDraw DIAGRAM to simplify your work with drawing the mentioned diagrams getting the final great looking result within a short period of time.
Rapid UML Solution developed by the CS Odessa team especially for the ConceptDraw DIAGRAM users provides 13 libraries including 393 pre-designed vector objects, such as icons, for allowing all the ConceptDraw DIAGRAM users to draw the SysML diagrams. Making any of the existing “SysML diagrams”, you can simply create a new document while working in ConceptDraw DIAGRAM application, to choose the needed design objects from any of the available stencil libraries and so after to simply drag them to the needed place within your freshly created ConceptDraw DIAGRAM document.

Example 1. Rapid UML Solution
The “Rapid UML solution” from ConceptDraw STORE can be downloaded any time from the mentioned application to be very useful as it offers a large collection of the previously designed professional SysML diagrams, apart from the mentioned design symbols. Each of the mentioned templates can be a perfect base for your own SysML diagrams as they can be always used as drafts, simply edited the way you want them to be. The samples you can see in the described solution all were created by the IT specialists of CS Odessa, those who developed ConceptDraw DIAGRAM software itself.

Example 2. SYS ML Diagram — Taxonomy
Having Rapid UML Solution downloaded from ConceptDraw STORE can enable you to make any needed UML Class diagram, as well as any other UML diagram, having the pre-made representations of the Class, Interface, Template Class, Component, Objects, Self association, Package, Frame, fragment and Note, as well as other graphic symbols.
ConceptDraw DIAGRAM is a perfect tool for:
- Designing and planning tasks such as:
- Developing Visualization Solutions
- Project Planning (Gantt Charts, Timelines, Project Schedules)
TEN RELATED HOW TO's:
Network Topology in communication networks, a topology is a usually schematic description of the arrangement of a network, including its nodes and connecting lines. There are two ways of defining network geometry: the physical topology and the logical topology.
Network Topology Mapper offers extensive drawing tools professional-looking network diagrams quickly and easily allowing you to clearly represent and communicate network architecture, topology, and design to engineers, stakeholders and end-users.
Picture: Network Topology Mapper
Related Solution:
The Critical Path Method (CPM) is an algorithm for scheduling a set of project activities. It is an important tool for effective project management. ConceptDraw PROJECT implements this method to provide the user with a wide set of project management tools.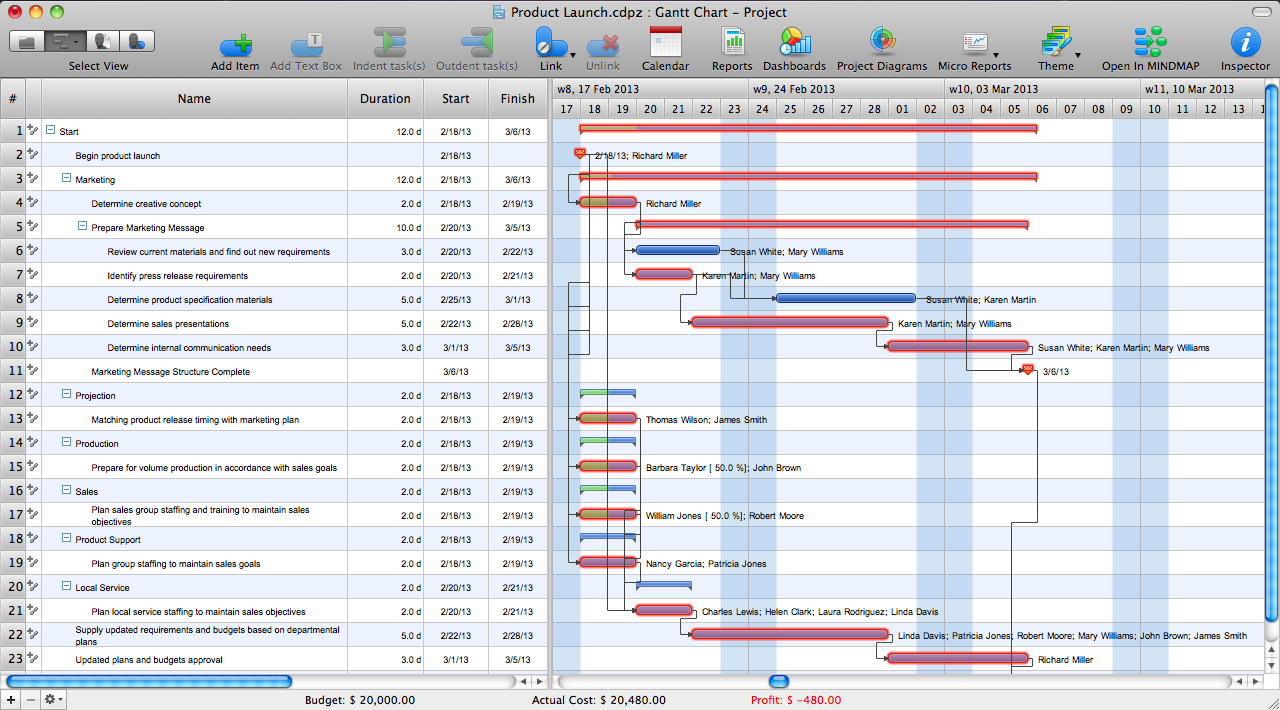
Picture: Critical Path Method in ConceptDraw PROJECT
Related Solution:
As restaurant industry is growing rapidly nowadays, researches show that almost half of the adults have worked in a restaurant or a cafe. Moreover, many of them dream to start their own someday. Unfortunately, it takes a lot of time to write a business plan and to find a great location, although some know how to create a restaurant floor plan in minutes or how to plan budget effortlessly. Hiring employees can also cause a lot of headache, but this is crucial for further success, because every guest comes to restaurant for a good service and delicious food. It is also worth noting that restaurant concept is also important, because it defines target audience and influences the menu.
This diagram represents the floor plan of an ongoing sports-theme establishment - restaurant, cafe, or other food service. A number of widescreen monitors installed along the perimeter provide visitors the opportunity to follow the course of a match from anywhere in the dining room of restaurant or cafe. The most of sports fans believe that food and alcohol is a big part of any sports show. That is why the dining room takes the most space - almost 60% of the total establishment space. Nearly all sports fans consume beverages while watching sports - beer, soda or water at least. Thus, the restaurant floor plan designers added a large lavatory there. Moreover, project developers considered unnecessary the gender division of such delicate place - perhaps they guess that only men are watching football, or believe that alcohol will eliminate the most of gender differences.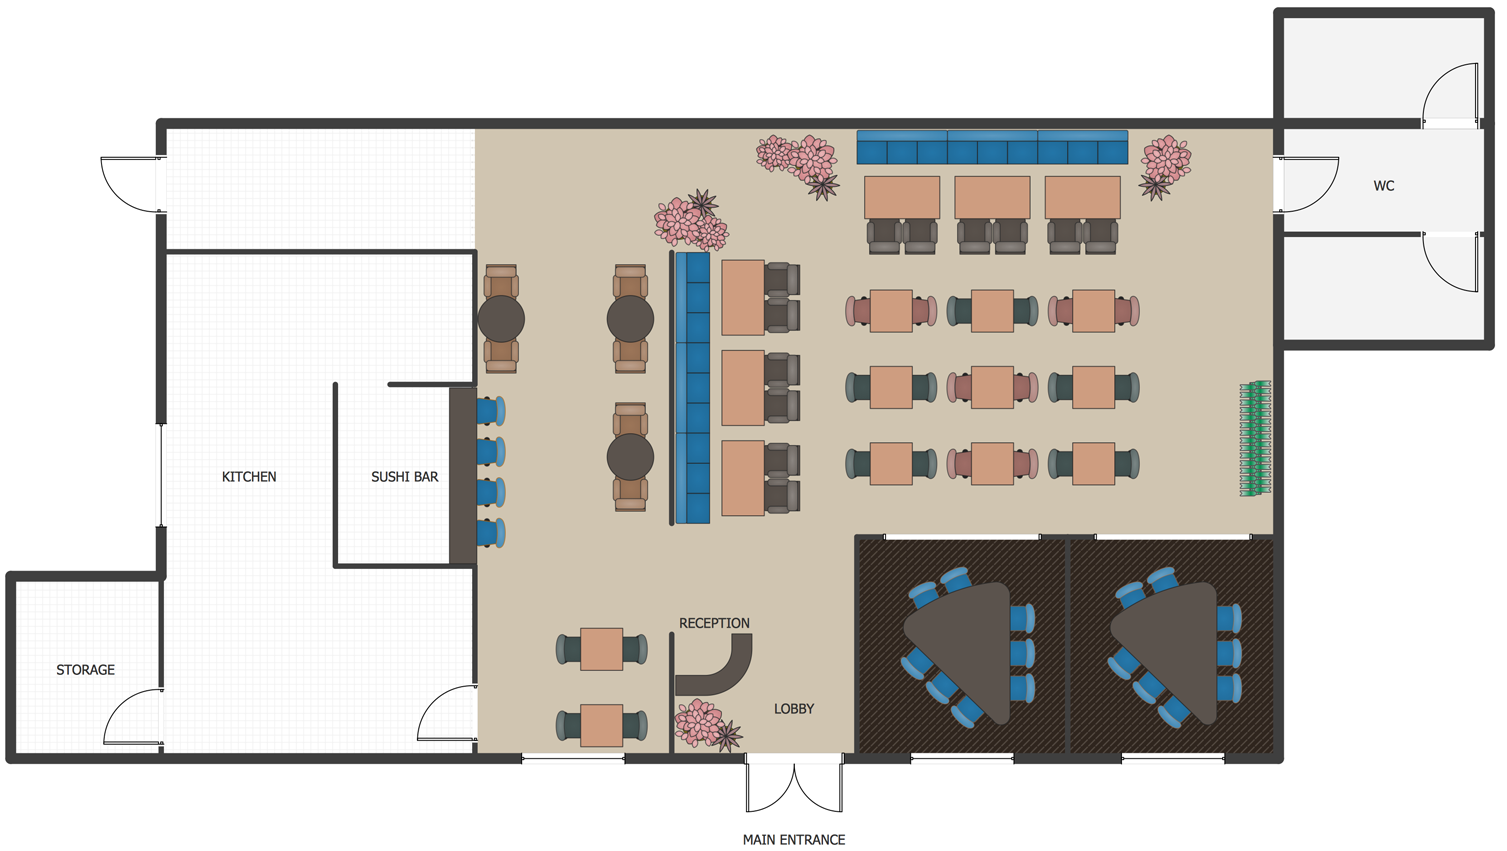
Picture: How To Create Restaurant Floor Plan in Minutes
Related Solution:
ConceptDraw DIAGRAM is workflow diagram software enhanced by numerous extentions from ConceptDraw Solution Park. It inludes many professional workflow diagrams, examples and ready to use workflow diagram and workflow symbols. Workflow symbol collections include symbols for Processes, Planning, Scheduling, Flow Control, In-Transit Process Visibility.
The best workflow diagram software you may find is ConceptDraw DIAGRAM. ConceptDraw DIAGRAM is world-known diagramming software that works for both Windows and Mac OS X platforms. The software contains complete set of features allows to draw diagrams faster. ConceptDraw DIAGRAM extended with the Workflow Diagram solution provides additional libraries, templates and samples for drawing professional workflow diagrams.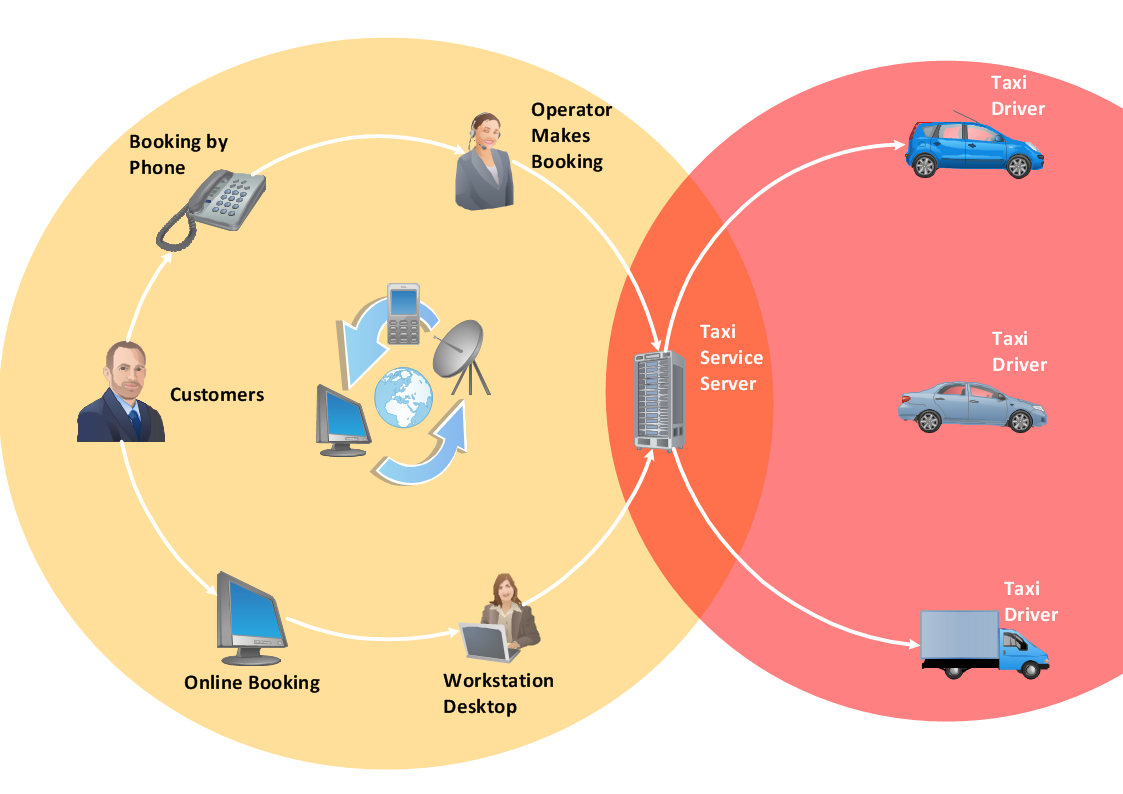
Picture: Workflow Diagram Software
Related Solution:
This sample shows the Flowchart that displays the solid-state welding processes, the types of welding.
Picture: Types of Welding in Flowchart
Related Solution:
Data processing can be very complex sometimes. If you are interested in facilitating your work with data, it’s time to learn how to draw flowcharts with special software or using just a piece of paper. The list of flowchart basic symbols includes rectangles, diamond, ellipses etc. and is used to represent processes, actions, decisions or data processing.
A well-done flowchart bring the clearness of the sequence of a process stages. There are number of symbols that can be used in flow charts to show various sorts of steps. The basic flowchart can be created using a few of them: Process, Decision, Start/Finish. A basic element of a flowchart represents a simple action and looks like a box, that contains a description of the action. The depicting of actions sequence is made with arrows between corresponding action boxes, as you can see on the sample diagram. Also it shows the symbols for flowchart start and finish steps. ConceptDraw Flowcharts solution provides the ability to build basic flow charts as well as the ones of any size and complexity with a minimum of actions.
Picture: How to Draw a Flowchart: Step-by-Step Guide
Related Solution:
This sample shows the Flowchart that displays the layout and work flow of the cloud marketing platform. This diagram has a style of the marketing brochure. This style displays the central product that is related to the other issues.
Using the ready-to-use predesigned objects, samples and templates from the Flowcharts Solution for ConceptDraw DIAGRAM you can create your own professional looking Flowchart Diagrams quick and easy.
Picture: Flowchart Marketing Process. Flowchart Examples
Related Solution:
ConceptDraw DIAGRAM software is the best Mac software for drawing workflow diagrams. Its rich set of samples and templates, and specific features to draw diagrams faster make this software as comfortable as possible for drawing workflow diagrams.
Use the ConceptDraw DIAGRAM professional Mac OS X software for drawing workflow diagram. The Workflow Diagrams solution with its libraries and templates set make the possibility to identify resources that are required for work goal implementation. The process flow diagram identify flow which occurs as network of process dependencies, organizational decisions and interactions between departments. Usually workflow diagrams show business participants actions that carry product or service to the final destination, the consumer.
Picture: Workflow Diagram Software Mac
Related Solution:
ConceptDraw DIAGRAM extended with Sales Dashboard solution from the Marketing area of ConceptDraw Solution Park is a perfect software for creating the live dashboard for the business data and progress visualization.
Picture: Dashboard
Related Solution:
Nowdays business people’s figures are most favourite vector illustrations among presenters and designers. It is easy to make them and use, but they can make your graphics look really good looking & eye catching.
Just check ConceptDraw business perople figusers pictures, you will see all kinds of silhouetes: Staff, Employed workers, Persons and Groups symbols.
Best popular vector pictures are: men, dancing people, business man.
Use human contours wise and it will help you to tell main idea of your design message.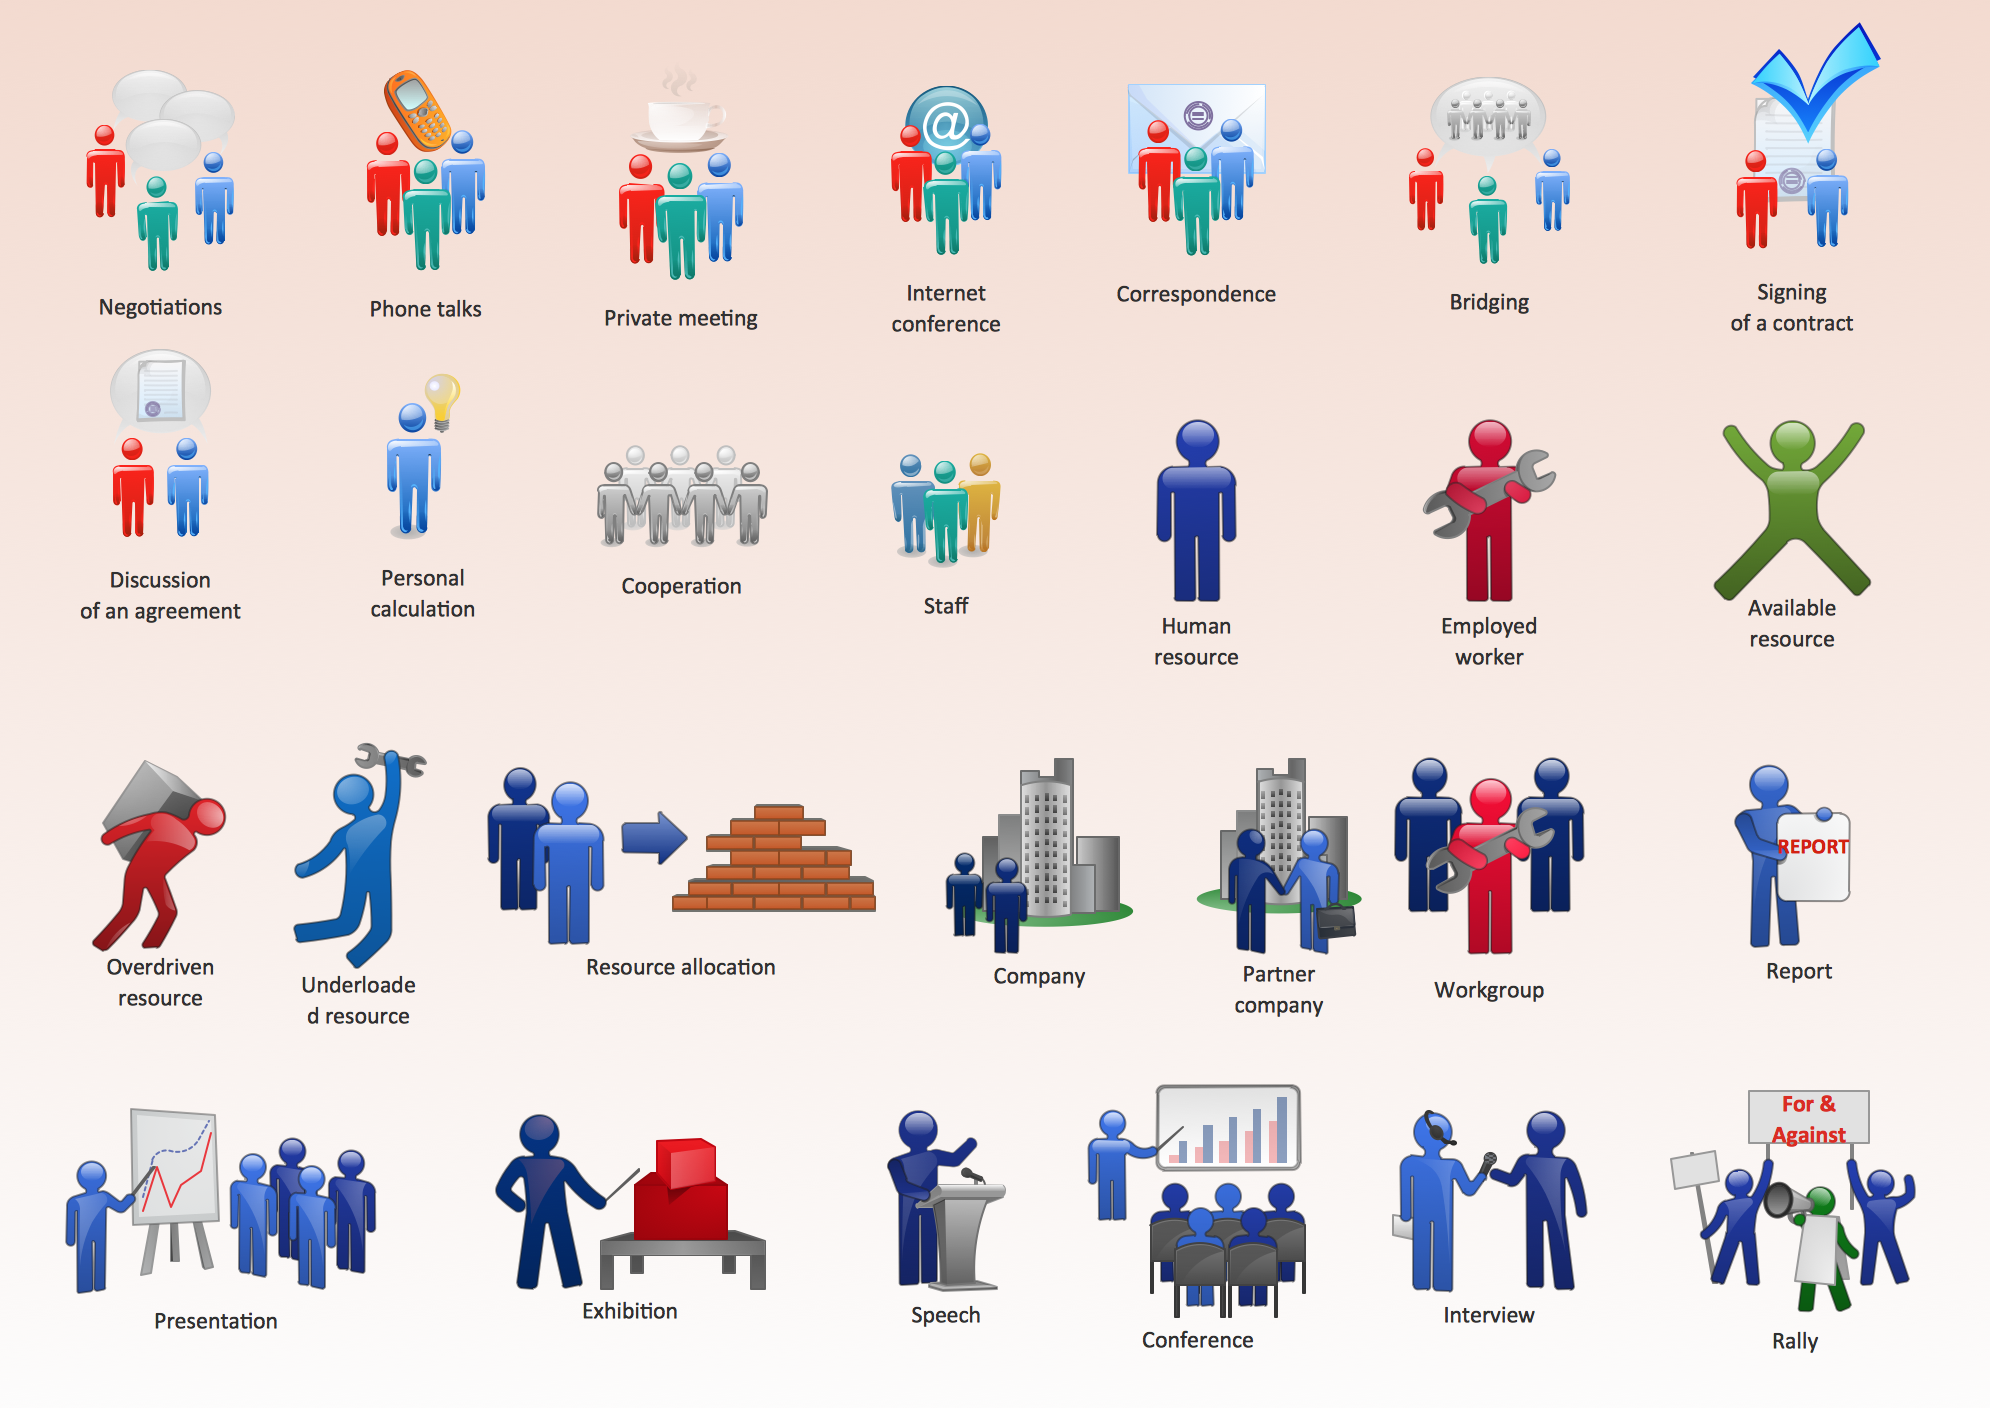
Picture: Business People Figures
Related Solution:
