The Facts and KPIs
Sales Dashboard Solution
The Sales Dashboard Solution gives users the ability to use live data to drive displays that show sales performance in a wide variety of graphs. ConceptDraw DIAGRAM is a software for making Live charts anв gauges that provide effectiveness to your business. By using dashboards one obtain benefits:
- Saves time compared to running multiple reports
- Align strategies and organizational goals
- Measure efficiencies/inefficiencies
- Ability to generate detailed reports
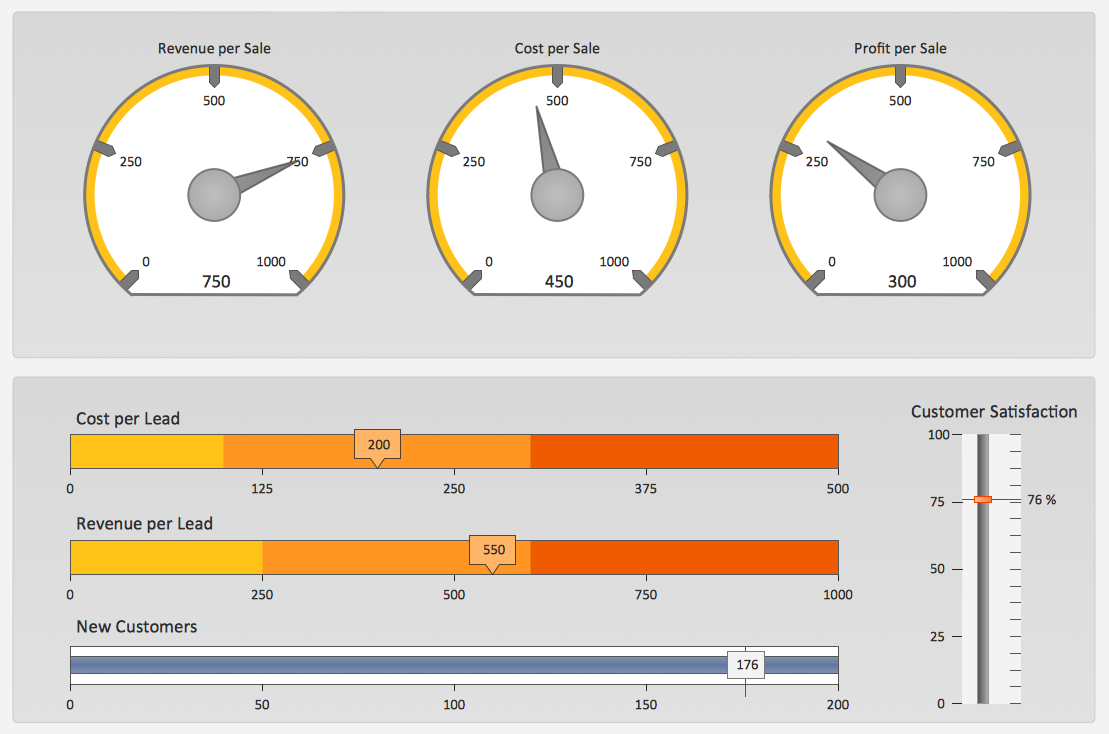
Pic. 1. Sales KPIs Dashboard Sample
FIVE RELATED HOW TO's:
The Social Media Response solution creates interactive social media flow charts and action mind maps. The solution includes a video tutorial and a number of samples helping social media teams refine and organize their response process.
Picture: How to Connect Social Media DFD Flowchart with Action Maps
Related Solution:
Users new to ConceptDraw PROJECT will find the Basic lessons an essential platform for familiarizing themselves with the program′s functions. Learn how to assign resources to tasks in ConceptDraw PROJECT with this comprehensive video lesson.
Picture: Project — Assigning Resources
Related Solutions:
Accounting flowchart is a system of processes to represent accounting system of an organization. If you need to know how accounting processes work and how each operation is done, the Accounting Flowcharts Solution for ConceptDraw DIAGRAM has a predesigned library, tips, methods and symbols for easy drawing an Accounting Flowchart.
Picture: Accounting Flowchart
Related Solution:
Acquaintance with flowcharting starts from getting into basic terms. First of all, flowchart definition is quite clear – a flowchart is a graphical representation of a process or an algorithm made of special symbols. Secondly, flowcharting is an irreplaceable tool for IT specialists, project managers, and anyone who wants a clear understanding of any imaginable process.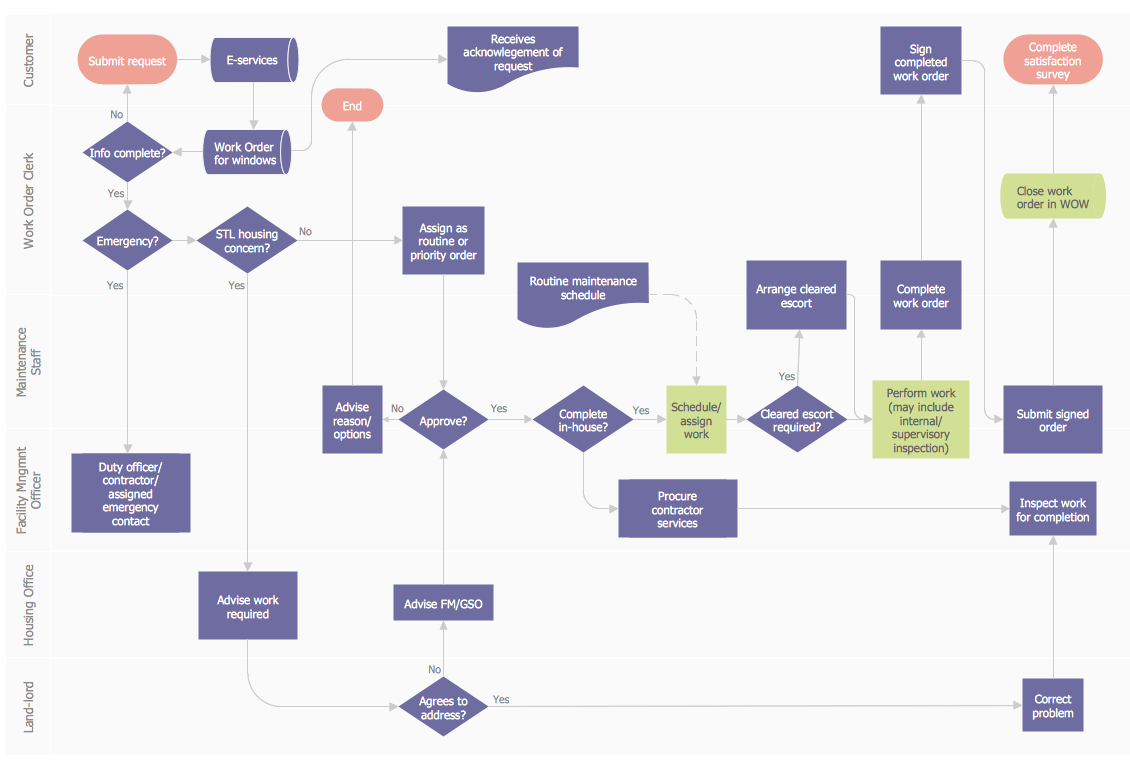
Picture: Flowchart Definition: A Complete Guide
Related Solution:
The Total Quality Management Diagram solution helps your organization visualize business and industrial processes. Create Total Quality Management diagrams for business process with ConceptDraw software.
Picture: Probability Quality Control Tools
Related Solution:
ConceptDraw
DIAGRAM 18