Pyramid Diagram
Three level pyramid model
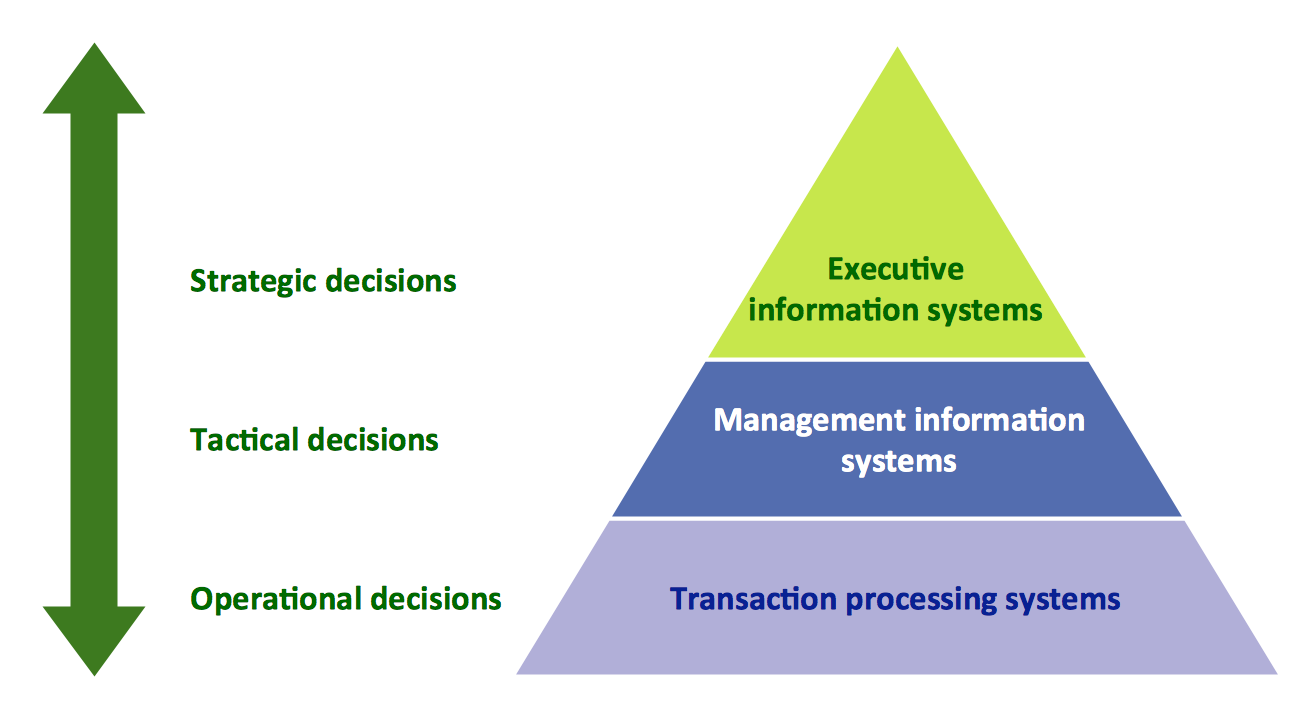
A three level pyramid model of different types of Information Systems based on the type of decisions taken at different levels in the organization.
The first level represents transaction processing systems focused on operational decisions.
The second level represents management information systems focused on tactical decisions.
The third level represents executive information systems focused on strategic decisions.
This triangle chart example is included in the Pyramid Diagrams solution from Marketing area of ConceptDraw Solution Park.

Example 1. Pyramid Diagrams Solution
This diagram was redesigned using ConceptDraw DIAGRAM diagramming and vector drawing software from Wikimedia Commons.
[commons.wikimedia.org/wiki/File:Three-Level-Pyramid-model.png]
Example 2. Pyramid Diagram. 3 level pyramid model of information systems types
This diagram was redesigned using ConceptDraw DIAGRAM diagramming and vector drawing software from Wikimedia Commons.
[commons.wikimedia.org/wiki/File:Three-Level-Pyramid-model.png]
See more Pyramid Diagram:
NINE RELATED HOW TO's:
Event-Driven Process chain Diagrams for improvement throughout an organisation. Best software for Process Flow Diagram. The Event-driven Process Chain (EPC) Diagrams allows managers to plan processes and resources.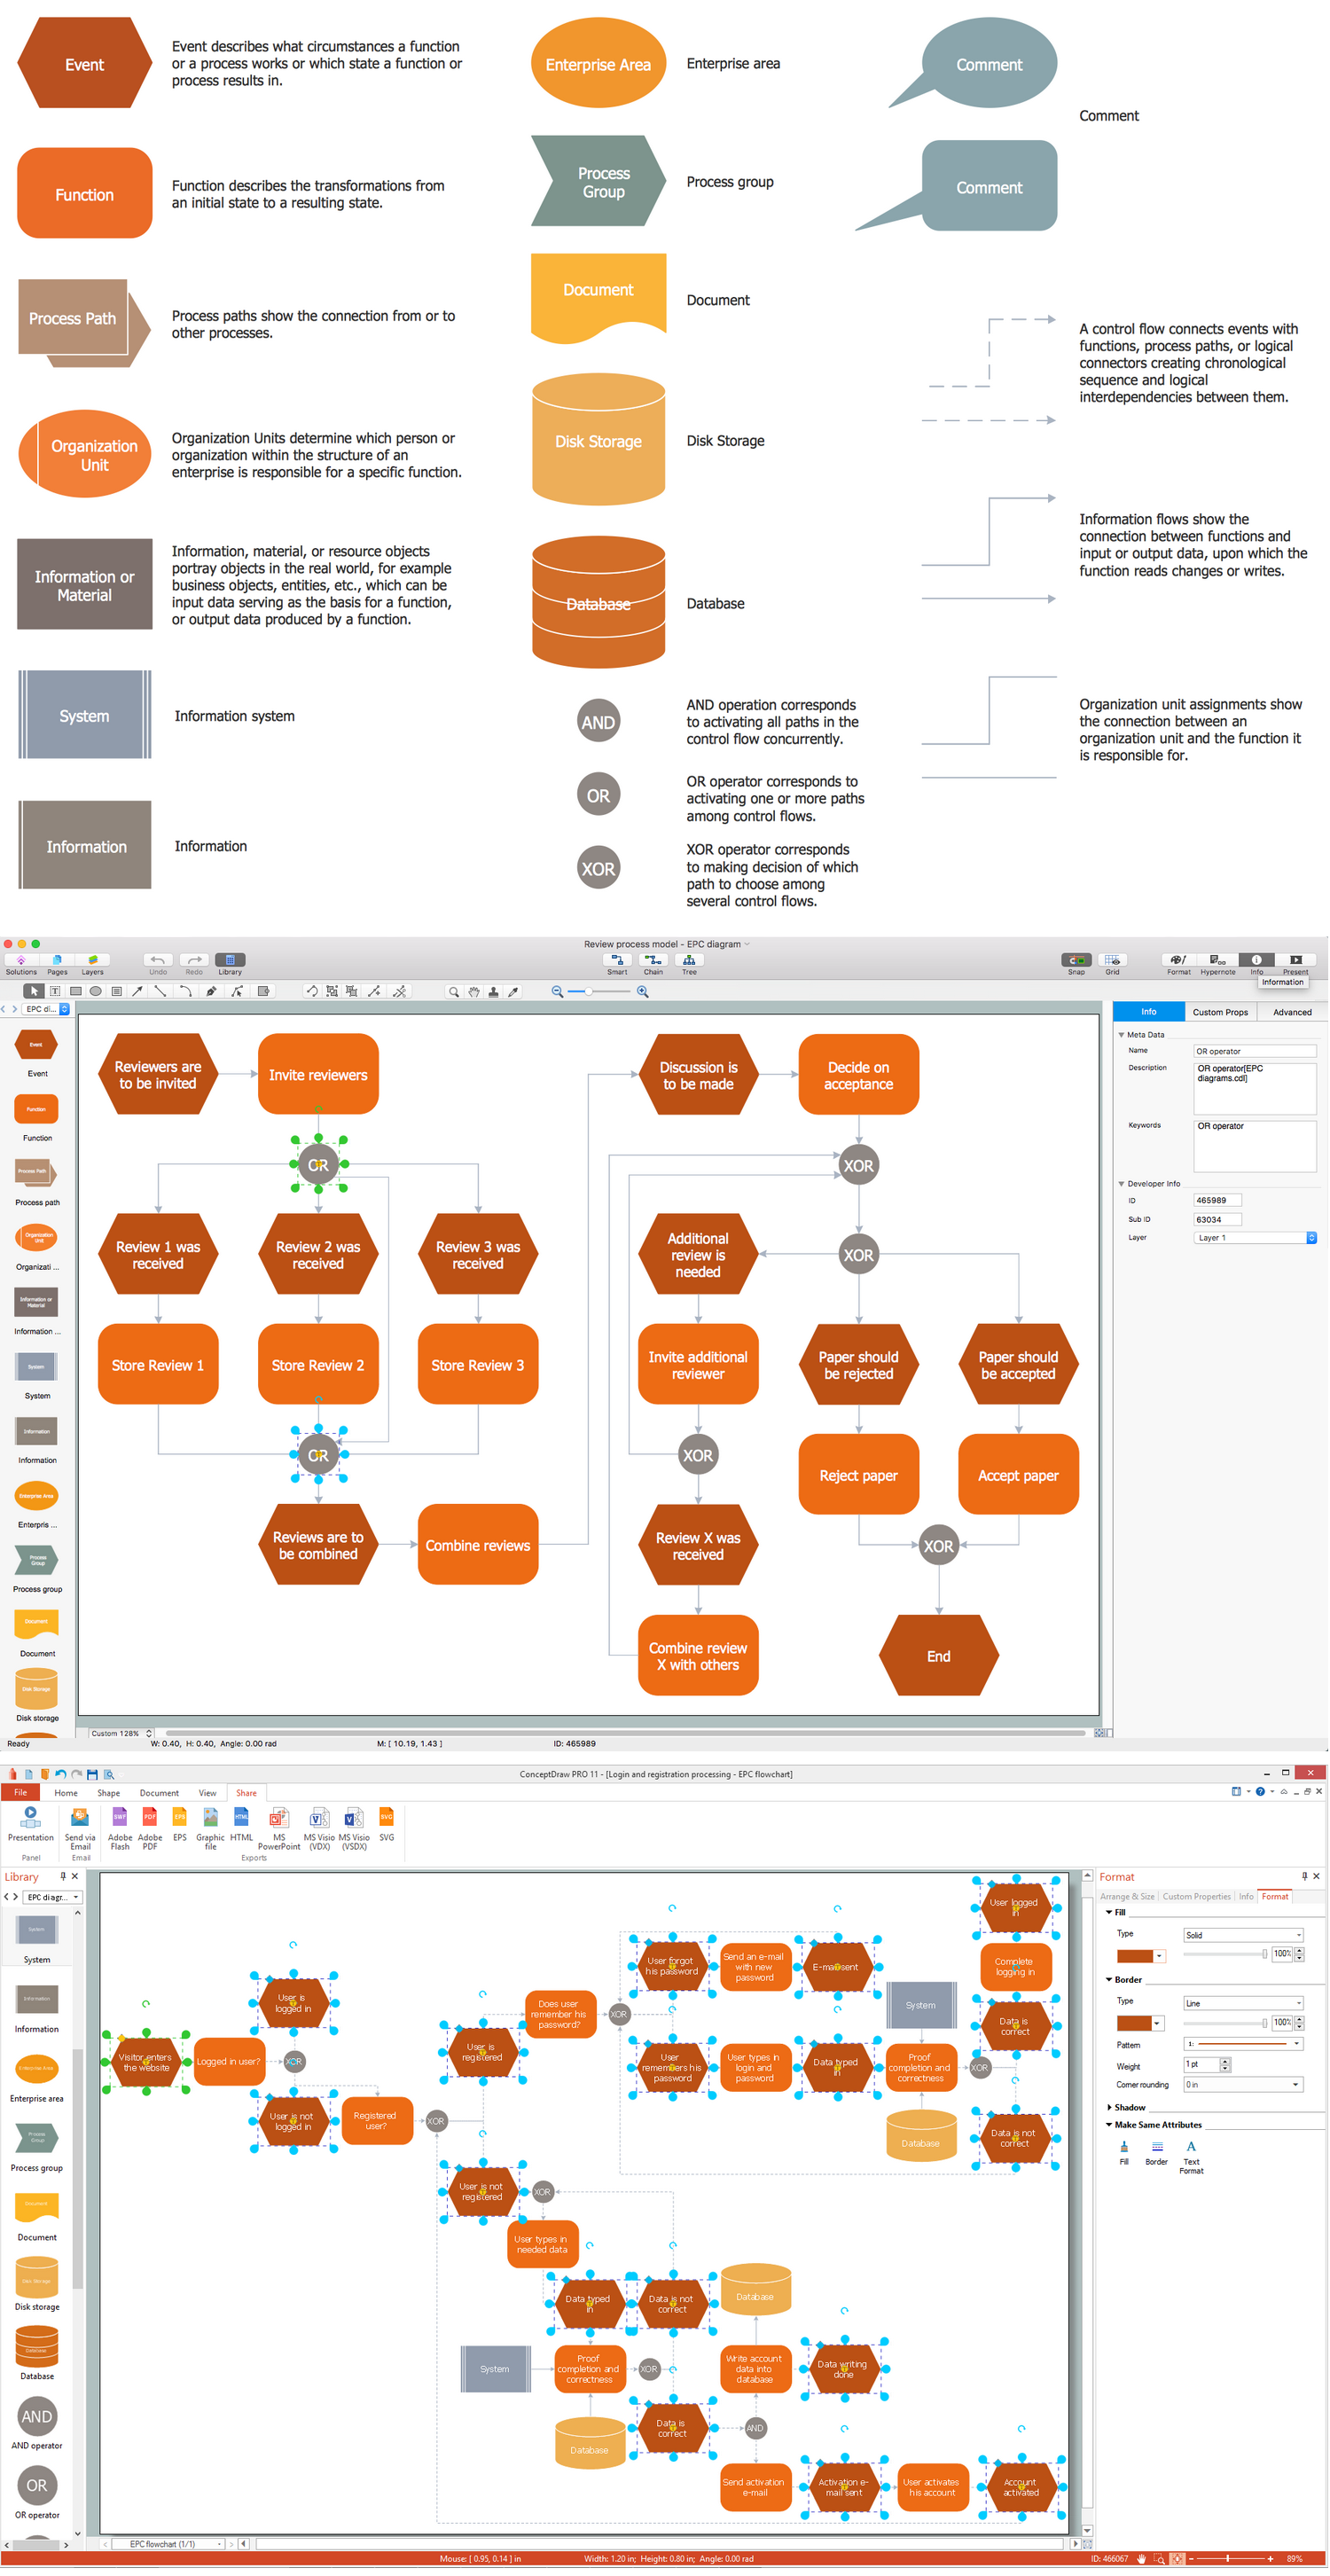
Picture: Business process Flow Chart — Event-Driven Process chain (EPC) diagrams
Related Solution:
The HR Management Software is an incredibly powerful tool for those who need to analyze or present human resource process flows in a visually effective manner.
Picture: HR Management Software
Related Solution:
This sample shows the Business Report Pie Chart. The Pie Chart visualizes the data as the proportional parts of a whole, illustrates the numerical proportion. Pie Charts are very useful in the business, statistics, analytics, mass media.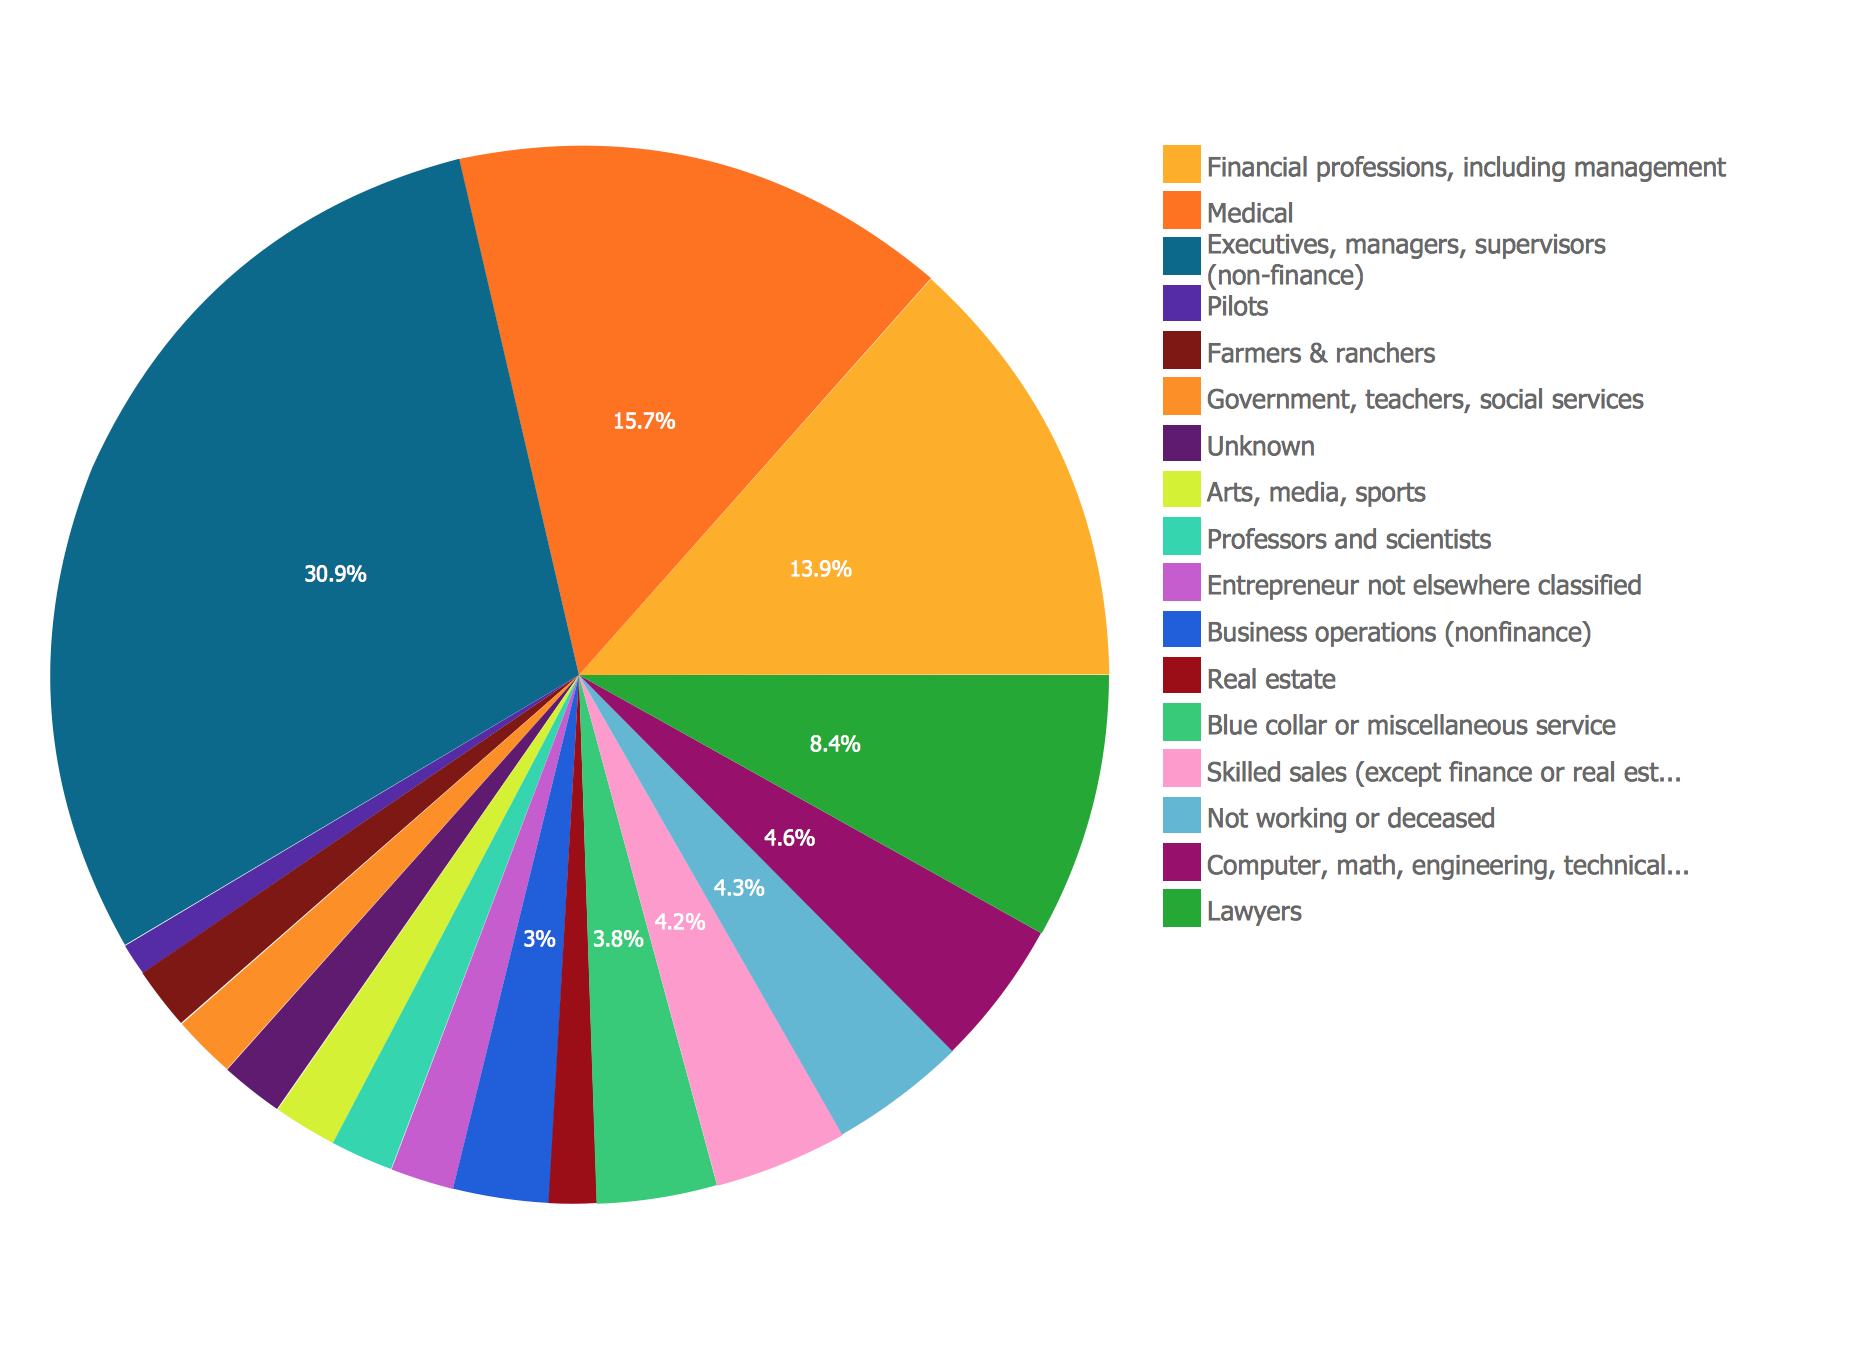
Picture: Business Report Pie. Pie Chart Examples
Related Solution:
Now we have the best flow chart maker online design software - ConceptDraw DIAGRAM enhanced with Flowcharts Solution.
Picture: Flow Chart Online
Related Solution:
Draw Company Structure Diagram - get the detailed information about the company structure and hierarchy - who execute what tasks and who is in charge at this company. This information shows the reasoning and success of business and is indispensable for investors and financial institutions.

Picture: Draw Company Structure with Organization Charting Software
Related Solution:
Workflow Diagram created by using special software based on graphic mastering technology Arrows10. Its automatics follows the global concept of business graphics and diagramming. The practical effectiveness of Arrows10 technology used in ConceptDraw DIAGRAM are around the quick auto-arrows behaving as expected and connecting boxes of workflow diagram from workflow symbol to process flow symbol.
ConceptDraw DIAGRAM is a workflow diagram software contains specific features help you to draw diagrams faster, such as RapidDraw, or Arrows10. There is also a rich set of samples and templates to give you an example of data may be visualized as workflow diagram.
Picture: Workflow Diagram Data
Related Solution:
Energy Pyramid Diagram is a visual graphical representation of the biomass productivity on the each trophic level in a given ecosystem. Its designing in ConceptDraw DIAGRAM will not take much time thanks to the unique Pyramid Diagrams solution from the Marketing area of ConceptDraw Solution Park.
Energy Pyramid Diagram begins from the producers (plants) and proceeds through a few trophic levels of consumers (herbivores which eat these plants, the carnivores which eat these herbivores, then carnivores which eat those carnivores, and so on) to the top of the food chain.
Picture: Energy Pyramid Diagram
Related Solution:
ConceptDraw DIAGRAM is a powerful diagramming and vector drawing software which offers the extensive drawing tools for creating various types of diagrams. Extended with Pyramid Diagrams Solution from the Marketing Area, it became the best Pyramid Chart Maker.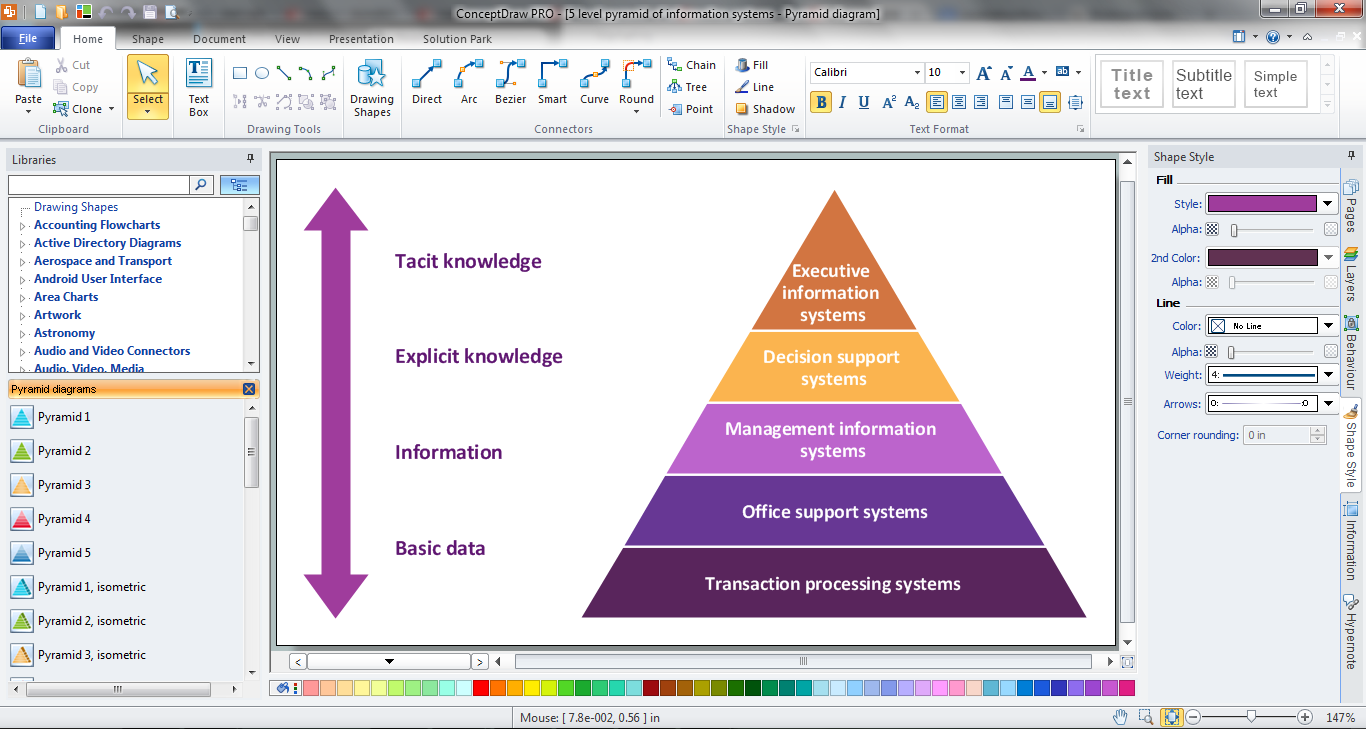
Picture: Pyramid Chart Maker
Related Solution:
Illustrate the Asia continent and explore its parts, geographical features, resources, and economic development through 🔸 designing various kinds of colorful Asia maps and using them in ✔️ presentations, ✔️ reports, ✔️ educational materials, ✔️ websites, ✔️ business documents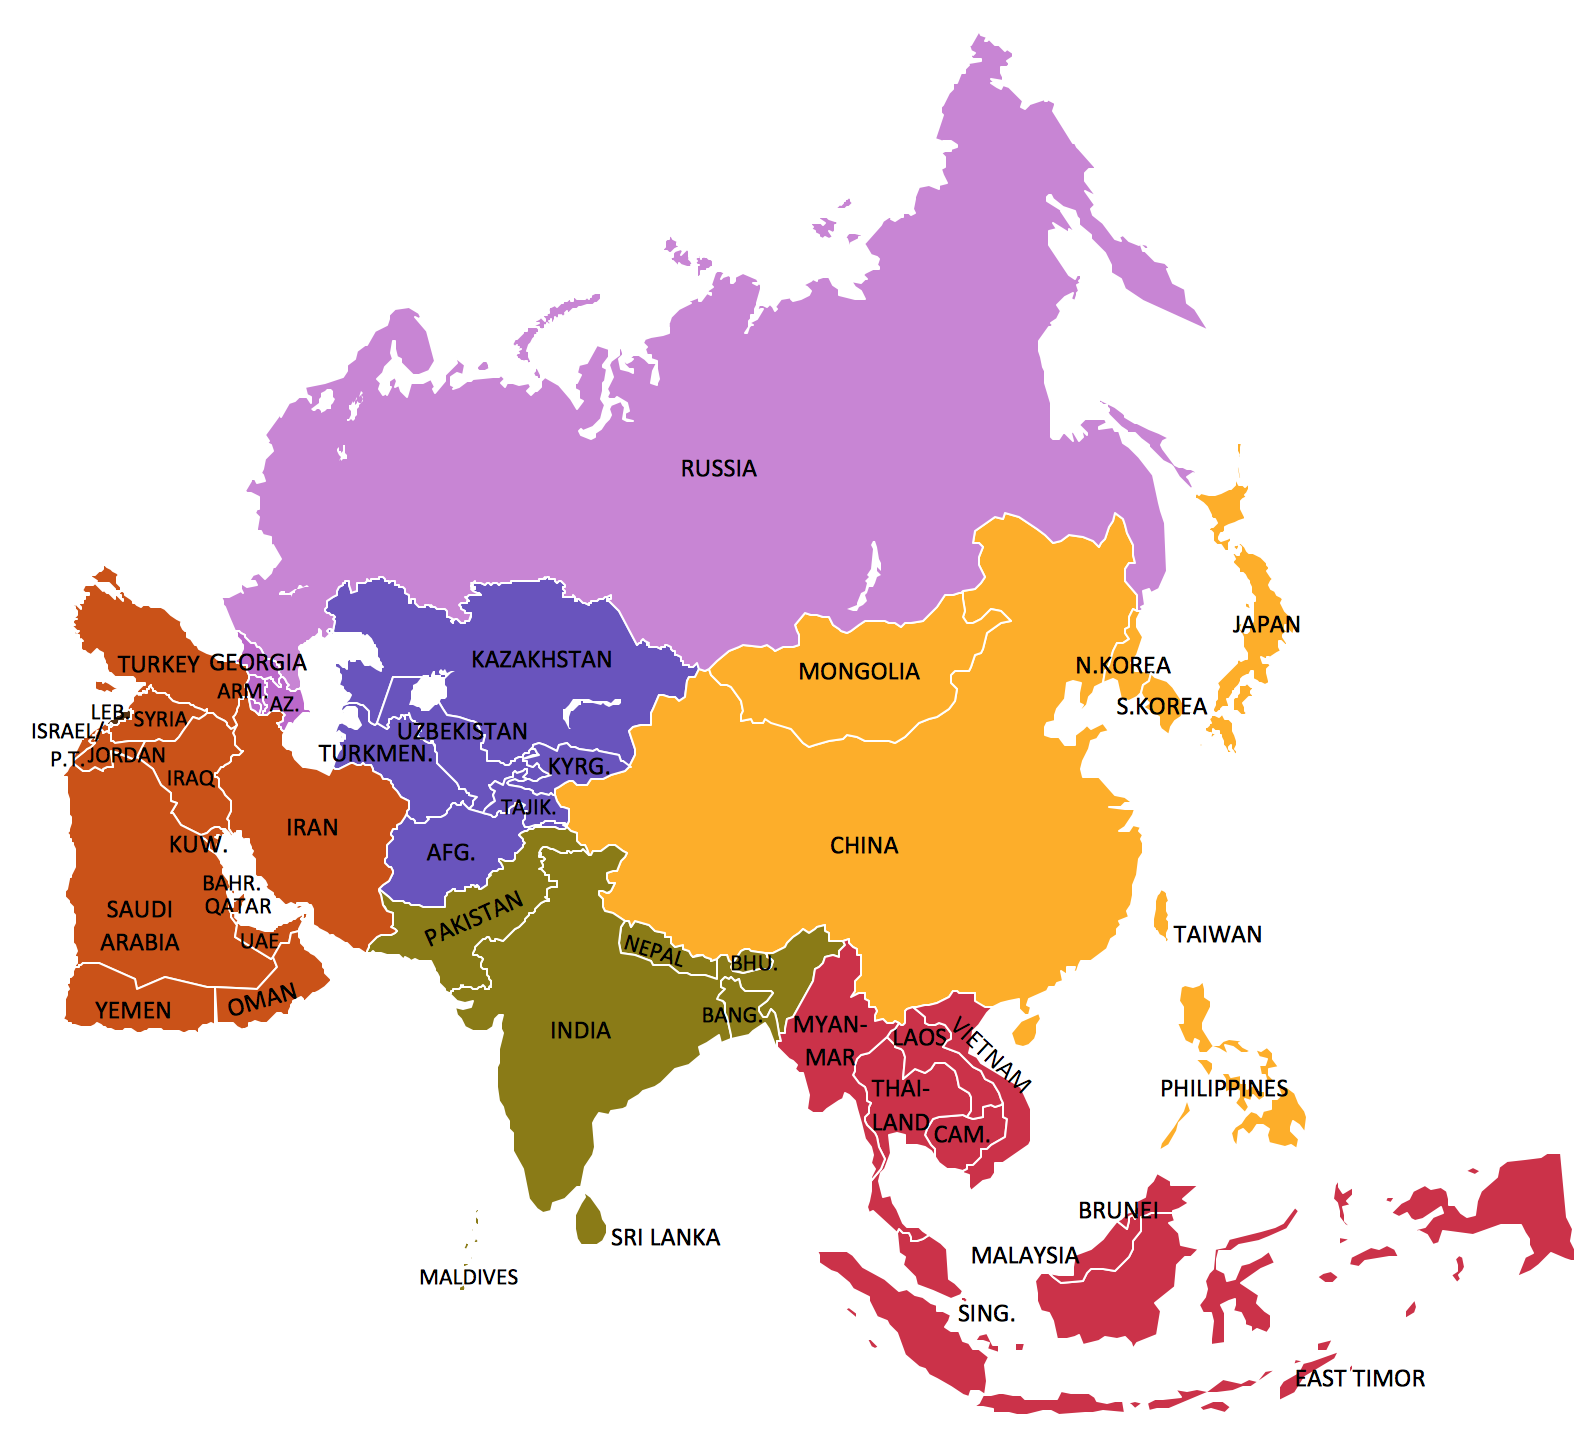
Picture: Geo Map — Asia
Related Solution:
