Tools for Creating Infographics and Visualizations
Infographics
ConceptDraw DIAGRAMis an Infographics software with more than 100 library objects of vector images and templates that simplifying creating the infographic illustrations. The Spatial Infographics solution is an additional tool for creating infographics and visualizations of numerical data. ConceptDraw DIAGRAM allows you to focus on work, not the drawing process.

Sample 1. Northern line extension to Battersea via Nine Elms - Spatial infographics.
Solution Spatial Infographics from ConceptDraw Solution Park extends ConceptDraw DIAGRAM ector diagramming and business graphics software with easy-to-use spatial infographics drawing tools.
This solution contains spatial infographics samples, map templates to be filled in, and libraries of vector stencils for main design elements of spatial infographics.
Use this solution to draw your own geospatial infographics documents with thematic maps, road maps, directional maps and transport maps.
See also Samples:
THREE RELATED HOW TO's:
Nowadays, any architect or landscape designer can't do without a pack of digital tools for designing and projecting. Thus, there will be no problem to develop any landscape architecture plan with ConceptDraw DIAGRAM , especially since there are so many ready-to use templates and examples included. It's just as easy as drawing sketches on paper.
If you using ConceptDarw DIAGRAM there is no needs to have a professional skills on landscape and garden design. As well as you don't need to be an expert in architectural charts and plans drawing. The all you need is the Landscape and Garden solution. This solution contains a unique collection of the professional designed vector objects depicting flower and grass, bushes and trees, garden furniture, pools and accessories. In one word - the full set of graphical elements enabling to focus on the creativeness while creating your landscape and garden plan.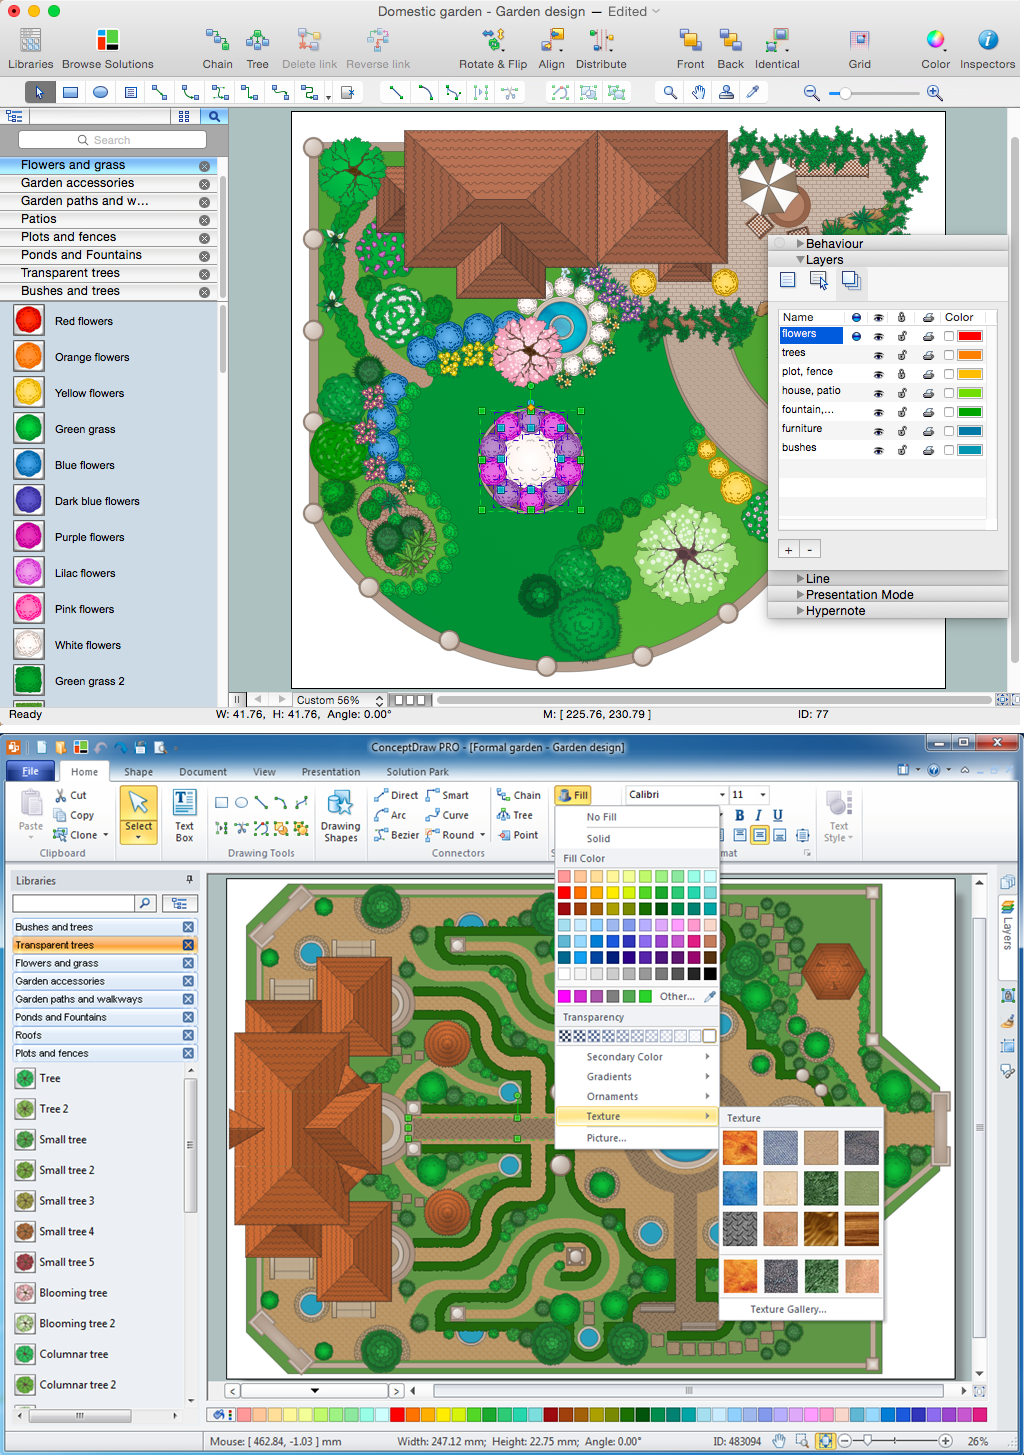
Picture: Landscape Architecture with ConceptDraw DIAGRAM
Related Solution:
Design of any premises includes many stages and variety of plans. Ceiling plans are also included in this number. Reflected Ceiling Plans Solution from the Building Plans Area for ConceptDraw DIAGRAM software will help you represent and realize any of your ceiling ideas for living room.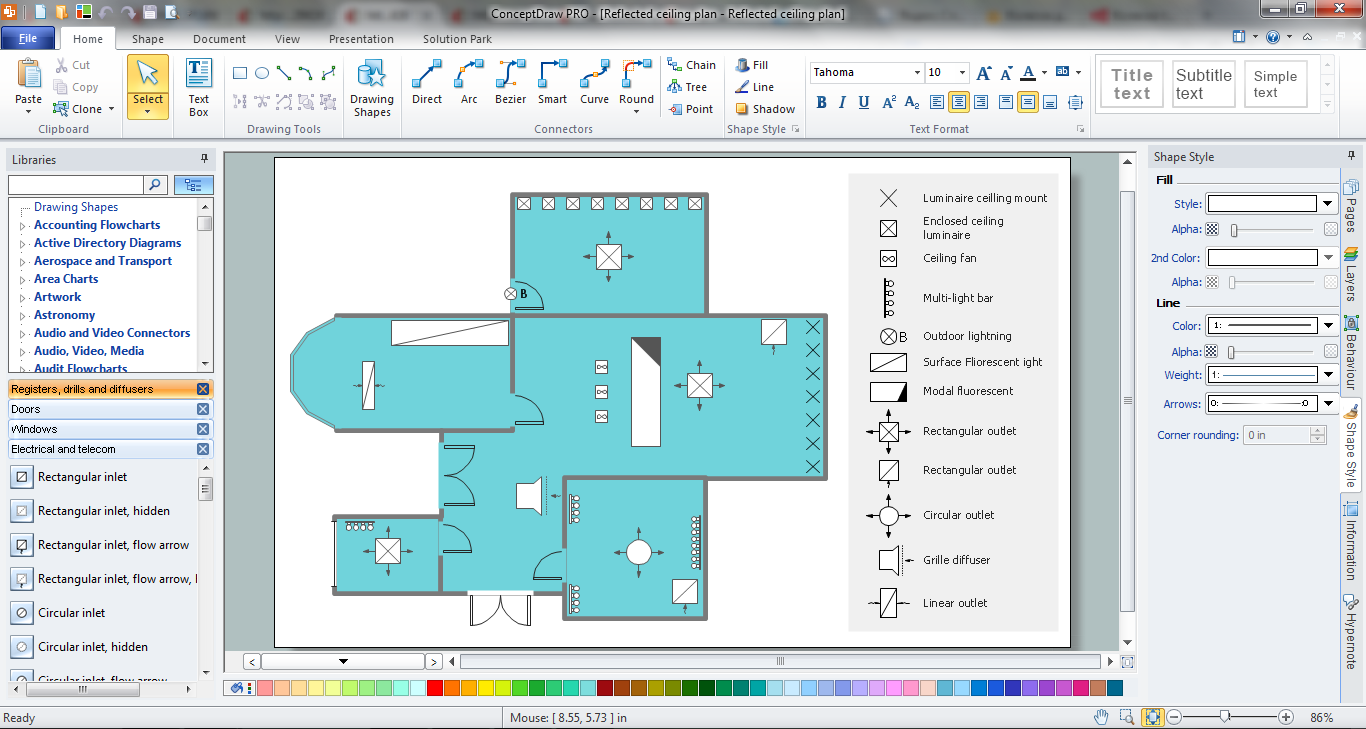
Picture: Ceiling Ideas For Living Room
Related Solution:
The Office Layout Plans Solution contains a large quantity of vector objects that will make your creating of the office design plans easy, quick and effective. It also provides templates and samples that will help you create the office designs of any difficulty in one moment.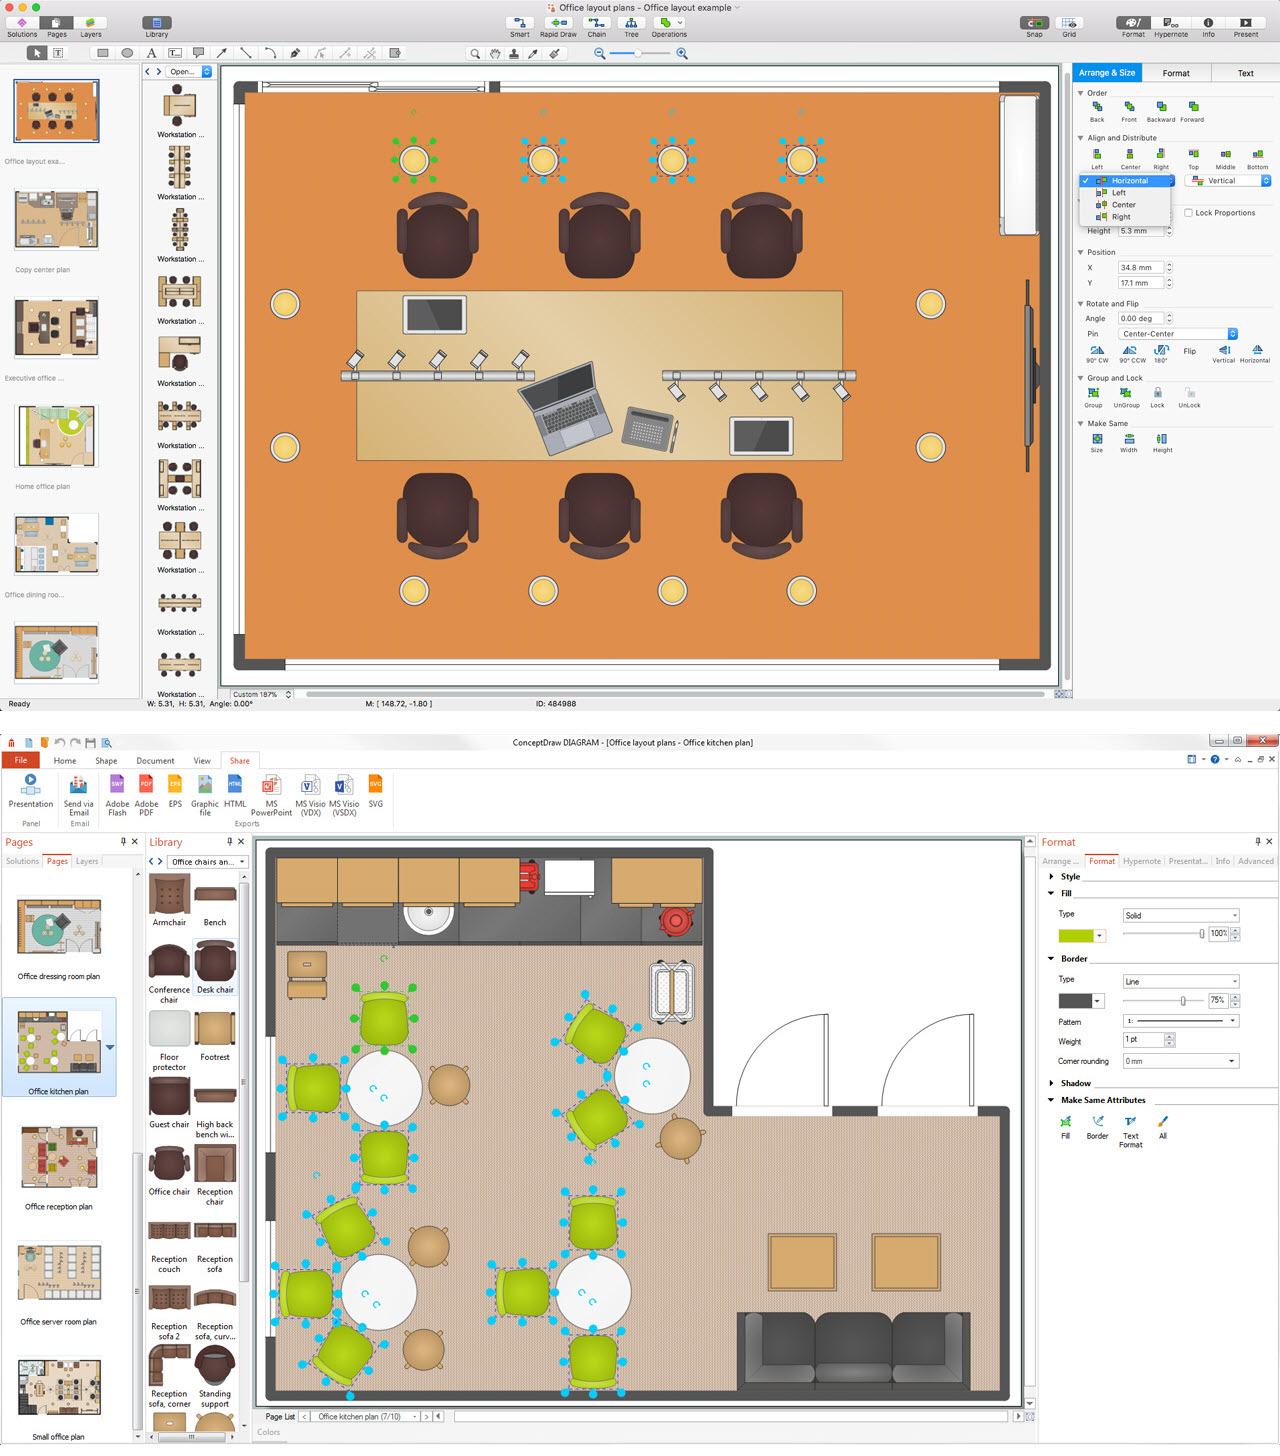
Picture: Office Design Software
Related Solution: