Total Quality Management Value
“Total Quality Management” or “TQM” is a term, that consists of all the organization-wide efforts for installing and making the appropriate climate for each of the organizations to improve their ability to deliver only high quality products as well as services to their customers. After the period, when the developed countries of Western Europe as well as North America had problems in their economy, because of having so many competitors from Japan, they had to manage to continue their work producing the high quality products at a competitive price. In this period, the United Kingdom for the first time in a long period after the start of the Industrial Revolution, became a net importer of the finished goods and the United States undertook their own soul-searching. Companies in the early 1980s began re-examining the quality control techniques, which were invented during the last 50 years, using those previously developed techniques, which had been so successfully employed by the Japanese.
In the spring of 1984 some of the civilian researchers in the United States of America were asked to assess the statistical process control and so to give recommendations on how to apply the offered approaches for improving the Navy's operational effectiveness in the USA. The given recommendation was to adopt the teachings of Edward Deming and so in 1985 the Navy branded this effort as "Total Quality Management". From the Navy, “Total Quality Management” spread throughout the United States Federal Government, resulting in the creation of the Malcolm Baldrige National Quality Award in August 1987, the creation of the “Federal Quality Institute” in June 1988 and the adoption of “Total Quality Management” by the government as well as the armed forces, such as the United States Coast Guard, the United States Department of Defence and the United Army.
The “Total Quality Management” principles can be used not only as the means to recapture the market share from the Japanese people, but also to help remain competitive while the bidding for contracts from the Federal Government. The "total quality" requires to involve the suppliers (not only employees) in the process of improvement efforts creation. There is no set definition about what “Total Quality Management” truly is and what exact actions it requires from the companies and the organizations, but a review of the original United States Navy effort gives an understanding of what is involved in the term of “Total Quality Management”.
The key concepts in the “Total Quality Management” effort include the statements, that the quality is defined by the customers' requirements, the increased quality comes from systematic analysis and improvement of work processes, the top management has direct responsibility for quality improvement and that the quality improvement is a continuous effort and conducted throughout the organization.
The Navy used the special techniques and tools, such as the so-called “PDCA” cycle to drive issues to resolution, the ad hoc cross-functional teams (which are similar to and can remind of the so-called “quality circles”) are responsible for addressing immediate process issues, that all of the standing cross-functional teams are also responsible for the processes improvement over the long term, that active management participation through steering committees, the use of so-called “Seven Basic Tools of Quality” for analysing the quality-related issues has to be applied within the “Total Quality Management”.
The mentioned above “Seven Basic Tools of Quality” is a fixed set of graphical techniques, which can be identified as being most helpful in so-called “troubleshooting” issues. This term is related to another term – “quality” and it’s well known among those who deal within the “Total Quality Management”. These tools are called “basic” for a reason of them being suitable for people with a little formal training in statistics. Also they are called “basic”, because they can be used for the purpose of solving the vast majority of quality-related issues.
These “Seven Basic Tools of Quality” are: “Check sheet”, “Control Chart”, “Histogram”, “Cause-and-effect diagram”, “Pareto chart”, “Scatter diagram” and “Stratification”.
In 1950 companies that had set about training their workforces in the quality control (the statistical quality control) found, that the complexity of the subject intimidated the vast majority of their workers and scaled back training for focusing primarily on the simpler methods, which suffice for most quality-related issues. So these “Seven Basic Tools” can be put in contrast to more advanced statistical methods. The other methods include “survey sampling”, “acceptance sampling”, “statistical hypothesis testing”, “multivariate analysis”, “design of experiments” and other methods, which were developed in the field of operations research. Also these “Seven Basic Tools of Quality” was referenced by the “Project Management Institute” in a so-called “Guide to the project management body of knowledge”. They were given as an example of the general useful tools for controlling project quality and planning project quality.
The “Total quality management” includes all together eight main elements, which are “focusing on the customers”, “total employee involvement”, “process-centred”, “integrated system”, “strategic and systematic”, “continual improvement”, “fact-based decision making” and “communications” approaches. These, described above elements, are essential in “Total Quality Management” and many companies define them as the core principles and values, which these companies have to take into consideration as the “Total quality management” contains enterprise-wide tools for implementing and making durable the atmosphere, in which an organization infinitely improves its ability to deliver the high-quality products as well services to its customers.
The “Total Quality Management” solution is the one among other solutions, which you can find in ConceptDraw STORE to use while working in ConceptDraw DIAGRAM and which can help you and your organization display your business and industrial processes using mind maps and making “Total Quality Management” diagrams, and so to demonstrate the quality control in a visual manner.
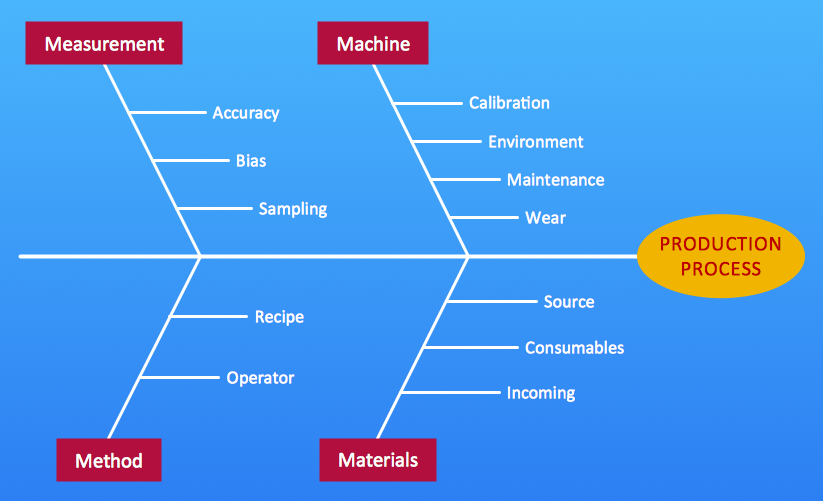
Pic.1 Fishbone diagram 4M: Production process.
In the total quality management (TQM) fishbone diagram (Ishikawa diagram, herringbone diagrams, cause-and-effect diagrams, Fishikawa) represents factors (reasons) which influence on quality coefficient of the final result of the concerned process. The main factors are 4M:
- Men
- Methods
- Materials
- Machines
These main factors are subdivided into smaller. The degree of the detailed elaboration is defined only by factors significance and planner’s tasks. With the help of Ishikawa diagram it is possible to show visually all factors which influence on the quality coefficient, sort them out and show their interrelation.
See also Samples:
TEN RELATED HOW TO's:
A flowchart is a simple but very functional tool when it comes to understanding a workflow or to removing unnecessary stages from a process. When drawing flowcharts, keep in mind that there are four common types of flowcharts, like document flowcharts and data flowcharts that show control over a data or document flow over a system. To show controls on a physical level, use system flowcharts. In addition, to show controls in a program, you can draw a program flowchart.
This flowchart diagram represents the piece of an article editing process, that involves the author and editor. It was created using the Basic Flowchart notation that consists from the basic flowchart symbols. The start and the end of the process are indicated with "Terminator" symbols. The "Process" symbols show the action steps consisting from making edits and searching for a compromise, when the author does not agree with the suggestions of the editor. The "Process" symbol is the general symbol in process flowcharts. The "Decision" symbol indicates a branching in the process flow. There are two branches indicated by a Decision shape in the current flowchart (Yes/No, Disagree/Agree). This basic flowchart can be used as a repeating unit in the workflow diagram describing the working process of some editorial office.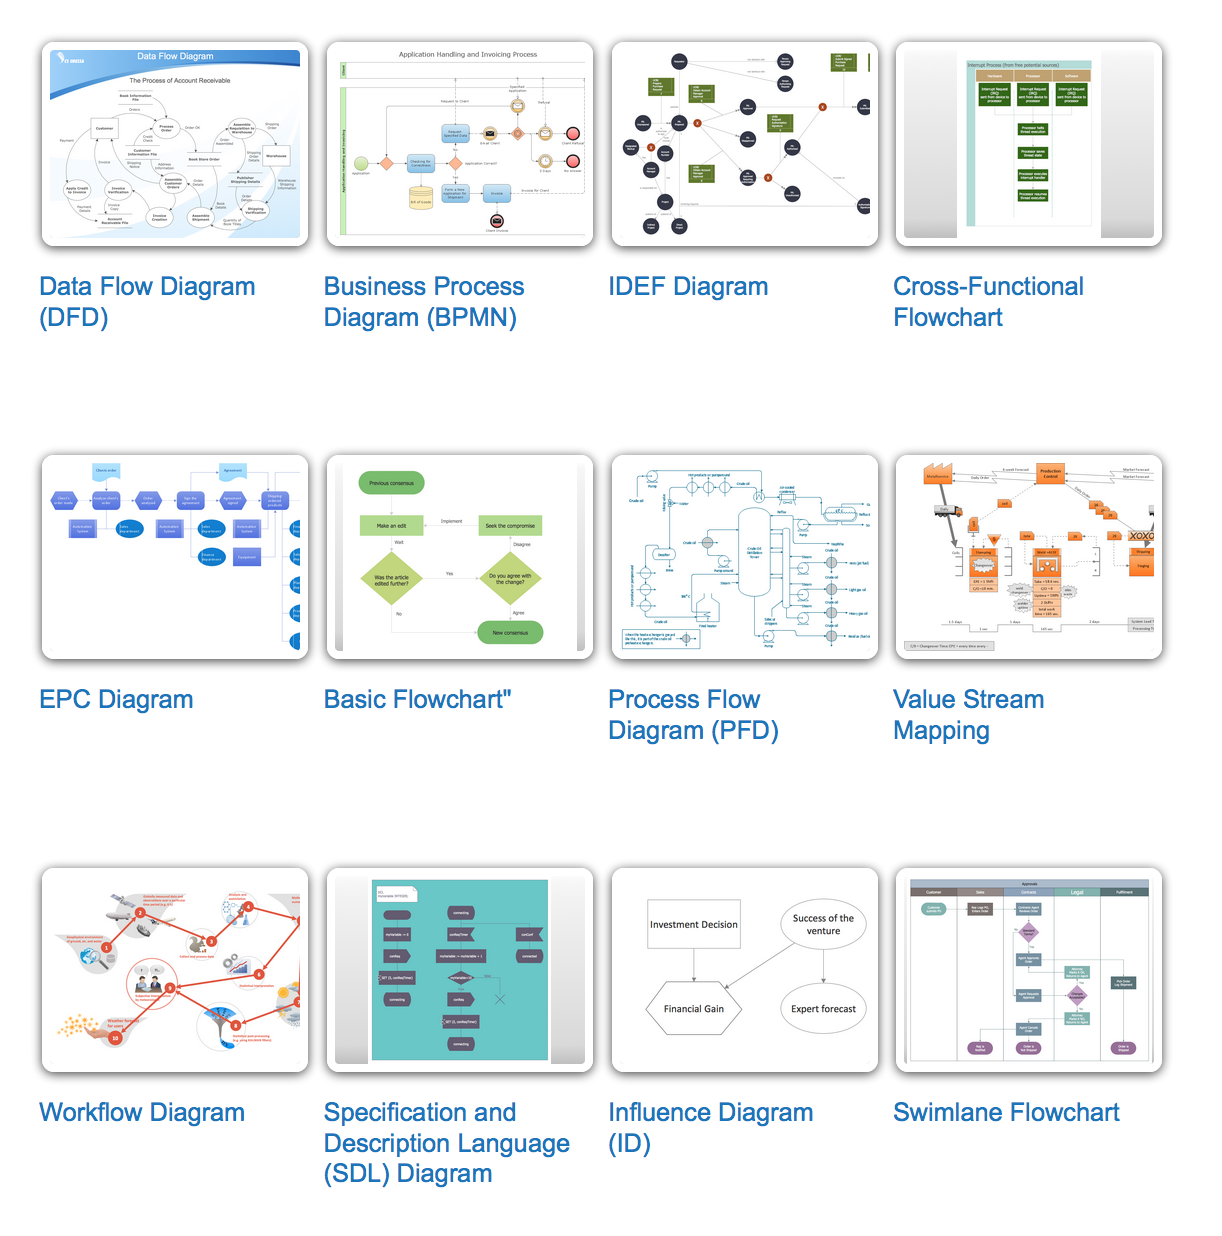
Picture: Types of Flowcharts
Related Solution:
A flowchart is a powerful tool for examining processes. It helps improving processes a lot, as it becomes much easier to communicate between involved people, to identify potential problems and to optimize workflow. There are flowcharts of different shapes, sizes and types of flowchart vary from quite basic process flowcharts to complex program flowcharts. Nevertheless, all these diagrams use the same set of special symbols like arrows to connect blocks, parallelogram to show data receiving or rectangles for showing process steps.
Basic flowcharts are used to represent a simple process algorithm. A basic flowchart notation consists of rectangles (business processes), arrows (the flow of information, documents, etc.). The same notation is used in items such as the "decision", which allow you to do the branching. To indicate the start of the entire business process and its termination can be used the "Terminator" element. The advantages of Basic Flowchart are simplicity and clarity. With it you can quickly describe the business process steps. Creating of Basic Flowchart does not require any special knowledge, as easily understand by employees with different levels of education and IQ.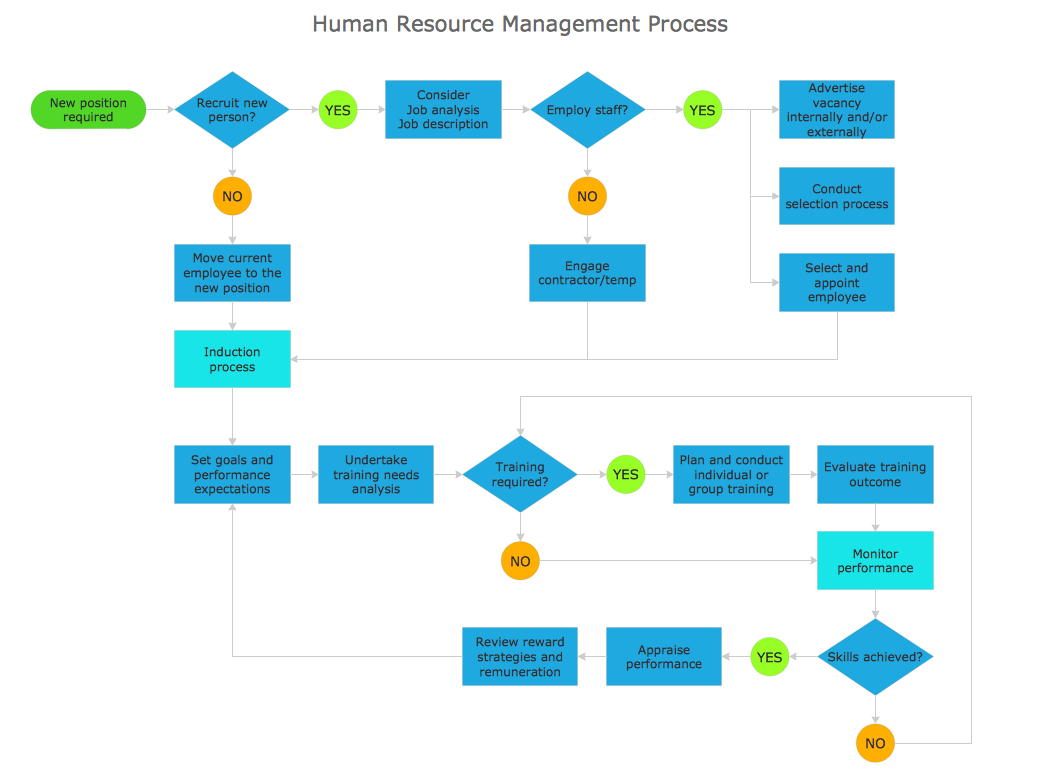
Picture: Types of Flowchart: Comprehensive Overview
Related Solution:
ConceptDraw DIAGRAM diagramming and vector drawing software extended with Total Quality Management (TQM) Diagrams solution from the Quality area of ConceptDraw Solution Park perfectly suits for development and visually representing a Quality Management System.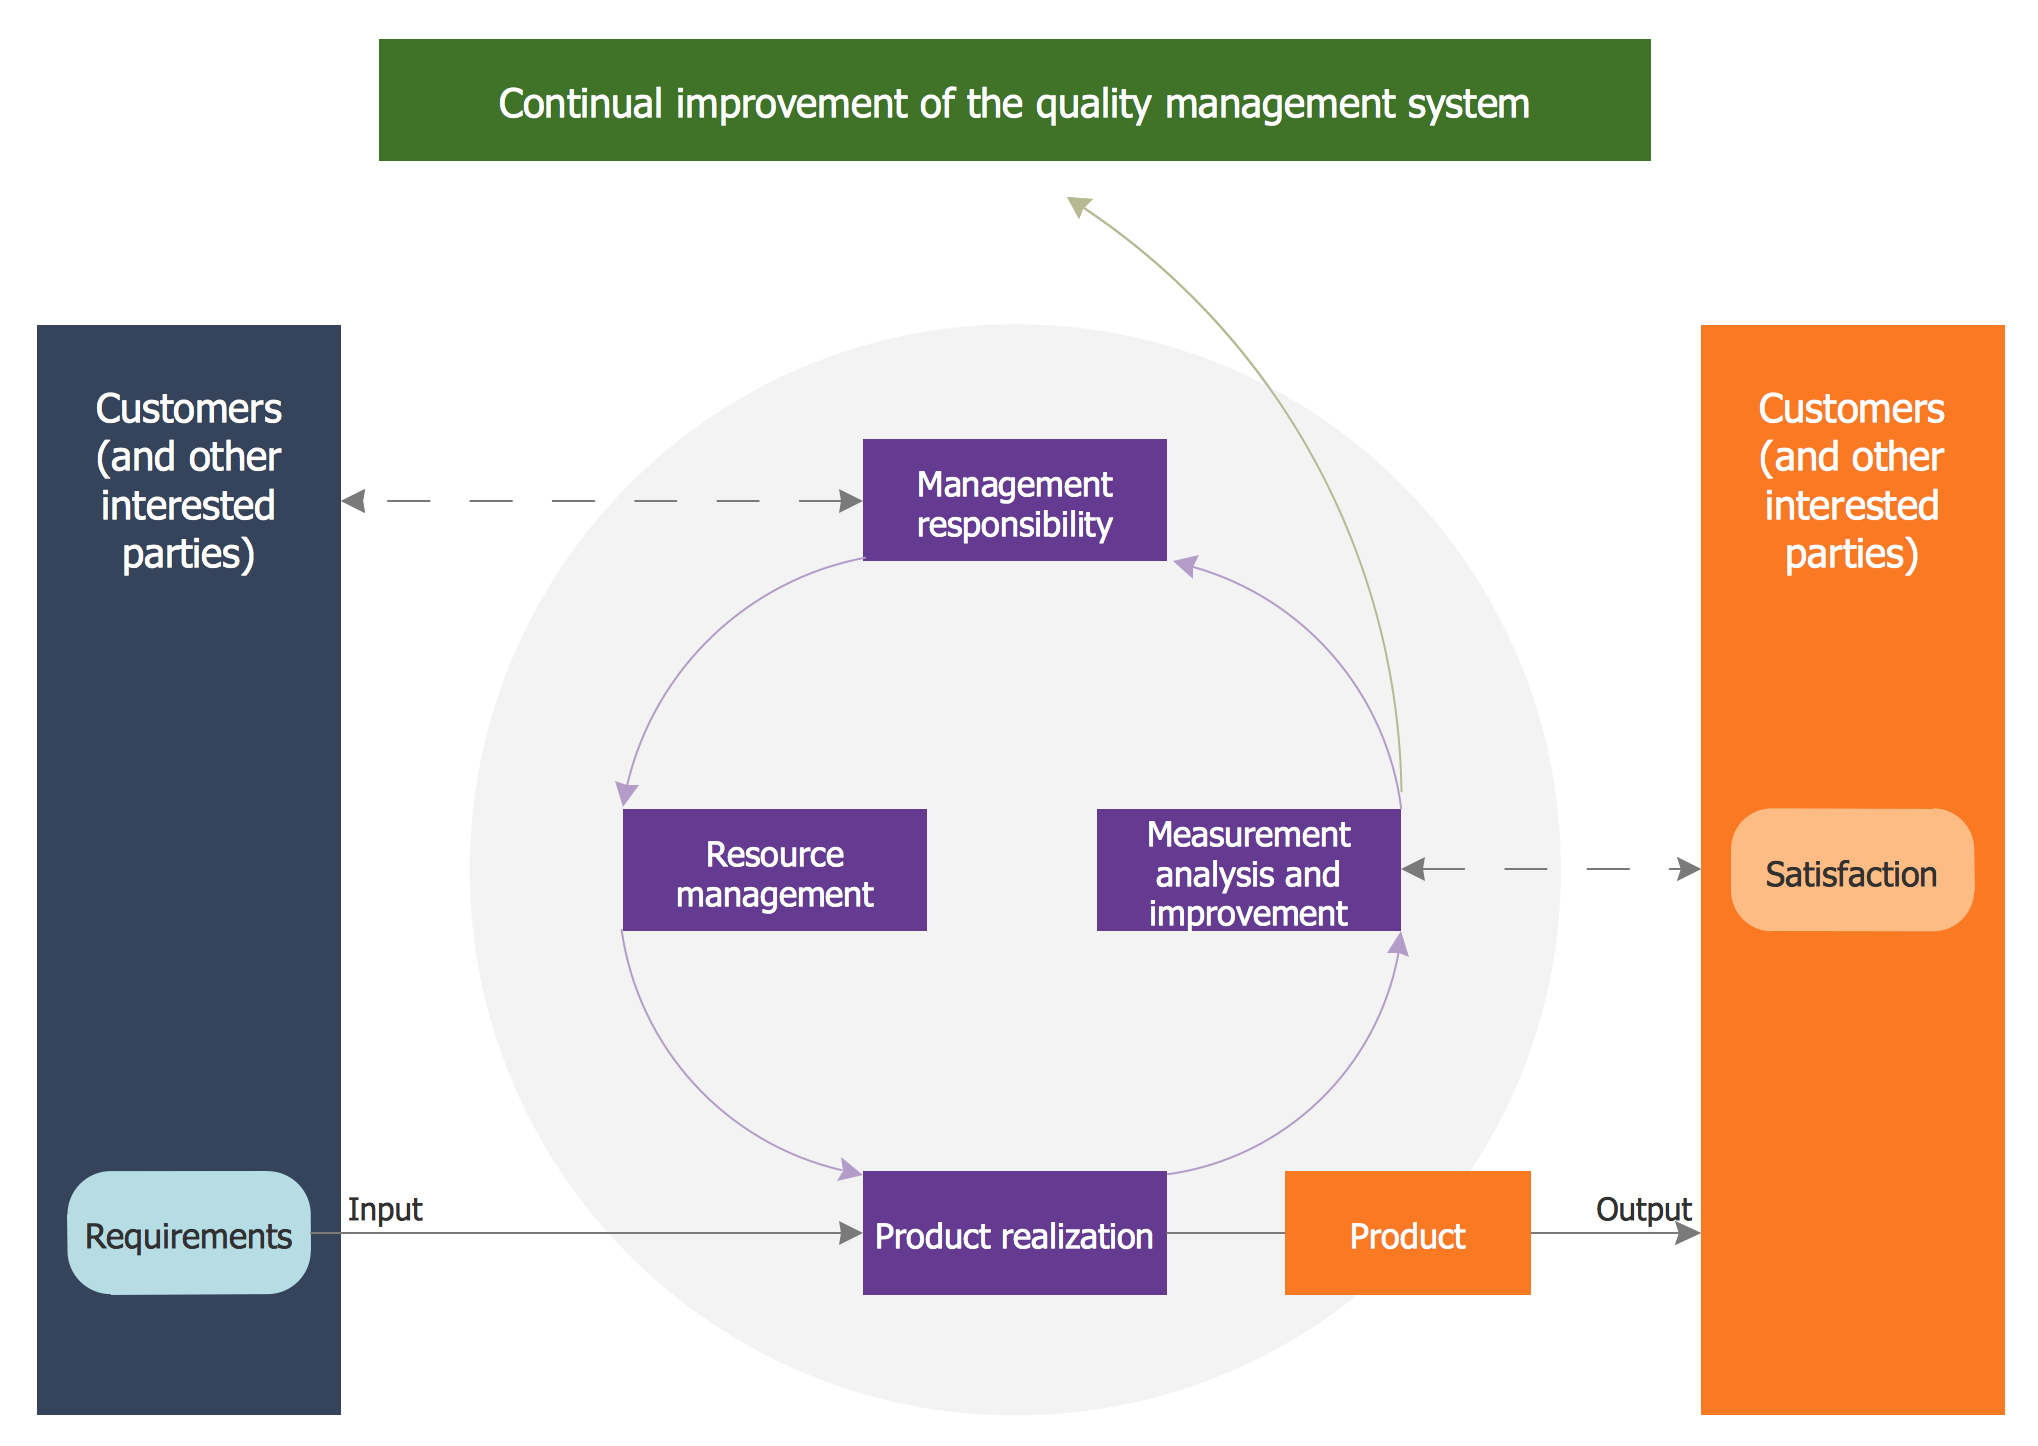
Picture: Quality Management System
Related Solution:
From all the auxiliary business process tools, SWOT analysis always remains in the top place. It is difficult to answer what SWOT Analysis is in marketing in several paragraphs. This is a very powerful tool to understand all the circumstance of your business, it is important part of small business project management.
This SWOT analysis was carried out to discover strengths and weaknesses of the marketing strategy, as well as identify its opportunities. This SWOT diagram (matrix) was drawn in Conceptdraw DIAGRAM using its SWOT and TOWS Diagrams solution. Investigations of all constituents of a certain case will assist in considering strategy statements and during and making a decision. The SWOT analysis is the good tool for specifying marketing objectives discovering external and internal influences on accomplishing marketing objectives, this is critical tool for small business project management. ConceptDraw Office suite delivers SWOT diagram samples and tools in illustrative part of marketing project management software and project report software.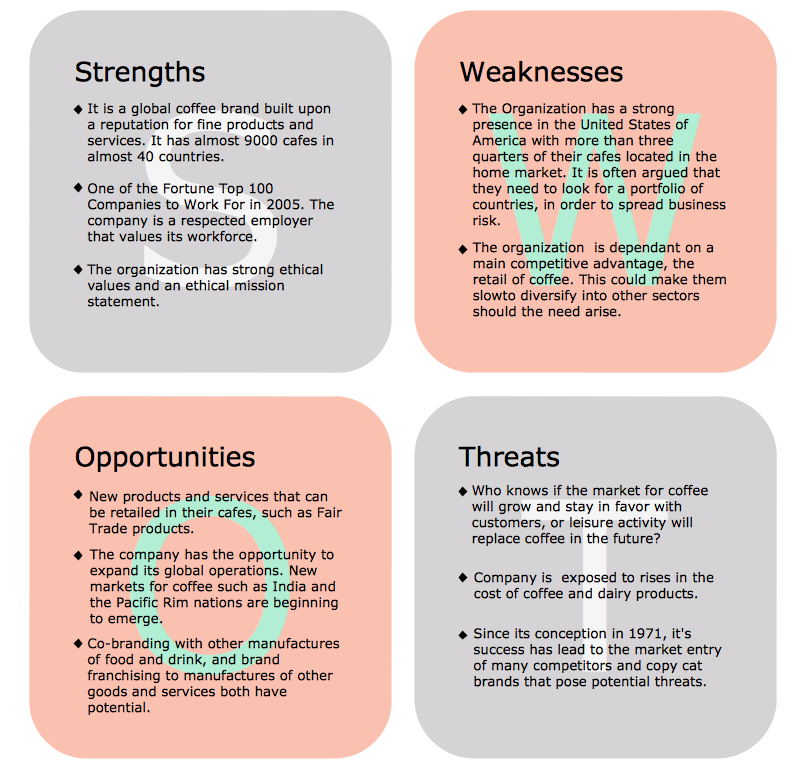
Picture: What is SWOT Analysis in Marketing
If you want to find a way to understand complex things in minutes, you should try to visualize data. One of the most useful tool for this is creating a flowchart, which is a diagram representing stages of some process in sequential order. There are so many possible uses of flowcharts and you can find tons of flow charts examples and predesigned templates on the Internet. Warehouse flowchart is often used for describing workflow and business process mapping. Using your imagination, you can simplify your job or daily routine with flowcharts.
Warehouse flowcharts are used to document product and information flow between sources of supply and consumers. The flowchart provides the staged guidance on how to manage each aspect of warehousing and describes such aspects as receiving of supplies; control of quality; shipment and storage and corresponding document flow. Warehouse flowchart, being actual is a good source of information. It indicates the stepwise way to complete the warehouse and inventory management process flow. Also it can be very useful for an inventory and audit procedures.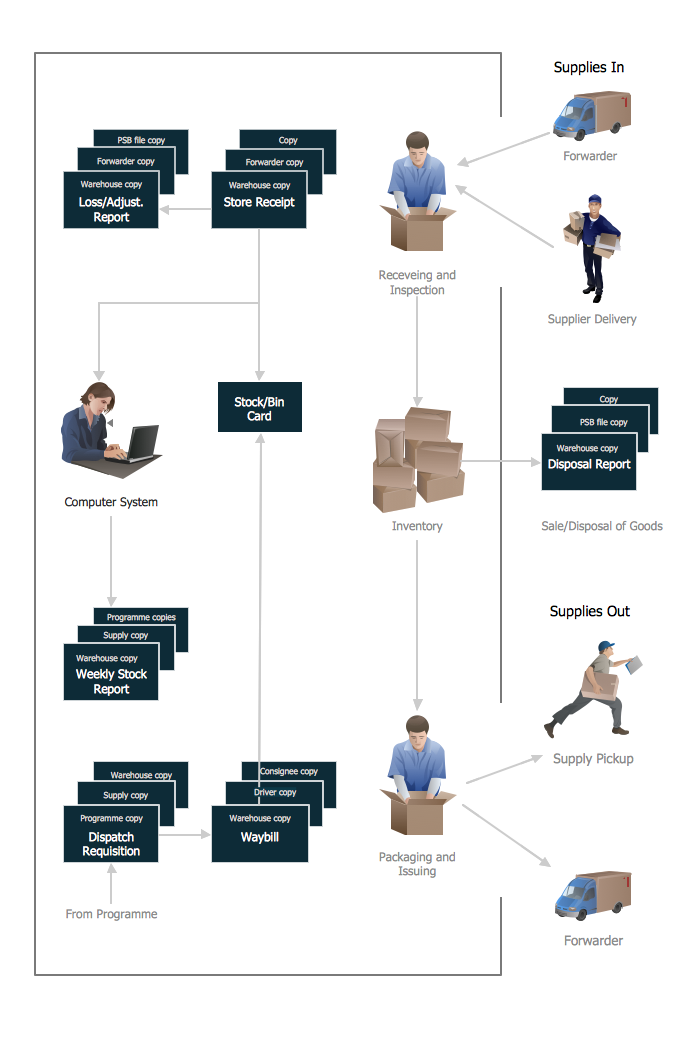
Picture: Flow Chart Example: Warehouse Flowchart
Related Solution:
Deployment diagram describes the hardware used in system implementations and the execution environments and artifacts deployed on the hardware.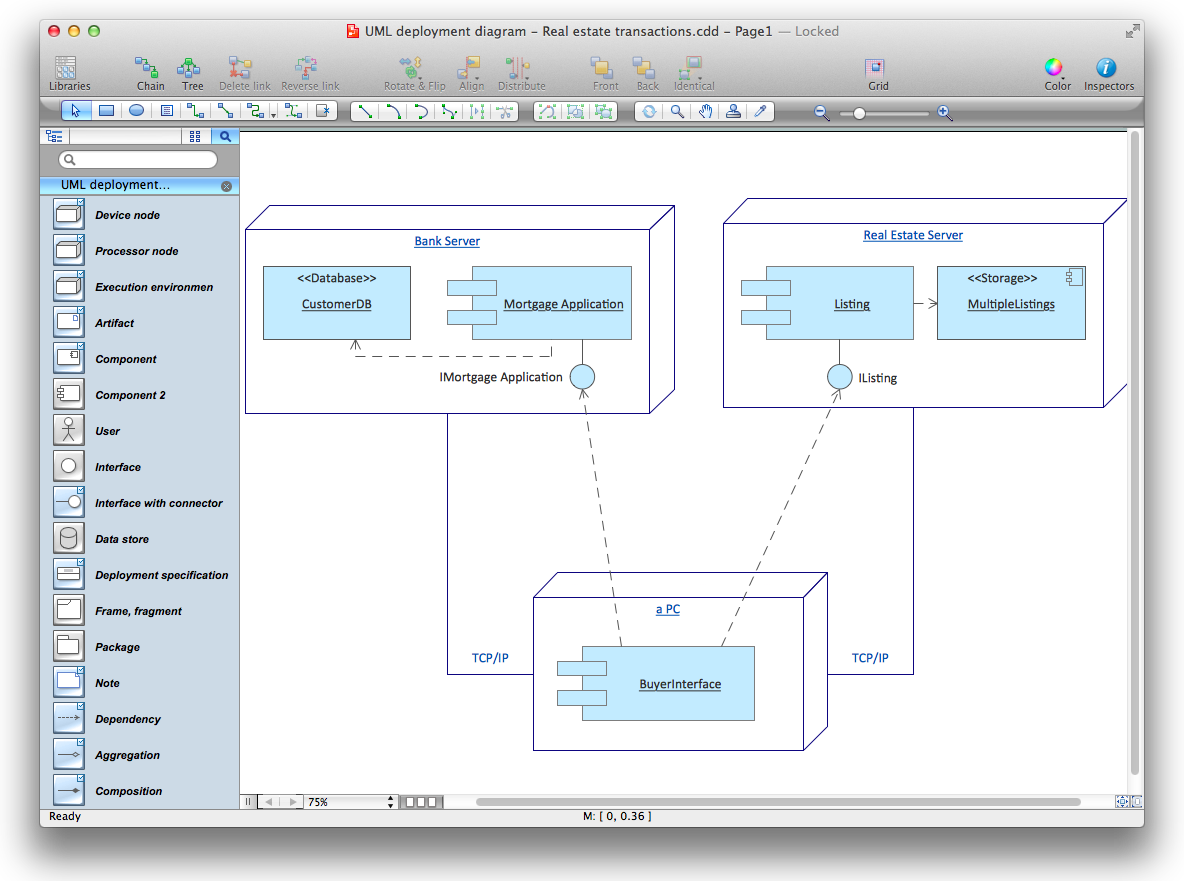
Picture: UML Deployment Diagram. Diagramming Software for Design UML Diagrams
Any business process consists from a number of tasks carrying out the certain business goal. It is useful to diagram business processes to ensure that they are as foolproof, logical and sequential as possible. This business process diagram describes a typical booking process flow by the example of a cab booking process. It can be used as a roadmap for any booking system implementation. Diagramming a business process allows you to look at the entire project and take into account all types of possible scenarios. Business process diagram helps you investigate and clarify the process thoroughly so that you can find out how it can be improved. Business process diagram supports team communications by ensuring that each process element is clear and everyone in the team is on the same page.
Sometimes your company brings you less profit than you expect it to be, and it’s difficult to reveal the causes. Maybe it’s time to learn new technologies, because business diagram are easily developed by means of special software, so you won’t make any extra effort. In return, you will increase your productivity and get more done in a less time.
Picture: Business Diagram Software
Related Solutions:
There are numerous articles about the advantages of flowcharting, creating business graphics and developing different charts. Nevertheless, these articles are almost useless without the main component - the examples of flowcharts, org charts and without a fine example, it is difficult to get all the conveniences of creating diagrams. You can find tons of templates and vivid examples on Solution Park.
This illustration shows a variety of business diagrams that can be created using ConceptDraw DIAGRAM. It comprises a different fields of business activities: management, marketing, networking, software and database development along with design of infographics and business illustrations. ConceptDraw DIAGRAM provides a huge set of sample drawings including business process modeling diagrams,, network diagrams, UML diagrams, orgcharts, DFD, flowcharts, ERD, geographical maps and more.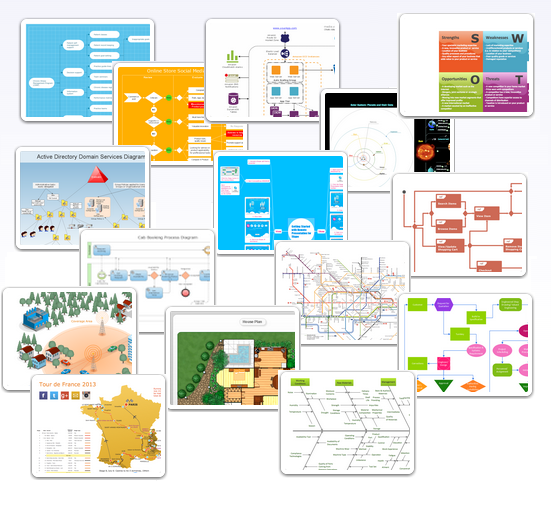
Picture: Examples of Flowcharts, Org Charts and More
Related Solution:
The ConceptDraw Flowchart component includes a set of samples and templates. This geathered as flowchart maker toolbox which focused on drawing flowcharts of any industry standards.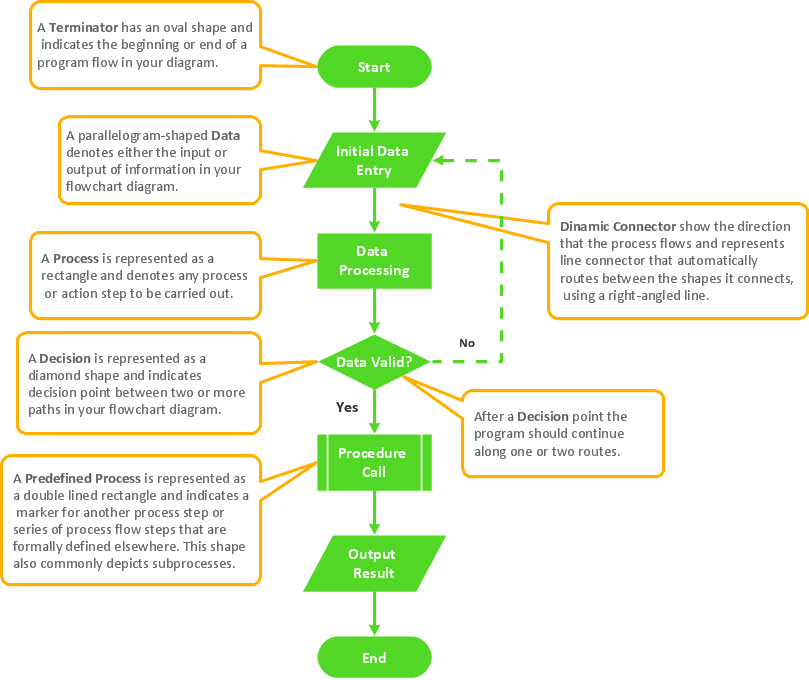
Picture: Flowchart Components
Related Solution:
Easy charting software comes with beautiful chart templates and examples. This makes it easy to create professional charts without prior experience.
Picture: Chart Examples
Related Solutions: