TQM Diagram — Professional Total Quality Management
Professional Total Quality Management (TQM) includes usage of diagrams and charts like flowcharts, Ishikawa diagrams, seven management and planning tools for visual modelling of business and technical processes, and graphic representation of quality metrics and key performance indicators.

Pic.1 Planning process flowchart.
This business process flow chart example depicts planning step-by-step for control, analysis and improvement.
See also Samples:
NINE RELATED HOW TO's:
Process Decision Program Chart (PDPC) is a commonly used technique that was designed in order to help prepare the contingency plans. The emphasis of the PDPC is identifying the consequential impact of failure on activity plans as well as creating the appropriate contingency plans in terms of limiting the risks. Planning to make the tree diagrams and/or the process diagrams can be extended by a couple of levels when the PDPC can be applied to the bottom level tasks on those diagrams.
Picture: Risk Diagram (Process Decision Program Chart)
Related Solution:
Draw Company Structure Diagram - get the detailed information about the company structure and hierarchy - who execute what tasks and who is in charge at this company. This information shows the reasoning and success of business and is indispensable for investors and financial institutions.

Picture: Draw Company Structure with Organization Charting Software
Related Solution:
The popularity of Block Diagrams grows day by day. The existence of powerful software for their design is an excellent news! ConceptDraw DIAGRAM Block Diagram Software offers the Block Diagrams Solution from the Diagrams Area.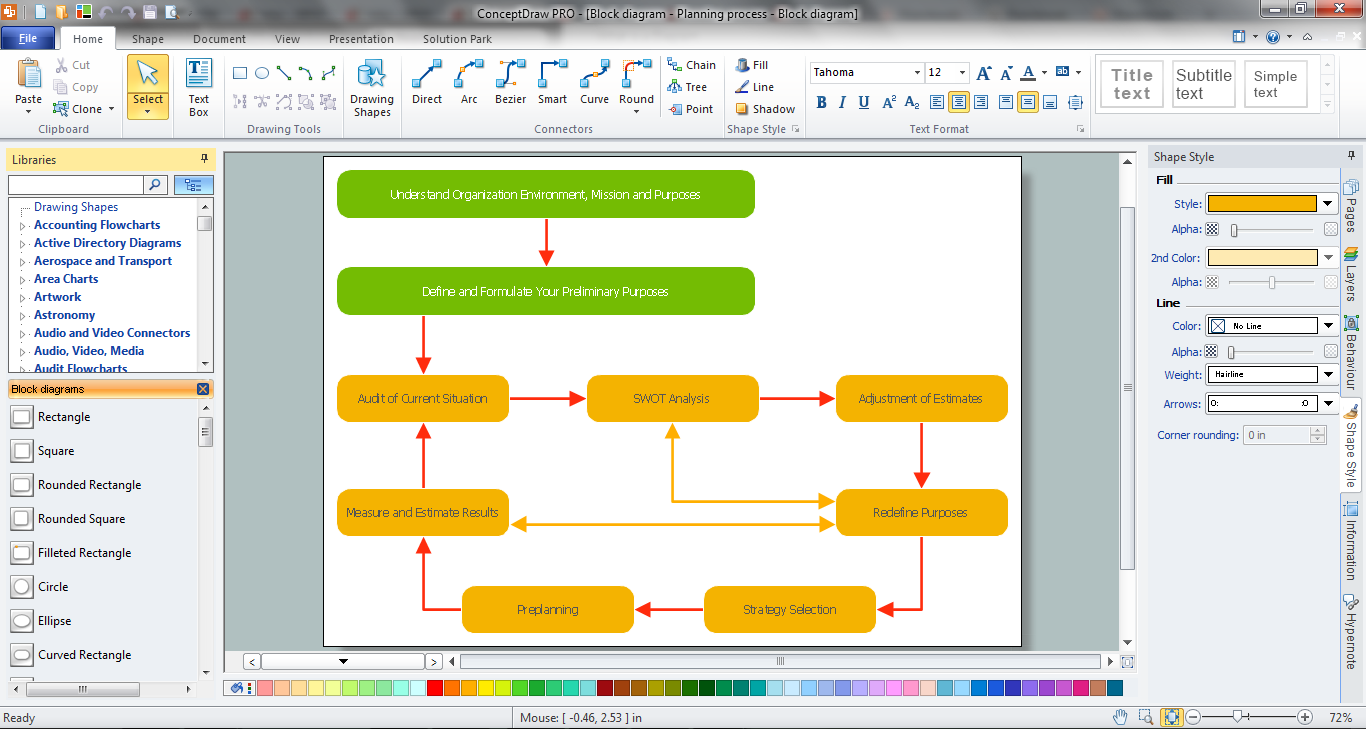
Picture: Block Diagram Software
Related Solution:
These donut chart templates was designed using ConceptDraw DIAGRAM diagramming and vector drawing software extended with Pie Charts solution from Graphs and Charts area of ConceptDraw Solution Park.
All these donut chart templates are included in the Pie Charts solution.
You can quickly rework these examples into your own charts by simply changing displayed data, title and legend texts.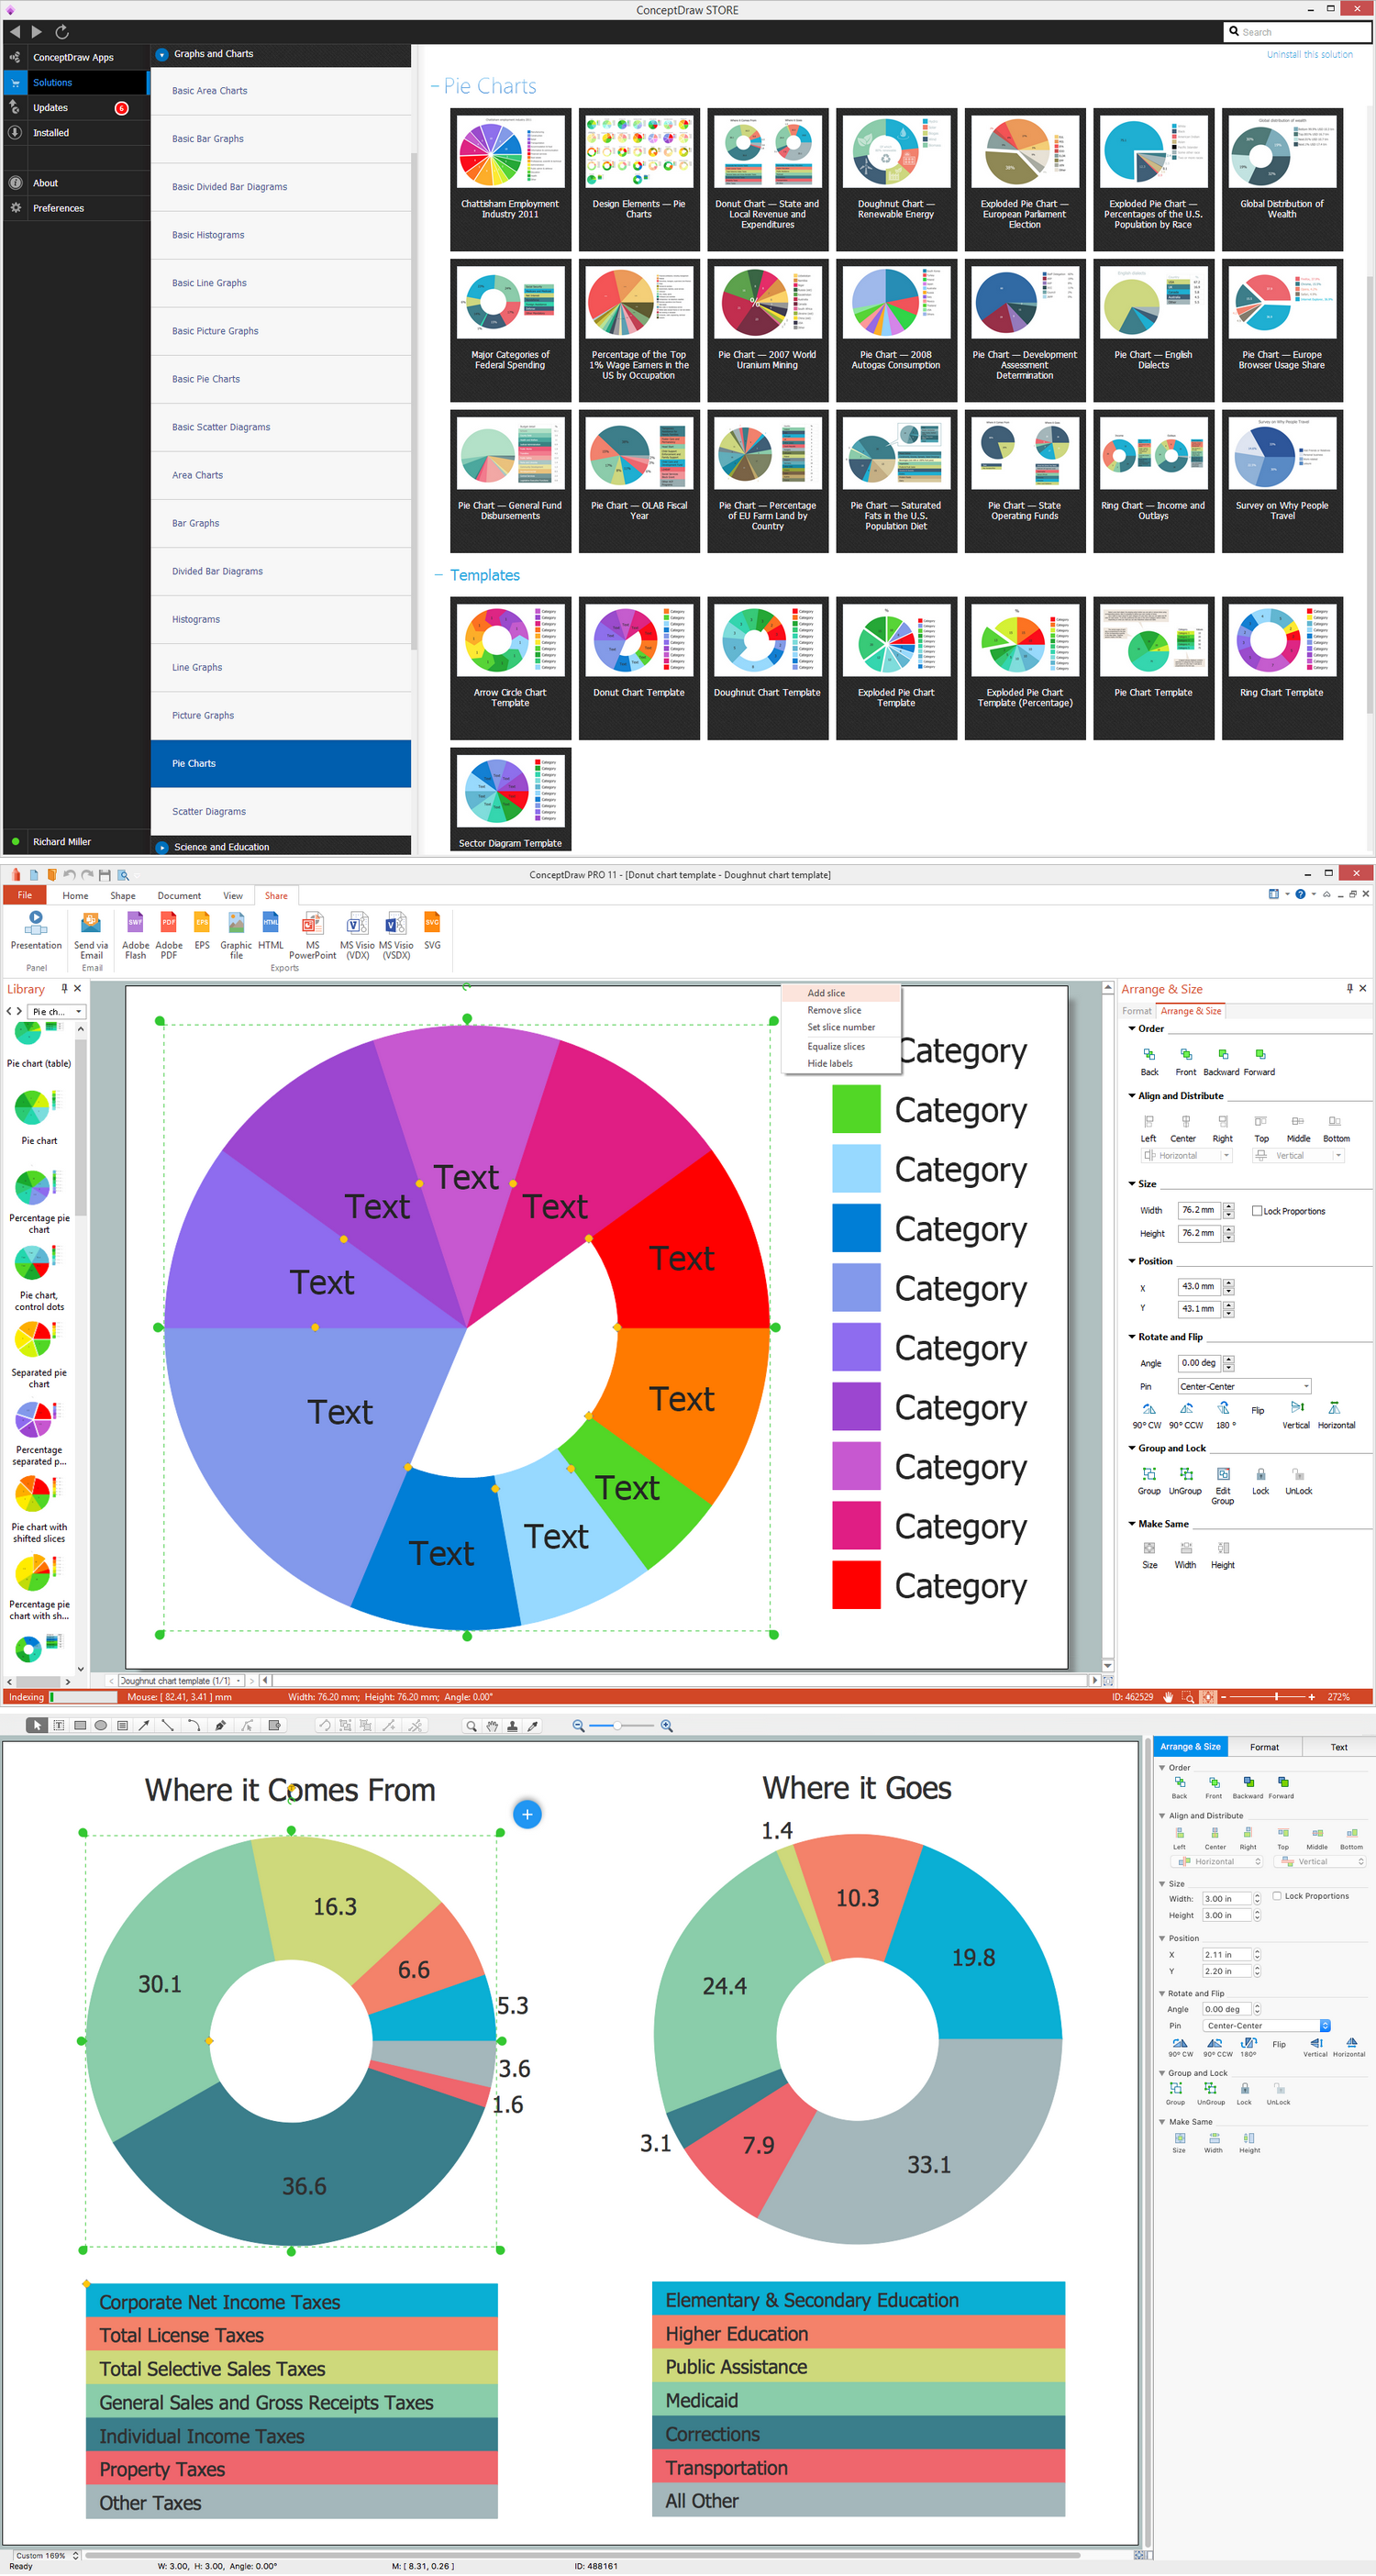
Picture: Donut Chart Templates
Related Solution:
UML Apartment Plan. This sample was created in ConceptDraw DIAGRAM diagramming and vector drawing software using the UML Class Diagram library of the Rapid UML Solution from the Software Development area of ConceptDraw Solution Park.
This sample show the detailed plan of the apartment and is used by building companies, design apartments, real estate agencies, at the buying / selling of the realty.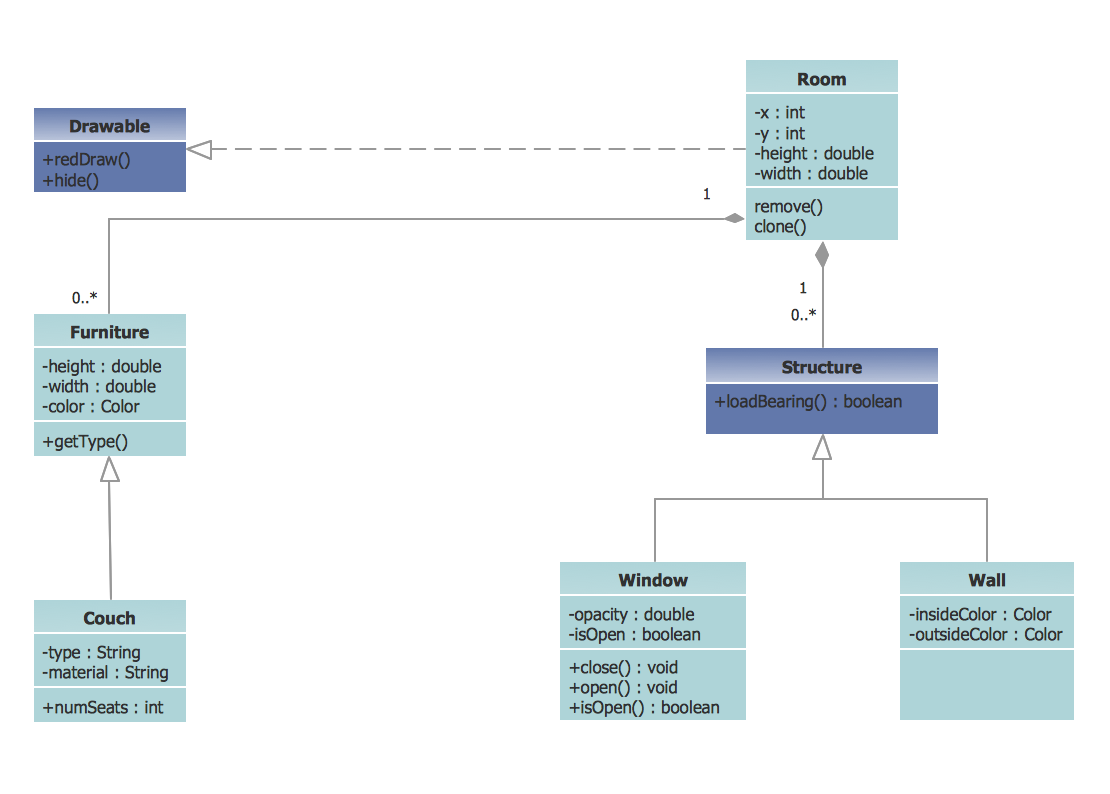
Picture: UML Class Diagram Example - Apartment Plan
Related Solution:
ConceptDraw software has been developed for drawing any type of flowchart. Use RapidDraw - thi is flowchart maker technology for adding new objects to a flowchart quickly. This is technology of fast drawing technique focused on making great-looking flowcharts quickly. To get started using it download flowchart maker ConceptDraw DIAGRAM.
Picture: Flowchart Program Mac
Related Solution:
In ConceptDraw DIAGRAM it really is sp simple to draw even the most complex cross-functional flowcharts. Use the RapidDraw technology and Cross-Functional libraries in ConceptDraw DIAGRAM for the best results.
Picture: How to Simplify Flow Charting — Cross-functional Flowchart
Related Solution:
ConceptDraw PROJECT delivers a rich set of built-in functionalities and optional product extensions that support your daily workflow in time-saving and creative ways. This video lesson will teach you how to work with costs in your project document.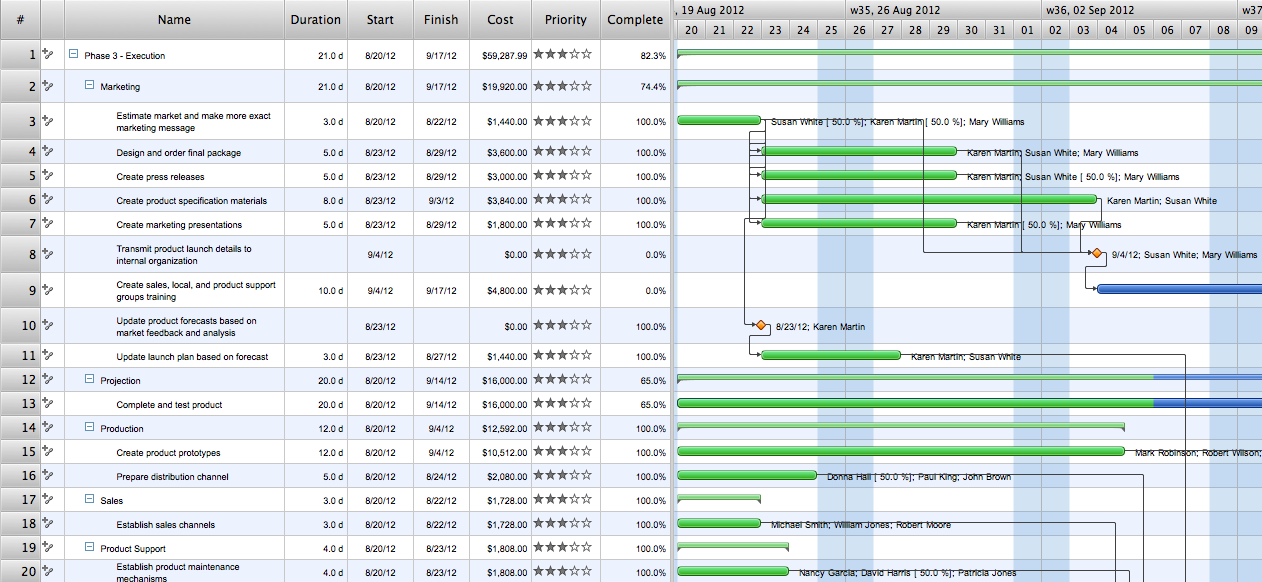
Picture: Project — Working With Costs
A landscape plan depicts all the features of a future garden including buildings, plants, lawns or a patio. Such plan is a very important part of site adjustment because it gives a complete picture of future project.
Picture: Landscape Plan
Related Solution:
ConceptDraw
DIAGRAM 18