Pyramid Diagram
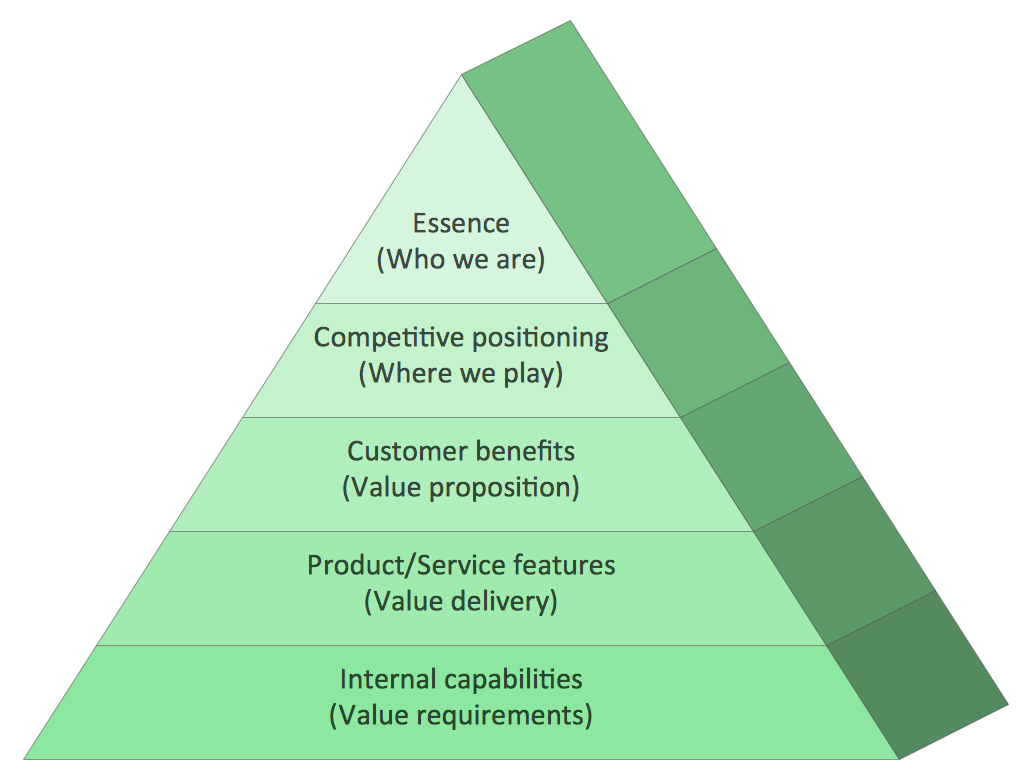
In case there is a need for you to make any triangle diagram, then all you will have to do is to download the ConceptDraw DIAGRAM diagramming and drawing software and start using it for getting a prompt and professional result within only a couple of minutes as long as you use Pyramid Diagrams solution from ConceptDraw STORE application — a new product of CS Odessa, developed for pleasing their clients in terms of providing the necessary tools, including the pre-made examples of the triangle diagrams.
Triangle diagram can also be known as a pyramid or pyramid diagram. An example of such drawing can be a DIKW model — the one used for describing any functional and structural relationships, where the lower levels can be mentioned as the ones comprising the material of the other, the higher levels. Such kind of pyramid can also be represented in a way of a two-dimensional chart. Another option to create a DIKW pyramid is to make it look like a flow diagram with the help of ConceptDraw DIAGRAM diagramming and drawing software.
Example 1. Pyramid Diagrams Software
But, still, the most popular way of describing the mentioned drawing is to make it look like a proper triangle diagram where all six levels are mentioned, which are facts, data, wisdom, information, measurements and knowledge. The correct order is known to be the following, starting from the top: wisdom, knowledge, information, data, facts and measurement on the very bottom of the pyramid. Having the mentioned drawing created can be a fun and entertaining process as using ConceptDraw DIAGRAM drawing software is simply very convenient.
Having the previously created samples of the diagrams can always help make your own triangle pyramid in a way of editing the existing ones taken from the mentioned solution, which you can always find in the ConceptDraw STORE application. The ConceptDraw STORE product can be downloaded from this site as well as ConceptDraw DIAGRAM one, which is the main tool for editing as well as making new drawings.
Example 2. Pyramid Diagrams Solution
The study of DIKW determines the information as the one meeting the definition for some knowledge by some way of describing different things. The mentioned descriptions may contain any needed information, which can be always inferred from some data by answering the “interrogative” questions. The mentioned questions are usually the following: "what", "how many", "who", "where" and "when". Answering them can lead to making any particular data useful enough for making the needed decisions and so the needed actions. Thus, any information can be defined as data, which is endowed with both meanings as well as the purpose.
Any graphical representation of the DIKW triangle diagram may look like as if it were some hierarchical model, similar to a pyramid, as its “data” is known to be at its very bottom and “wisdom” at its apex. Referring it to a class of models, used for a purpose of representing the purported functional and different structural relationships between information, wisdom, data and knowledge, you can rely on ConceptDraw DIAGRAM diagramming and drawing software, as it is known to be a great tool for making any needed drawings within only a few hours or sometimes a few minutes.
Any information is known to be whether subjective or universal, sometimes - both, especially within the DIKW models as most of the DIKW models look like a set of the different textbooks, so it becomes simpler to describe any needed information in a way of a structured or an organized data. Making DIKW Knowledge, Hierarchy, Wisdom, Information and Knowledge Pyramid is always a simple thing to do, especially in a way of using the existing, previously created examples by the specialists of CS Odessa — the company, which was established for providing the alternative to many different drawing applications, to have all the needed for drawing tools all in one ConceptDraw STORE product which all can be used while working in ConceptDraw DIAGRAM application.
The samples for creating any needed DIKW pyramid (triangle) diagrams can be found in the already mentioned “Pyramid Diagrams solution” by simply downloading it from ConceptDraw STORE. As long as you have the mentioned solution, you can always use any out of some many different templates of the diagrams to use as your drafts for making your own drawings. The choice of the samples in this solution is huge: all different colours, different structures and styles. The design of your own preferred diagram can be chosen from the proposed ones.
You can find lots of different examples of the triangle diagram in the “Pyramid Diagrams” solution. Thus, there are those of blue colour, green, yellow, red and light blue, the triangle diagrams of red and green colour with the borders and the circles on their corners, those with circles in their centres as well as with the arrows, there is also an example of the triangular Venn diagram represented in a way of three oval shapes all of the different colours — blue, red and yellow.
In case you want your diagram to look same as the provided example of the triangle chart, you can always use the one, which was already previously created especially for all the ConceptDraw DIAGRAM users to simplify their work with making the needed drawings. The triangle diagrams may also look similar to the isometric triangle charts. If you decide to make an arrowed block pyramid, for example, you can simply drag the needed templates from the Pyramid Diagrams solution and edit it the way it has to be edited so it satisfies your needs.
The funnel diagrams may also be created in a way of a triangle diagram, but the difference is that they may look like the triangles positioned upside down, meaning the bottom would be higher than the top of the triangle. The quantity of levels to have on your triangle diagram if what nobody else, but you choose. Thus, you can have as many levels as you want. There are, for instance, the three-levels examples of the triangle diagrams, the four-levels one, the five-levels ones as well as the and five-levels ones.
This 3D triangular diagram example of DIKW pyramid has 6 levels: measurement, facts, data, information, knowledge, wisdom.

Example 3. DIKW pyramid — 3D triangle diagram
This sample shows the DIKW Hierarchy. It is a 6 level 3D pyramid. The DIKW Pyramid allows you to visually display the relationships between data, information, knowledge, facts, measurement, and wisdom. The large array of high-resolution vector objects in the Pyramid Diagrams Solution allows you create the pyramid diagrams with different styles and number of levels.
See more Pyramid Diagram:
- Zooko Triangle Diagram
- Time, Quality, Money Triangle Diagram
- Project Triangle Diagram
- Purchase Funnel Diagram
- Project Triangle Chart
- Priority Pyramid Diagram
- Organization Triangle Diagram
- Knowledge Triangle Diagram
- Triangular Graphic
- Inverted Pyramid
- Fundraising Pyramid
- 3D Triangle Diagram
- DIKW Pyramid
- Five level pyramid model
- Four level pyramid model
- Three level pyramid model


