Typography Art
“Infographics are graphic visual representations of information, data or knowledge intended to present complex information quickly and clearly.” [from Wikipedia]
Typography Infographics Solution for ConceptDraw Solution Park is the best answer on the question “How to create an Infographic?”. The Typography Infographics created in ConceptDraw DIAGRAM using the Typography Infographics Solution from the “Infographics” Area are the real typography art.

Example 1. Typography Art — UK Economy
It is sufficiently look at the libraries of predesigned vector objects from the Typography Infographics Solution to understand how beautiful Typography Infographics it is possible create using them.


Typography Infographics Solution contains also collection of infographic examples that are also typography art. They was created our designer specially for you and are available from ConceptDraw STORE. You can open any desired example and change it for your needs.
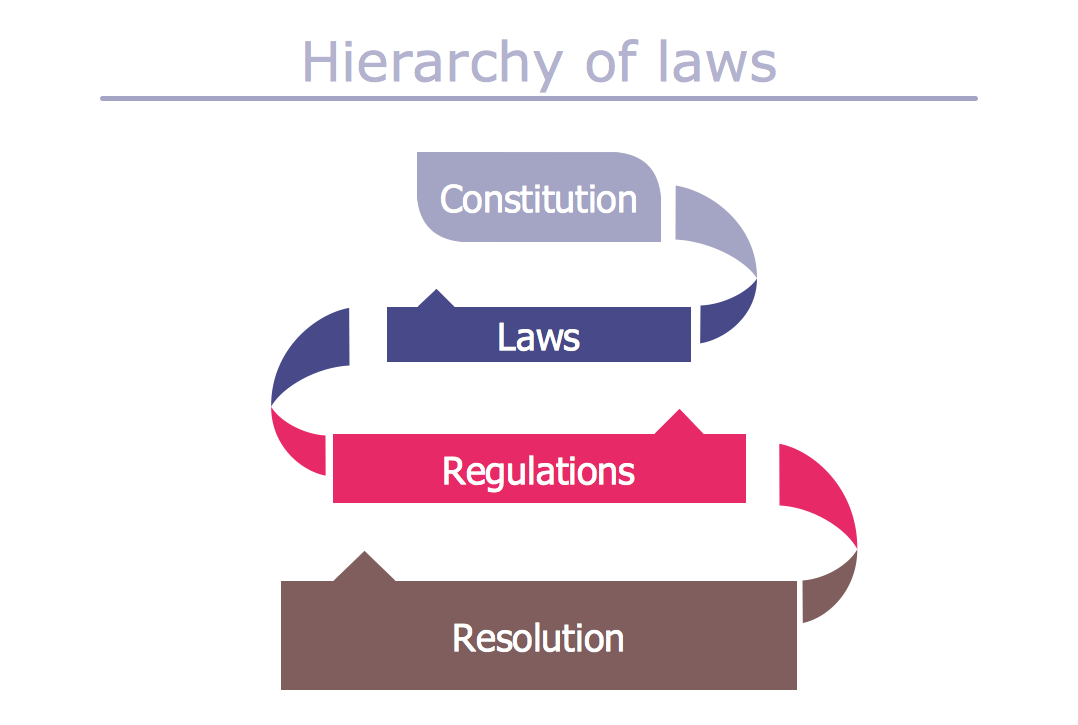
Example 2. Typography Art — Hierarchy of Laws
This sample was created in ConceptDraw DIAGRAM using the Typography Infographics Solution from the “Infographics” Area and shows the simplest typography graphic of hierarchy of laws. An experienced user spent 15 minutes creating this sample.
The samples you see on this page are the real typography art! Use the Typography Infographics Solution for ConceptDraw DIAGRAM infographic software to create your own so beautiful and professional looking Typography Infographics quick, easy and effective.
All source documents are vector graphic documents. They are available for reviewing, modifying, or converting to a variety of formats (PDF file, MS PowerPoint, MS Visio, and many other graphic formats) from the ConceptDraw STORE. The Typography Infographics Solution is available for all ConceptDraw DIAGRAM or later users.