UML Diagrams with ConceptDraw DIAGRAM
UML (Unified Modeling Language) is a general-purpose modeling language used to represent the structure of complex software in a visual form, and employed in software engineering. UML diagrams are also efficient for documenting complex computer systems and software. Such visual models facilitate communication between the customer, system analysts and programmers, who write the source code. In addition, it's much easier for new programmers to understand the source code when a detailed UML diagram of it is available. Previously, when a programmer resigned a part of his work was gone with him because the code-creating process took place exclusively in his head. Now a newcomer can understand and get familiar with someone else's code without much trouble.
Programming languages may use operations and methods which are basically same, though vary by names and graphical notations. The UML language defines standards not only for operations and methods of programming languages, but also for their terminology.
So, using UML diagrams for visual modeling will help you to improve the final software products, simplify the process of its creation and meet the deadlines.

ConceptDraw DIAGRAM is a professional software product designed for creating detailed UML diagrams. A large number of libraries with ready-made objects for UML diagrams and task-oriented templates let you create UML diagrams of any complexity without effort.

To draw a diagram, just drag the required objects from the corresponding library onto the document page, then connect them with connectors appropriate for diagrams of this type.
There are 8 types of UML diagrams:
Use case diagram:
Diagrams of this type represent a list of operations performed by the system. Such diagrams are also called functional diagrams, as the list of the system's functions is created based on them, in accordance with the specified requirements.
Use case diagrams are used to describe business processes in automated applications and to define requirement for software to be developed. They depict objects from the system and application domain as well as the tasks performed by them.

Pic.1. UML use case diagram
To draw diagrams of this type, use the UML Use Case Diagram library in ConceptDraw DIAGRAM
Deployment diagram:
UML diagrams of this type serve to analyse the hardware used in system implementations, interaction between the processor and other components. As a rule, such diagrams are used in the beginning of designing to determine the hardware configuration of the system.

Pic.2. UML deployment diagram
Use the UML Deployment Diagram library to create such diagrams in ConceptDraw DIAGRAM
Statechart diagram:
Statechart diagrams serve to model possible states of the objects in the system. They also depict the sequence of actions required for transition between the states.

Pic.3. UML statechart diagram
Use the UML Statechart Diagram library to create such diagrams in ConceptDraw DIAGRAM
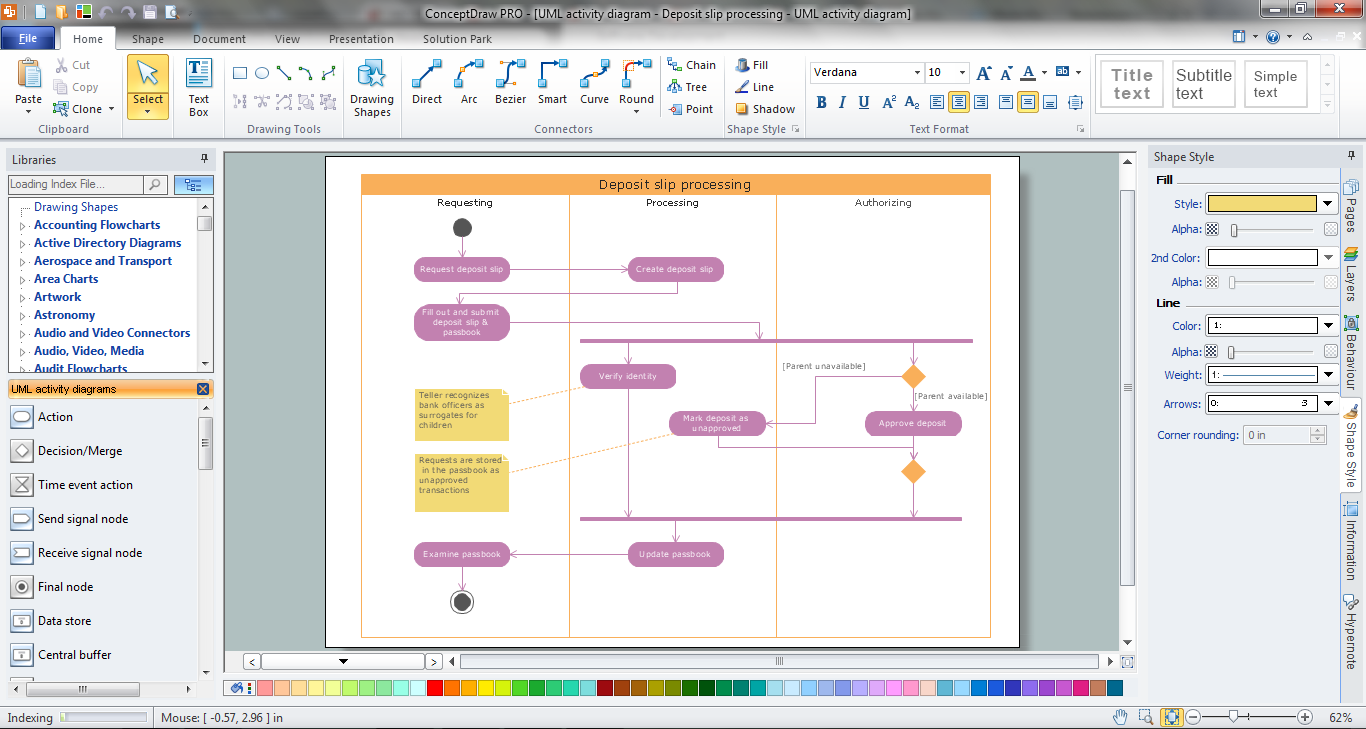
Activity diagram:
Same as Statechart diagrams, such diagrams show the states of objects in the system. The difference is that they can also depict forks for transitions from one state to another. These diagrams can be used to describe behavior algorithms of objects. You may also use them to create flow charts.

Pic.4. UML activity diagram
In ConceptDraw DIAGRAM such diagrams are represented in the UML Activity Diagram library.
Sequence diagram:
A type of interaction diagram. Sequence diagrams describe a sequence of interactions between objects.

Pic.5. UML sequence diagram
To draw such a diagram, use the UML Sequence Diagram library.
Collaboration diagram:
A collaboration diagram is also a type of interaction diagram, but unlike sequence diagrams these diagrams instead of the sequence of interactions between objects describe all variants of such interactions, regardless the sequence.

Pic.6. UML collaboration diagram
Class diagram:
They help to create graphical logical models of a system, further used to create the source code for the classes represented on the diagram.
UML class diagrams describe relationship between classes and interfaces. We recommend to create class diagrams using the Booch OOD template from the ConceptDraw STORE.

Pic.7. UML class diagram
Component diagram:
On diagrams of this type, also known as module diagrams, classes and objects are distributed by components or modules. This is very convenient for designing large systems which may count hundreds of components.

Pic.8. UML component diagram
Use the UML Component Diagram library for drawing diagrams of this type.
All libraries for creating UML diagrams are available inside the ConceptDraw DIAGRAM Templates and samples are located in the Rapid UML section of ConceptDraw STORE.
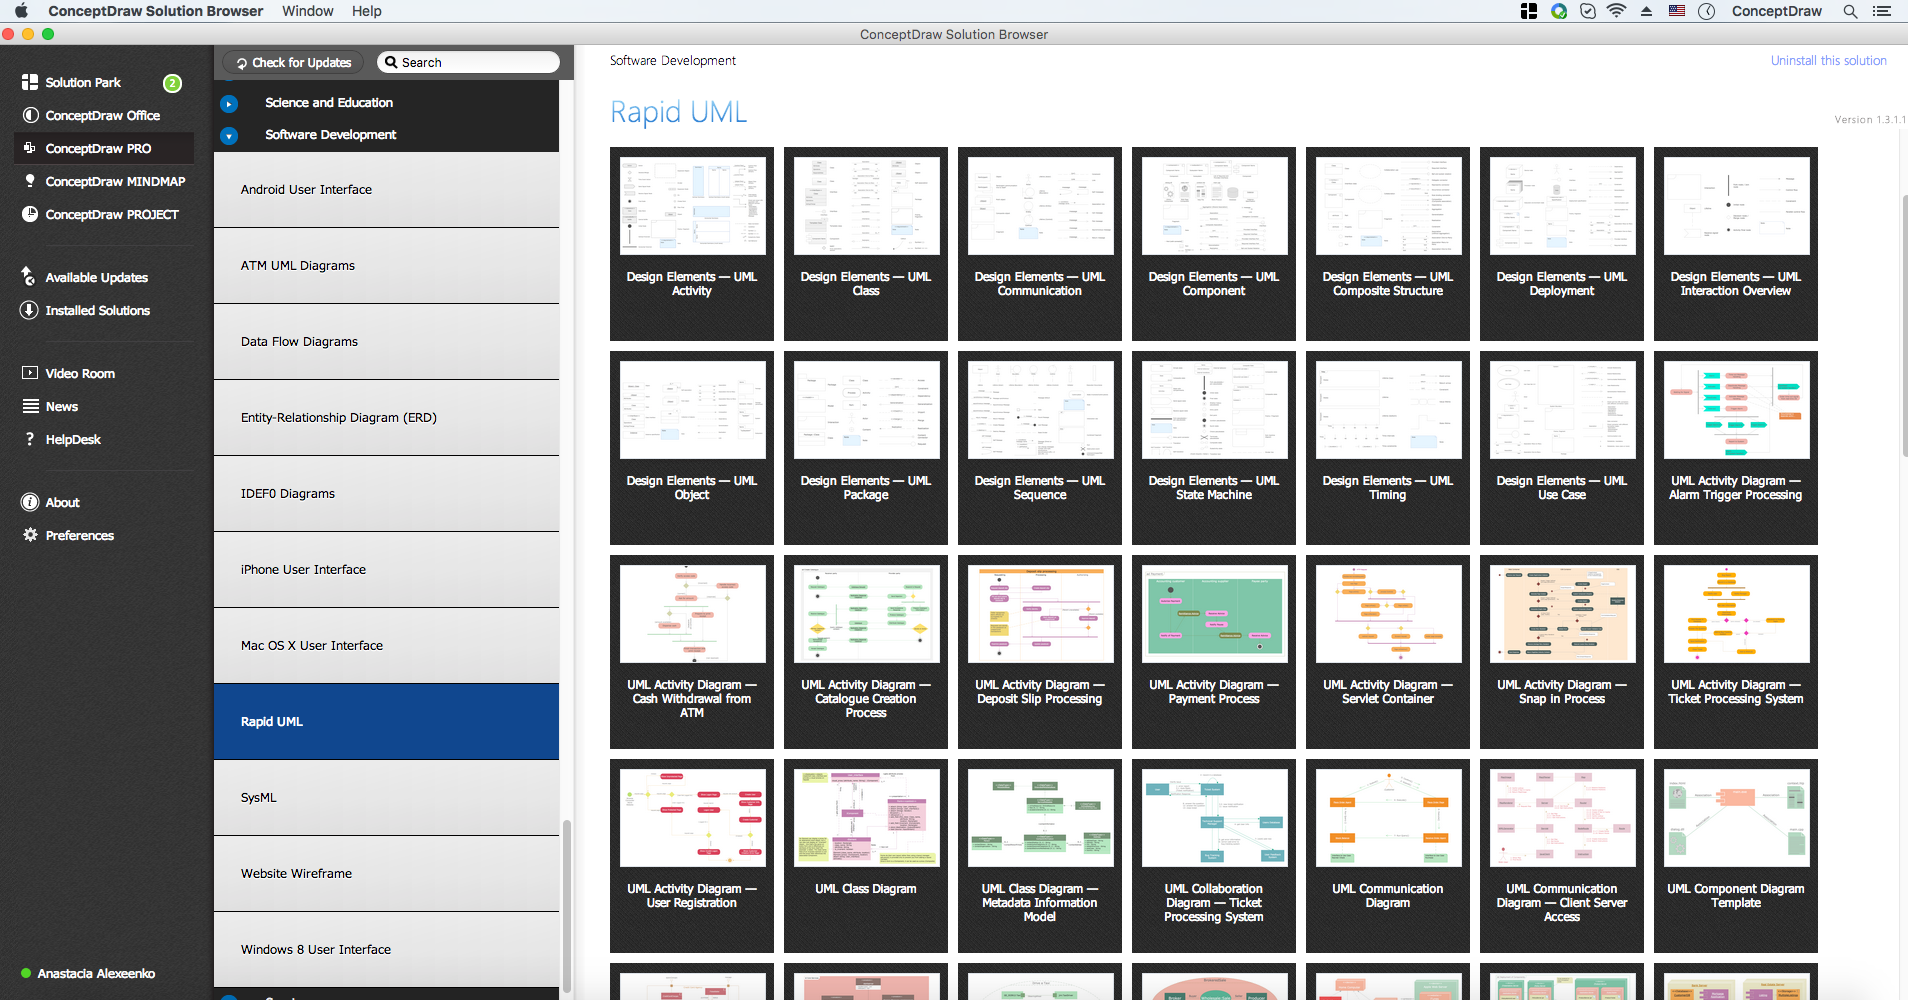
Pic.9. Rapid UML Solution in ConceptDraw STORE
TEN RELATED HOW TO's:
Learn what a workflow diagram is, how it differs from a flowchart, and how to create one step by step. Includes real examples, structural elements, KPIs, and best practices for clearer execution and process improvement.
Picture: WorkFlow Diagram
Related Solution:
Zooko's triangle is known to be a trilemma which is a concept in international economics which states that it is impossible to have a fixed foreign exchange rate, a free capital movement and an independent monetary policy at the same time.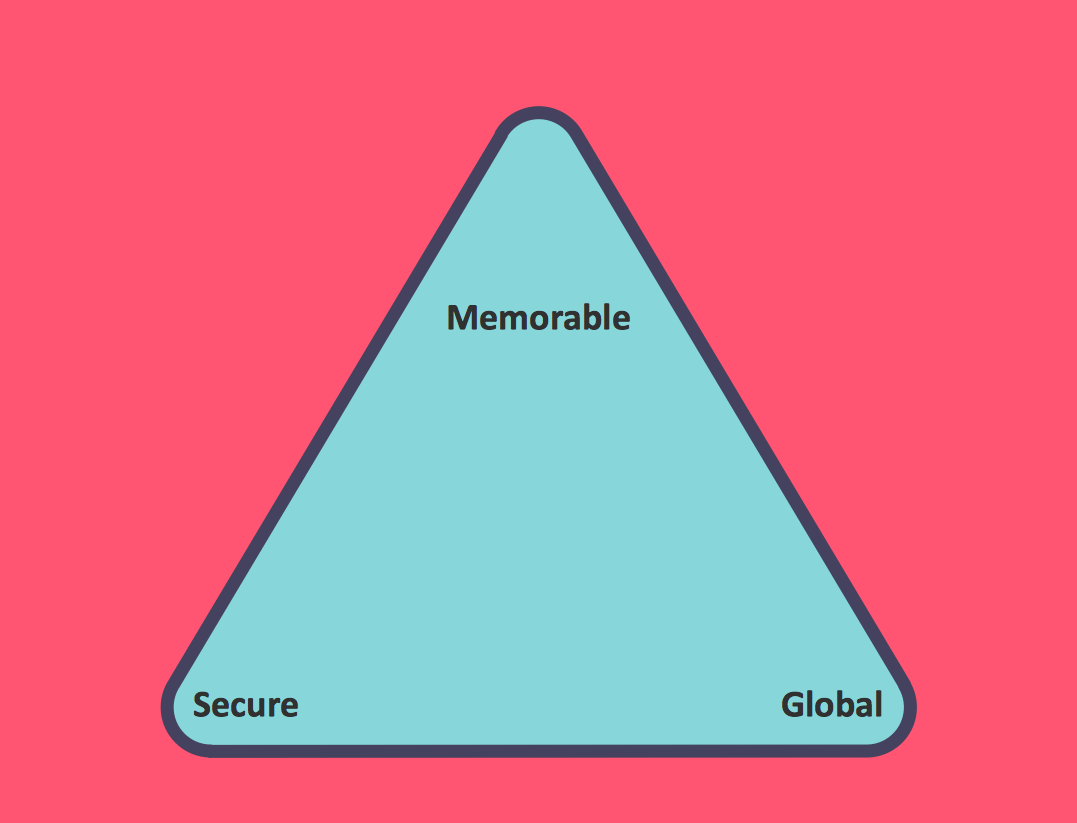
Picture: Pyramid Diagram
Related Solution:
This sample shows the Data Flow Diagram of the Taxi Service and interactions between the Clients, Operators and Divers, as well as Orders and Reports databases.
Picture: Taxi Service Data Flow DiagramDFD Example
Related Solution:
Data structure diagram (DSD) is intended for description of conceptual models of data (concepts and connections between them) in the graphic format for more obviousness. Data structure diagram includes entities description, connections between them and obligatory conditions and requirements which connect them. Create Data structure diagram with ConceptDraw DIAGRAM.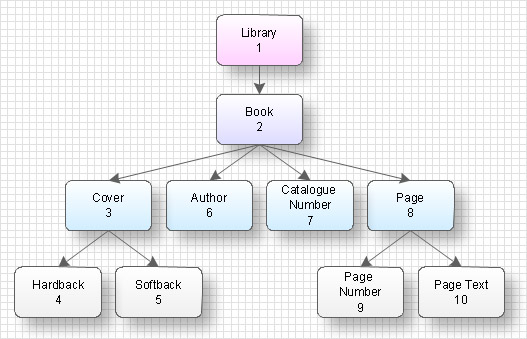
Picture: Data structure diagram with ConceptDraw DIAGRAM
Why do you need network visualizations? 🔸 Unlock the full potential of network visualization with our in-depth guide on using the ConceptDraw Network Visualization Tool. ✔️ Explore features, tips, and best practices to create stunning visual representations of your network architecture
Picture:
Network Visualization Guide.
How to Use ConceptDraw Network Visualization Tool
Related Solutions:
A perfect tool to draw network diagram for bandwidth management. Computer & Networks solution provides the symbol libraries with pre-designed network graphic elements.
Use Computer & Networks solution to draw the network diagrams for bandwidth management for Cisco networks, Apple networks, IVR networks, GPRS networks, wi-fi networks, LAN and WAN.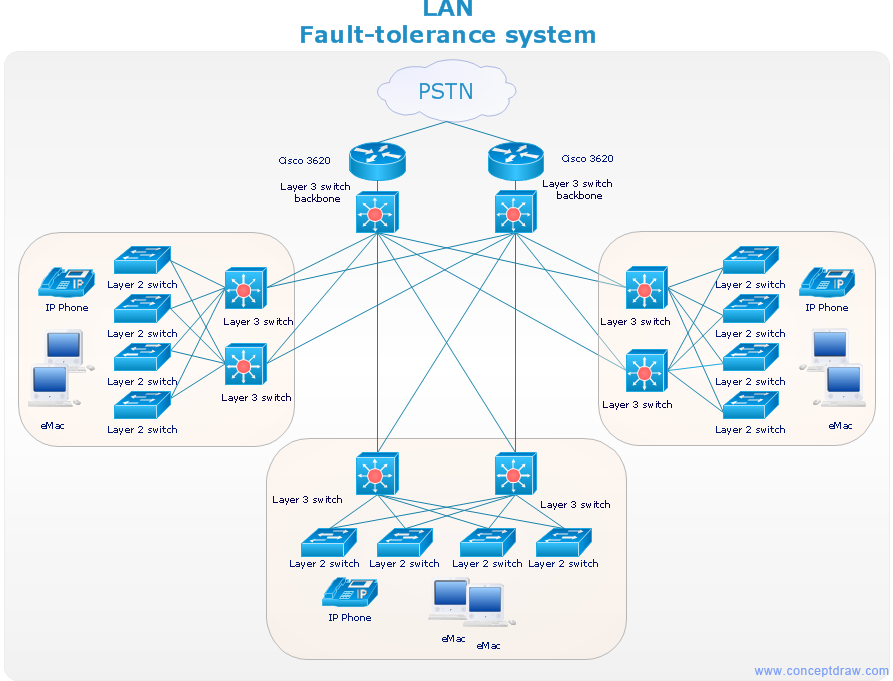
Picture: Network Diagrams for Bandwidth Management
This sample shows the OMT method. It was created in ConceptDraw DIAGRAM diagramming and vector drawing software using the Rapid UML Solution from the Software Development area of ConceptDraw Solution Park.
All diagrams produced with ConceptDraw DIAGRAM are vector graphic documents and are available for reviewing, modifying, and converting to a variety of formats (image, HTML, PDF file, MS PowerPoint Presentation, Adobe Flash or MS Visio XML).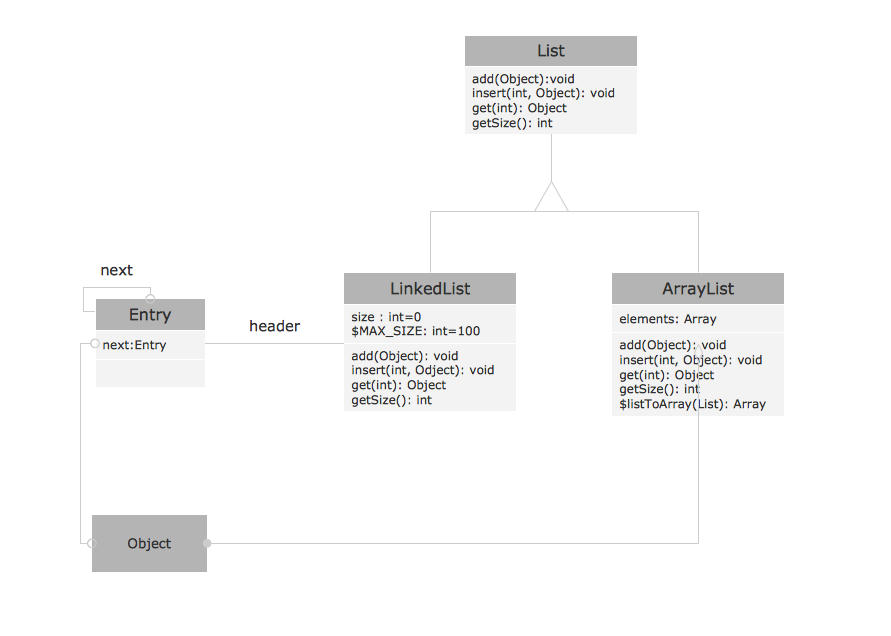
Picture: OMT Method
Related Solution:
Block diagrams solution extends ConceptDraw DIAGRAM software with templates, samples and libraries of vector stencils for creating the block diagram.
Create block diagrams, electrical circuit diagrams, schematics, and more in minutes with ConceptDraw DIAGRAM.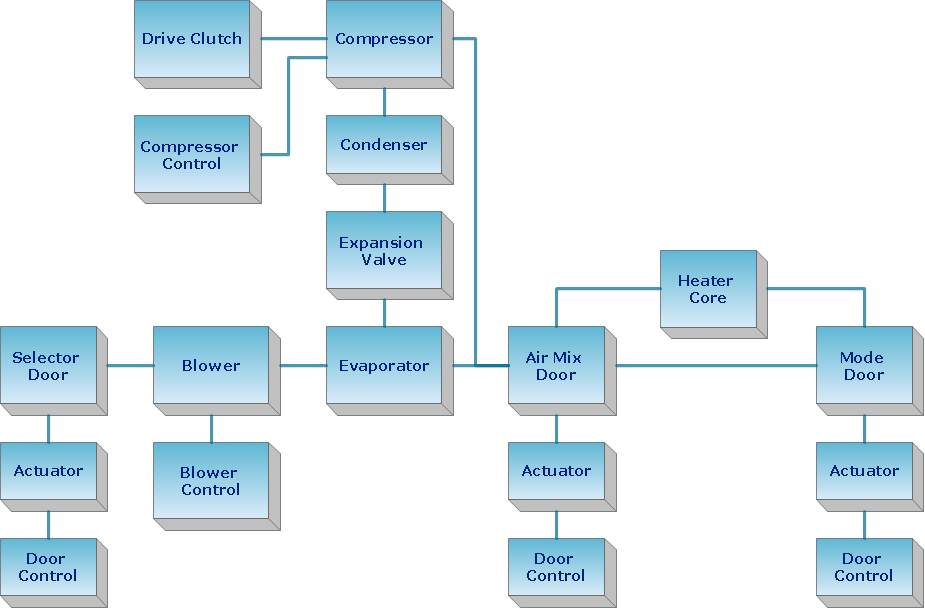
Picture: Create Block Diagram
ConceptDraw DIAGRAM extended with Pyramid Diagrams Solution from the Marketing Area of ConceptDraw Solution Park is a powerful Pyramid Charts making software.
A Pyramid Chart has the form of triangle and hierarchically structures, organizes and help to analyze the information, data or ideas. Triangle is divided on the sections that usually have different widths. The width indicates the level of hierarchy among the topics.
Picture: Pyramid Charts
Related Solution:
When we think about programming, we usually imagine sleepless nights spent on writing kilobytes of code. However, from another point of view, Software development with ConceptDraw DIAGRAM makes a programmer's life endlessly easier. This tool is unique to fulfill all your needs in short period of time.
Over the recent years object-oriented methodology has become more and more widespread. Thanks to this methodology developers manage to deal with growing complexity of applications. More and more programs are written in such programming languages as C++, Java, Visual Basic and Object Pascal. However, the complexity of the designed systems imposes extended requirements as to design of graphic documentation. ConceptDraw possesses powerful tools for designing of technical documentation for object-oriented projects. The libraries included in the package allow to easily draw class hierarchies, object hierarchies and diagrams of data flows with the use of the most popular notations, including UML and Booch notations. And the library for projecting COM-interfaces will spare developers of ActiveX-servers a headache.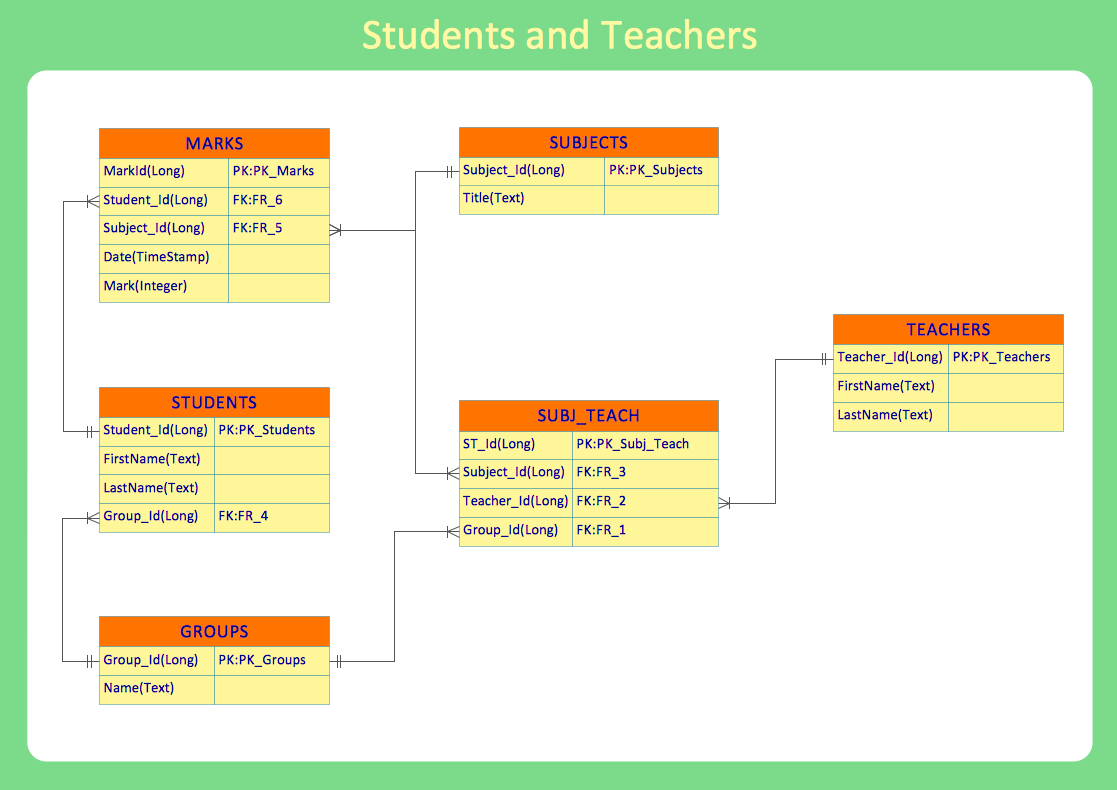
Picture: Software development with ConceptDraw DIAGRAM