UML Collaboration Diagram. Design Elements
UML Collaboration Diagram depicts the interactions between objects or parts in terms of sequenced messages and describes both the static structure and dynamic behavior of a system.
ConceptDraw has 393 vector stencils in the 13 libraries that helps you to start using software for designing your own UML Diagrams. You can use the appropriate stencils of UML notation from
UML Collaboration library:
- Object
- Lifeline (actor)
- Lifeline (boundary)
- Lifeline (entity)
- Lifeline (control)
- Participant communication line to itself
- Link
- Message
- Association role
- Fragment
- Symbol << >>
- Note
- Association role (Smart)
- Multi object
- Composite object
- Return message
- Call message
- Asynchronous message
- Flat message
- Self message
- Self message (rectangular)
- Constraint
- Text label

Pic.1. UML Collaboration Diagram Library

Pic.2. UML Collaboration Diagram Library Elements
ConceptDraw Rapid UML solution provides UML Collaboration Diagram library of vector stencils for drawing the collaboration diagrams using collaboration blocks and assembly connectors.
Use design element from the UML Collaboration Diagram library to draw your own UML collaboration diagrams of complex systems and software applications.
TEN RELATED HOW TO's:
The vector stencils library Crow's Foot Notation from the solution Entity-Relationship Diagrams (ERD) contains specific symbols of the Crow's foot notation such as relationship symbols and entity symbols for ConceptDraw DIAGRAM diagramming and vector drawing software. The Entity-Relationship Diagrams (ERD) solution is contained in the Software Development area of ConceptDraw Solution Park.
Picture: Martin ERD Diagram
Related Solution:
Using diagrams, you can visualize the flow of the information or build a detailed data structure. There's no need to have a degree in software and database design with ConceptDraw DIAGRAM , because this software has all the tools needed in developing models and diagrams. Project planning, designing and prototyping was never so easy.
This UML diagrams can be used to visualize a model of the data base development process. A UML diagram shows a graphical view of a structure of software system: components and relationships.
Using Unified Modeling Language helps to depict logical and physical elements of a data base, visually represent requirements and sub-systems. UML diagrams allows developers to organize and predict critical issues, as well as collaborate data base information.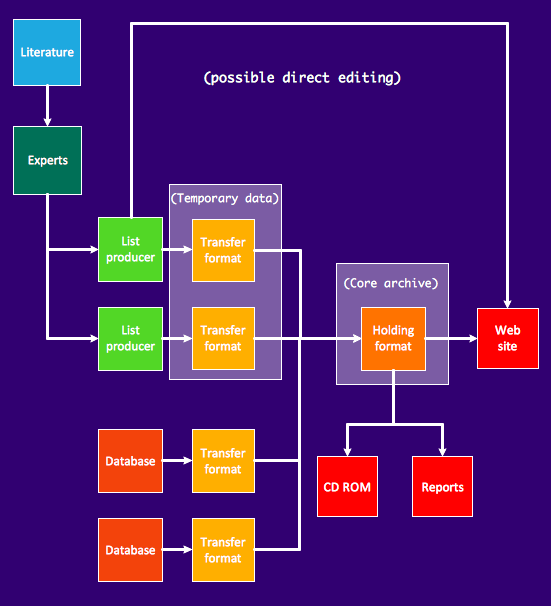
Picture: Software and Database Design with ConceptDraw DIAGRAM
Related Solution:
Unified Modeling Language (UML) is a graphical modeling language for describing, visualizing, projecting and documenting of object oriented systems. UML digram is used for modeling of organizations and their business processes, for development the big projects, the complex software applications. Comprehensive UML diagram allows to create the set of interrelated documents that gives the complete visual representation of the modeling system.
Picture: UML Sample Project
Related Solution:
This sample was created in ConceptDraw DIAGRAM diagramming and vector drawing software using the UML Class Diagram library of the Rapid UML Solution from the Software Development area of ConceptDraw Solution Park.
This sample shows the transport protocol mappings for SNMP (Simple Network Management Protocol), the classes of the transport system and relationships between them and is used in IP network.
Picture: UML Class Diagram Example for Transport System
Related Solution:
Collaborating with co-workers is very important, not only in order to get things done effectively, but also to keep in touch with the outside world. Great way for business collaboration is Skype.
Picture: Online Collaboration via Skype
Related Solution:
Interactive tool helps you find the appropriate response to social media mentions quickly. There are materials to help trainers and consultants develop a social media strategy and provide training for social media groups on how to effectively accomplish their daily work.
Picture: How to Present a Social Media Response Plan DFD to Your Team
Related Solution:
UML Timing Diagram as special form of a sequence diagram is used to explore the behaviours of objects throughout a given period of time.
Picture: Timing diagram
Related Solution:
Electrical Engineering Solution used together with ConceptDraw DIAGRAM drawing facilities makes short a work of drawing various electrical and electronic circuit schemes. A library of vector objects composed from symbols of Analog and Digital Logic elements of electric circuit includes 40 symbolic images of logic gates, bistable switches of bi-stable electric current, circuit controllers, amplifiers, regulators, generators, etc. All of them can be applied in electronic circuit schemes for showing both analog and digital elements of the circuit.
Electrical Engineering Solution used together with ConceptDraw DIAGRAM drawing facilities makes short a work of drawing various electrical and electronic circuit schemes. A library of vector objects composed from symbols of Analog and Digital Logic elements of electric circuit includes 40 symbolic images of logic gates, bistable switches of bi-stable electric current, circuit controllers, amplifiers, regulators, generators, etc. All of them can be applied in electronic circuit schemes for showing both analog and digital elements of the circuit.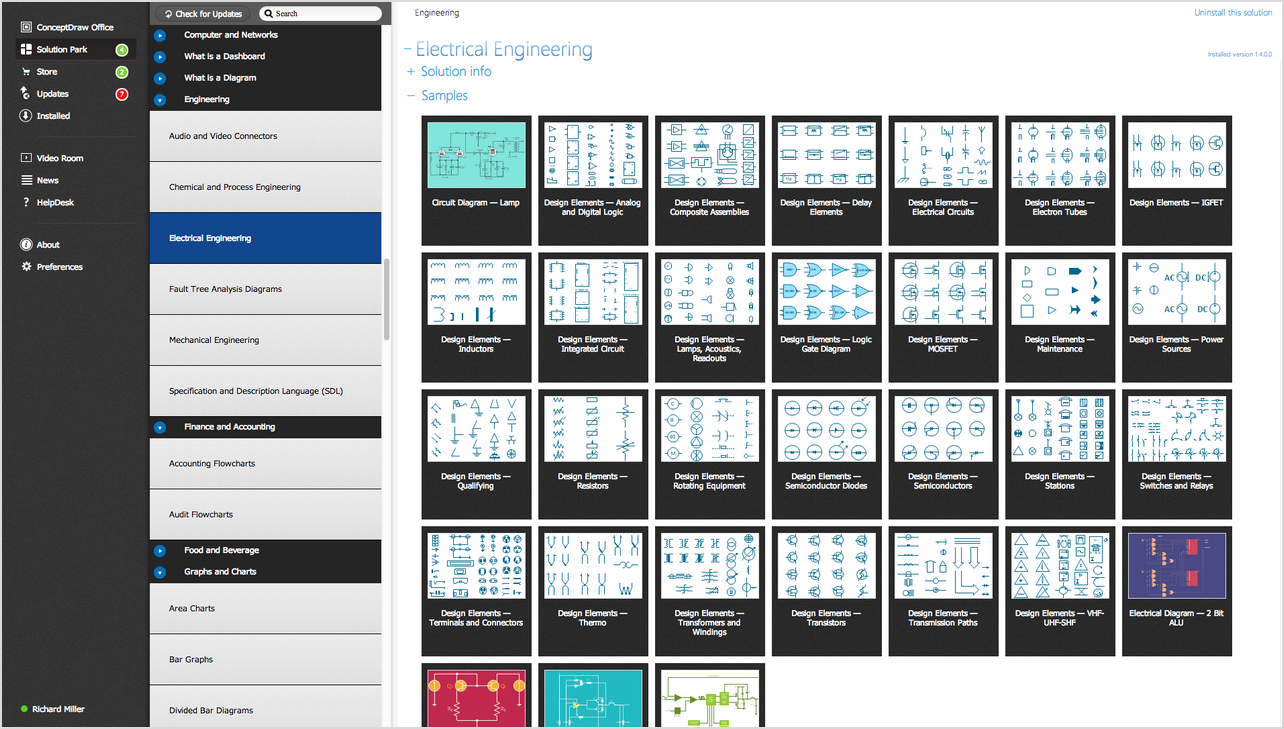
Picture:
Electrical Diagram Symbols F.A.Q.
How to Use Electrical ConceptDraw Diagram Software
Related Solution: