UML Component Diagram
ConceptDraw helps you to start using software for shematic UML Component Diagrams with two examples and template.
UML Component Diagrams are used to illustrate the structure of arbitrarily complex systems and illustrates the service consumer - service provider relationship between components.
You can use the appropriate stencils of UML notation for drawing own UML Component Diagrams. UML Component Diagrams describes how a software system is split up into components and shows the dependencies among these components.
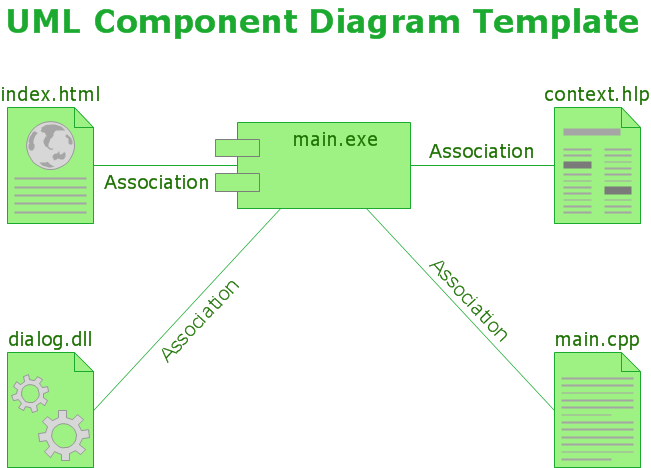
Pic. 1. UML component diagram template
This UML component diagram template is created using ConceptDraw DIAGRAM diagramming and vector drawing software enhanced with Rapid UML solution from ConceptDraw Solution Park.
Rapid UML solution provides templates, examples and libraries of stencils for quick and easy drawing the all types of system and software engineering diagrams according to UML 2.4 notation.
Use ConceptDraw DIAGRAM with UML component diagram templates, samples and stencil library from Rapid UML solution to visually model the system components and dependencies between them.
TEN RELATED HOW TO's:
Diagrams are a very important part of modern life. With the help of flow diagram software, a lot of companies can promote their ideas at the market. Its usefulness is totally doubtless.
This is a flow chart of the invoice payment flow. This flowchart details decrypts all stages of the process of obtaining and paying bills. It is a description of the universal process - such steps performs accounting departments of almost any organization. Since every business no matter what it does is a consumer of some goods or services. The given flow chart was made using ConceptDraw DIAGRAM software and the Diagrams solution for making flowcharts of any kind.
Picture: Flow Diagram Software
Related Solution:
Use the libraries from the Block Diagrams solution to draw block diagrams for your business documents, presentations and websites in a few minutes.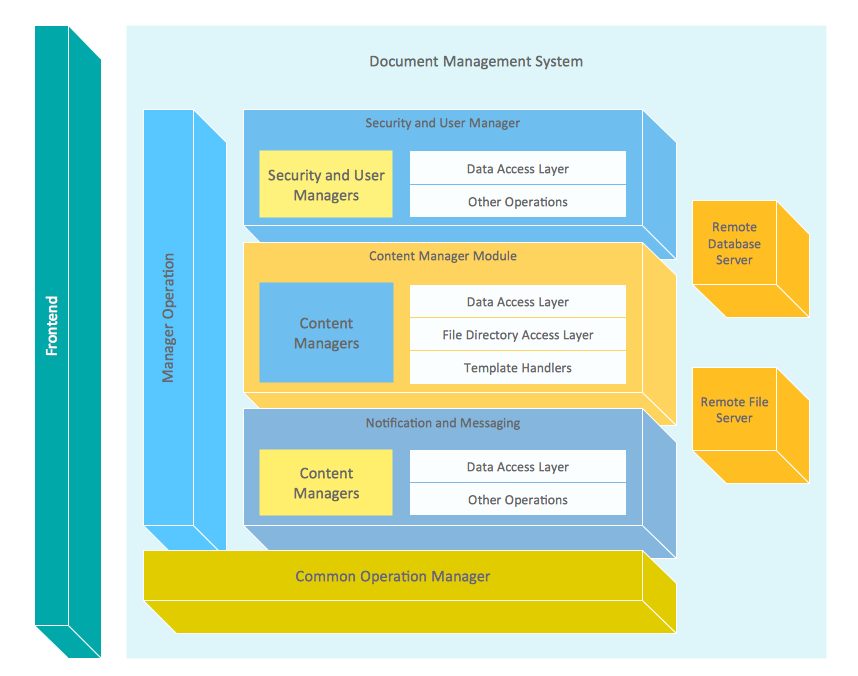
Picture: Block Diagram
Related Solution:
There are a lot of structured analysis and design technique methodologies used to describe systems and data sources. To visualize data structures, data flow diagrams can be used for various purposes in the area of software engineering. Nowadays these diagrams are also used in the area of business analysis and information system analysis.
This data flow diagram depicts an account processing system of a typical account department of a small manufacturing enterprise. It shows the data transmission through the order processing to shipping verification. This data flow diagram was created according to standard of Yourdon and Coad notation. The vector graphic objects of Yourdon/Coad notation symbols was delivered by ConceptDraw Data Flow Diagrams solution. The current DFD can be employed as an example of a business process model, representing the set of business events and interactions commonly engaged in a accounts receivable process.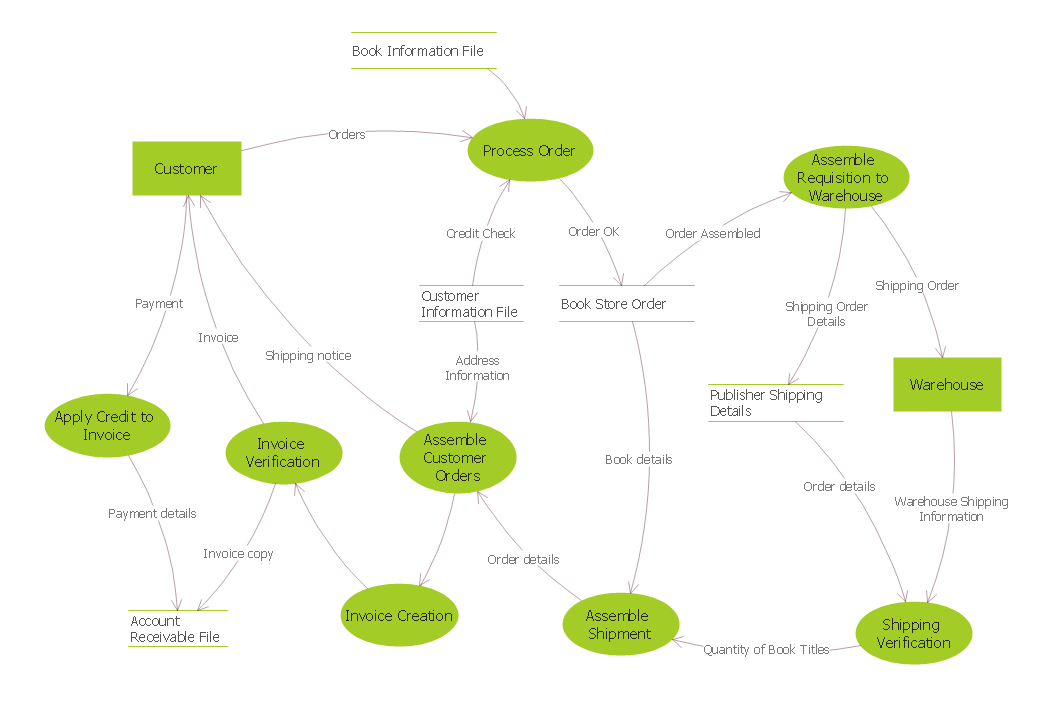
Picture: Data Flow Diagrams
Related Solution:
Why do you need a business process flow diagram? How to use business process diagram software? Explore ✔️ the significance, ✔️ creation process, and ✔️ discover cutting-edge software solutions designed to streamline and optimize your workflows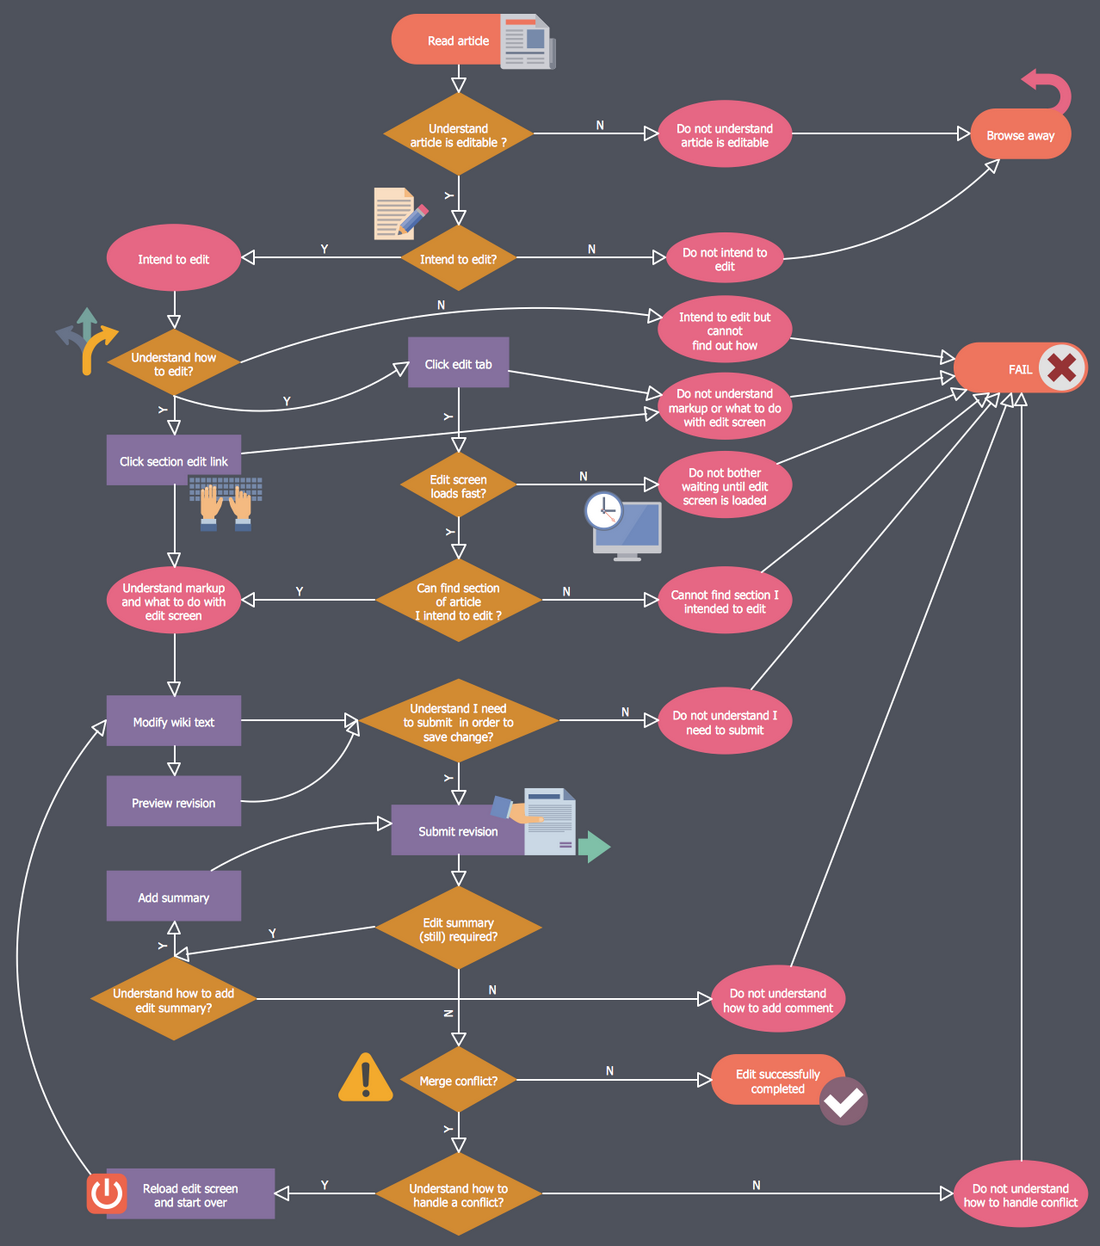
Picture: Business Process Workflow Diagrams & Software
Related Solution:
Design efficiently the technical flow charts in ConceptDraw DIAGRAM software for various fields and provide ✔️ clarity, ✔️ accuracy, ✔️ usability, ✔️ simple communication, analysis, and improvement
Picture: Technical Flow Chart Example
Related Solution:
Functional modeling allows to make complex business processes simple. One of the basic methods is IDEF0 and one of the most effective also. To create a business model, use flowchart symbols.
The IDEF0 library, supplied with ConceptDraw IDEF0 Diagrams solution contains 18 IDEF0 basic notation symbols. All symbols are the vector graphic images what means, that one can customize their size preserving the stable quality. Another library of IDEF0 symbols can be find out in the the Business Process Diagrams solution, included to the Business Processes section of ConceptDraw Solution Park. These libraries composed from just vector objects and are totally compatible. You can apply the IDEF0 symbols from both libraries at your flowcharts, if needed.
Picture: IDEF0 Flowchart Symbols
Related Solution:
The best way to visualize the introduction to Cloud computing architecture is to create diagrams and schematics representing what is a cloud computing and how it works. For their design, we recommend to use a powerful ConceptDraw DIAGRAM diagramming and vector drawing software supplied with Cloud Computing Diagrams solution from the Computers and Network area of ConceptDraw Solution Park
Picture: Introduction to Cloud Computing Architecture
Related Solution:
A flowchart can take any process and distil it into a series of actions or decisions; it is a versatile and simple form of diagram that can be used to describe situations in any field, and is easily understood by everyone. They are used frequently in business to document workflows from all areas of a company - they can show accounting purchase orders, human resource recruitment strategy, or a product life cycle.
ConceptDraw DIAGRAM diagramming and vector drawing software extended with Flowcharts Solution from the Diagrams Area of ConceptDraw Solution Park is a perfect powerful tool for extremely easy designing professional looking Flow Diagram.
Picture: Flow Diagram
Related Solution:
This sample illustrates the Floor Plan of mini hotel representing the arrangement of hotel rooms, dining hall, and other premises all of them furnished. This is necessary for construction a hotel and is helpful for booking rooms for accommodation.
This sample was created in ConceptDraw DIAGRAM diagramming and vector drawing software using the Floor Plans Solution from the Building Plans area of ConceptDraw Solution Park.
Picture: Hotel Floorplan
Related Solution:
The ability to develop UML diagrams as quickly as the ideas come. The solution uses ConceptDraw RapidDraw techniques. The result is a vector graphic document.
Picture: Introductory Guide to Rapid UML Solution
Related Solution: