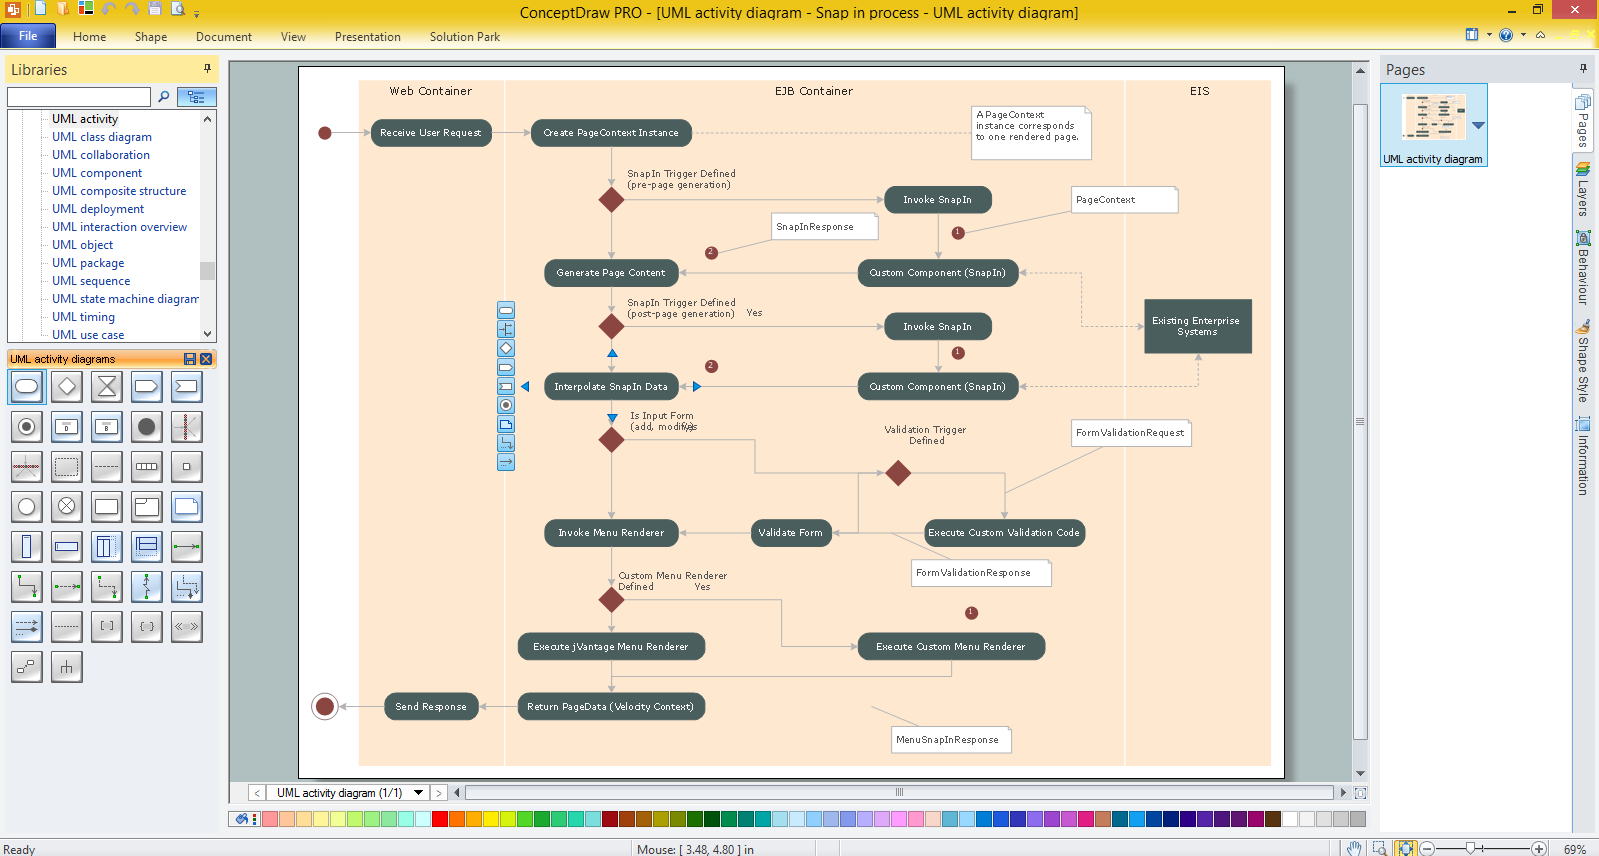
UML Activity Diagram. Design Elements
UML Activity Diagram is a type of Behavior Diagrams that graphically describes decomposition of the some activity on the components.
Activity Diagrams are used in modeling of business processes, technological processes, sequential and parallel computations.
UML Activity Diagram allows to show the sequence, branching and synchronization of processes.
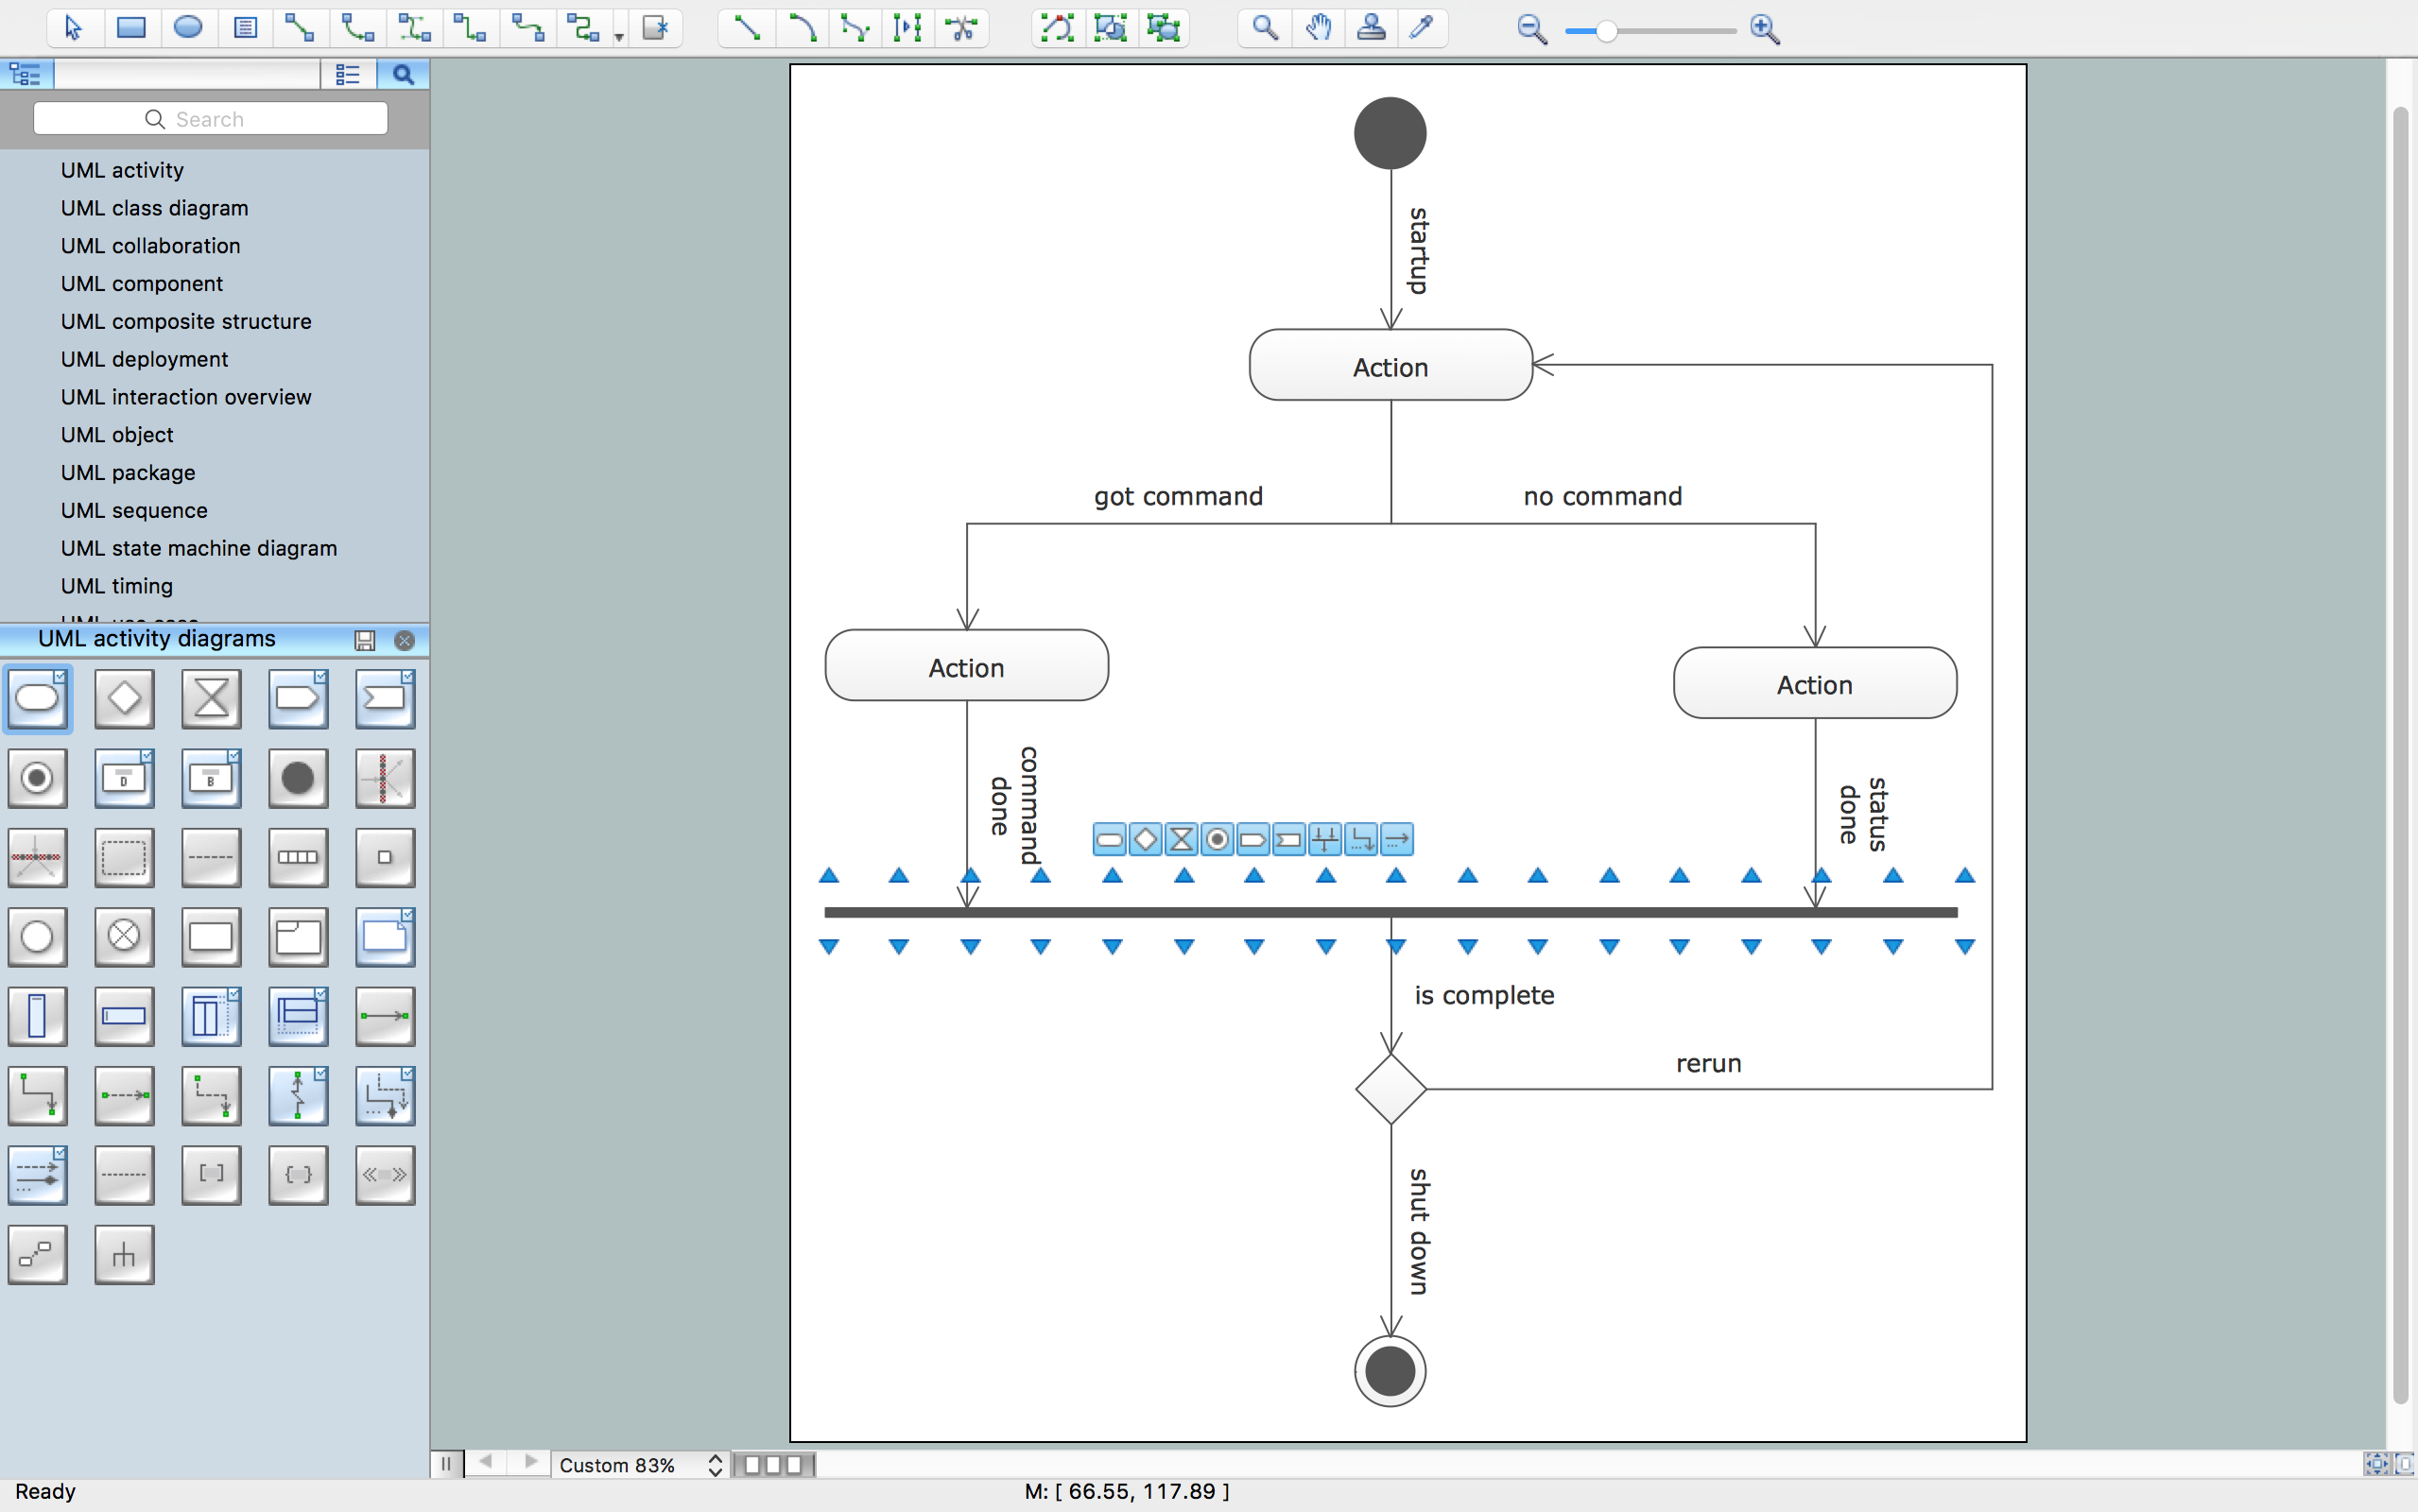
To design UML Activity Diagrams use the following shape types:
- rounded rectangles to describe the actions;
- diamonds to describe decisions;
- bars to represent the start or end of the activities that occur at the same time;
- black circle to indicate the start of the workflow;
- encircled black circle to indicate the end of the workflow;
- arrows to represent the order in which activities happen.
Activity Diagrams were a specialized form of the State Diagrams in UML 1.x. In UML 2.x, the Activity Diagrams were reformed and now are based on Petri net-like semantics that allows to model a lot more situations.
The Rapid UML Solution for ConceptDraw DIAGRAM contains 13 vector stencils libraries with 393 interactive shapes that you can use to design your UML diagrams.
To design an Activity Diagram use the UML Activity Diagram library.
UML Activity Diagram library contains 37 shapes:
- Object
- Data store
- Central buffer
- Expansion region
- Control flow (direct)
- Control flow (smart)
- Object flow (direct)
- Object flow (smart)
- Divider
- Decision/Merge
- Time event action
- Send signal node
- Receive signal node
- Expansion node
- Pin
- Vertical fork/join
- Horizontal fork/join
- Vertical swimlane
- Horizontal swimlane
- Connector
- Initial node
- Final node
- Flow final
- Control flow
- Condition
- Symbol { }
- Symbol << >>
- Subactivity state
- Call behavior
- Frame, fragment
- Note
- Action
- Swimlanes (vertical)
- Swimlanes (horizontal)
- UML connector (direct)
- UML connector
- Note connector

Pic.1. UML Activity Diagram Library

Pic.2. UML Activity Diagram Library Elements
ConceptDraw Rapid UML solution provides UML Activity Diagram library of vector stencils for activity diagram design elements like rounded rectangles of activities, diamonds of decisions, bars of the start (split) or end (join) of concurrent activities, black circle of the start (initial state) of the workflow, encircled black circle of the end (final state), etc.
Use UML Activity Diagram library to draw your own activity diagrams that show the business and operational stepwise workflows of components in your system.


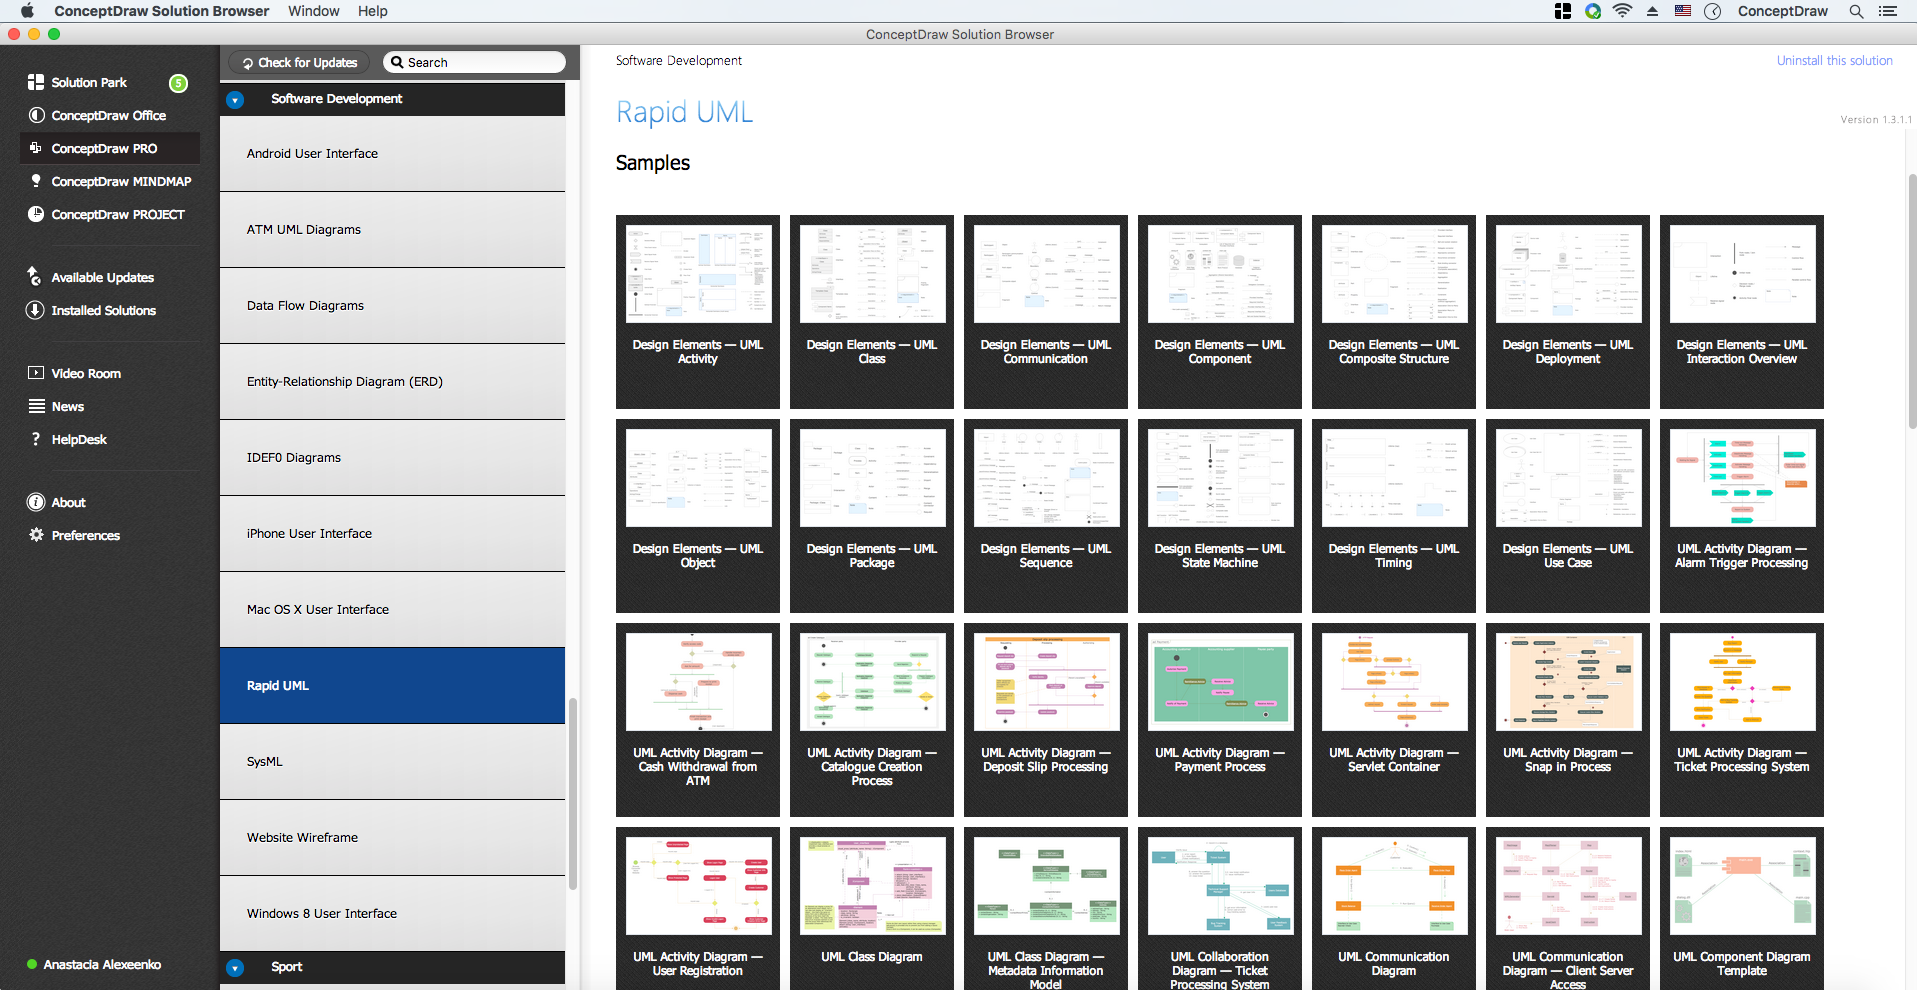
All libraries for creating UML diagrams are available inside the ConceptDraw DIAGRAM Templates and samples are located in the Rapid UML section of ConceptDraw STORE.

TEN RELATED HOW TO's:
Now it’s easy to share your visual documents with other people in a form most convenient for them.
ConceptDraw DIAGRAM can save your drawings and diagrams in a number of highly useful formats, including graphic files. You can save your drawing as a.PNG,.JPG, or other graphic format file.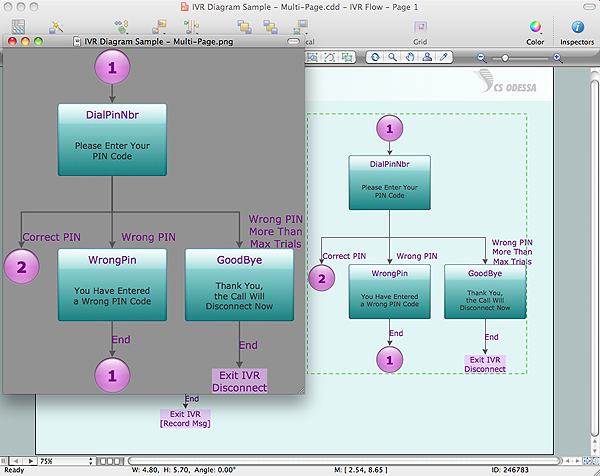
Picture: Export from ConceptDraw DIAGRAM Document to a Graphic File
In software engineering, a UML Class Diagrams is a type of static structure diagram that is used both for general conceptual modeling of the systematics of the application, and for detailed modeling translating the models into programming code.
Use ConceptDraw DIAGRAM with UML class diagram templates, samples and stencil library from Rapid UML solution to show the classes of system, their attributes, operations or methods, and the relationships among the classes.
Picture: UML Class Diagrams. ConceptDraw DIAGRAM - Diagramming Software for Design UML Diagrams
Related Solution:
How should diagramming software work? Is it possible to develop a diagram as quickly as the ideas come to you? The innovative ConceptDraw Smart Connectors Technology - This is more than enough versatility to draw any type of diagram with any degree of complexity.
Connection points are necessary for diagramming network, flowchart and organizational charts. In ConceptDraw you connect shapes by attaching, or snapping and gluing, connectors to shape connection points.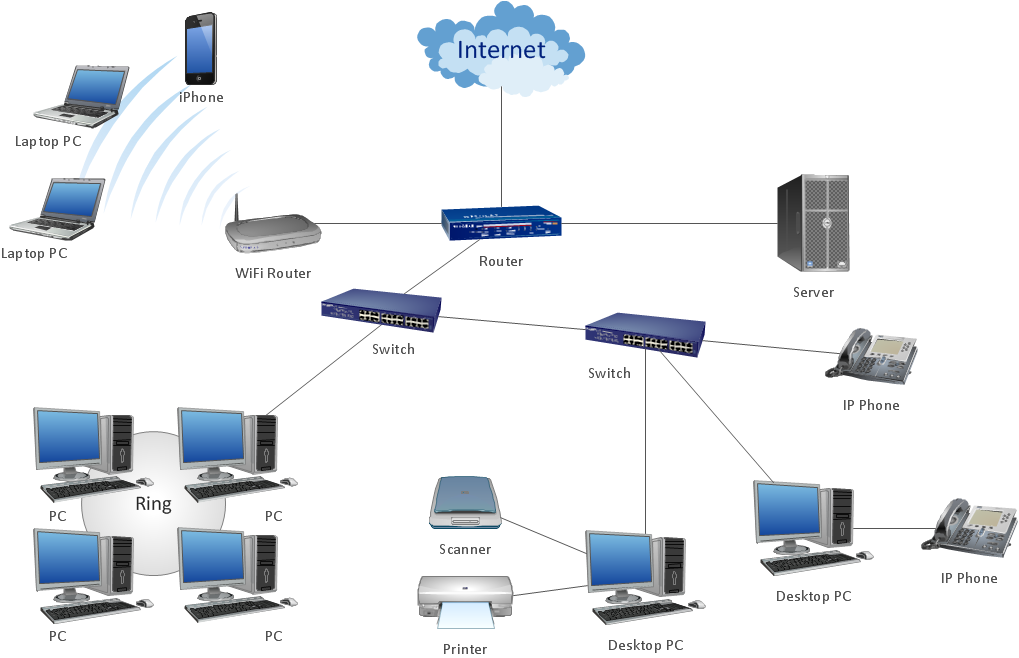
Picture: ConceptDraw Arrows10 Technology
An abstract representation is usually the first thing you will need while developing a database. To understand the ways that databases are structured, you should look through entity-relationship diagram examples and see the notations features and attributes. With an entity-relationship model you can describe a database of any complexity.
This Entity-relationship diagram is a tool for software developers. It enables every element of database to be managed, communicated and tested before release. This ERD was created using symbols advocated by Chen's notation. Because of a linguistic origin of the Chen’s notation, the boxes representing entities could be interpreted as nouns, and the relationships between them are in verb form, shown on a diagram as a diamond.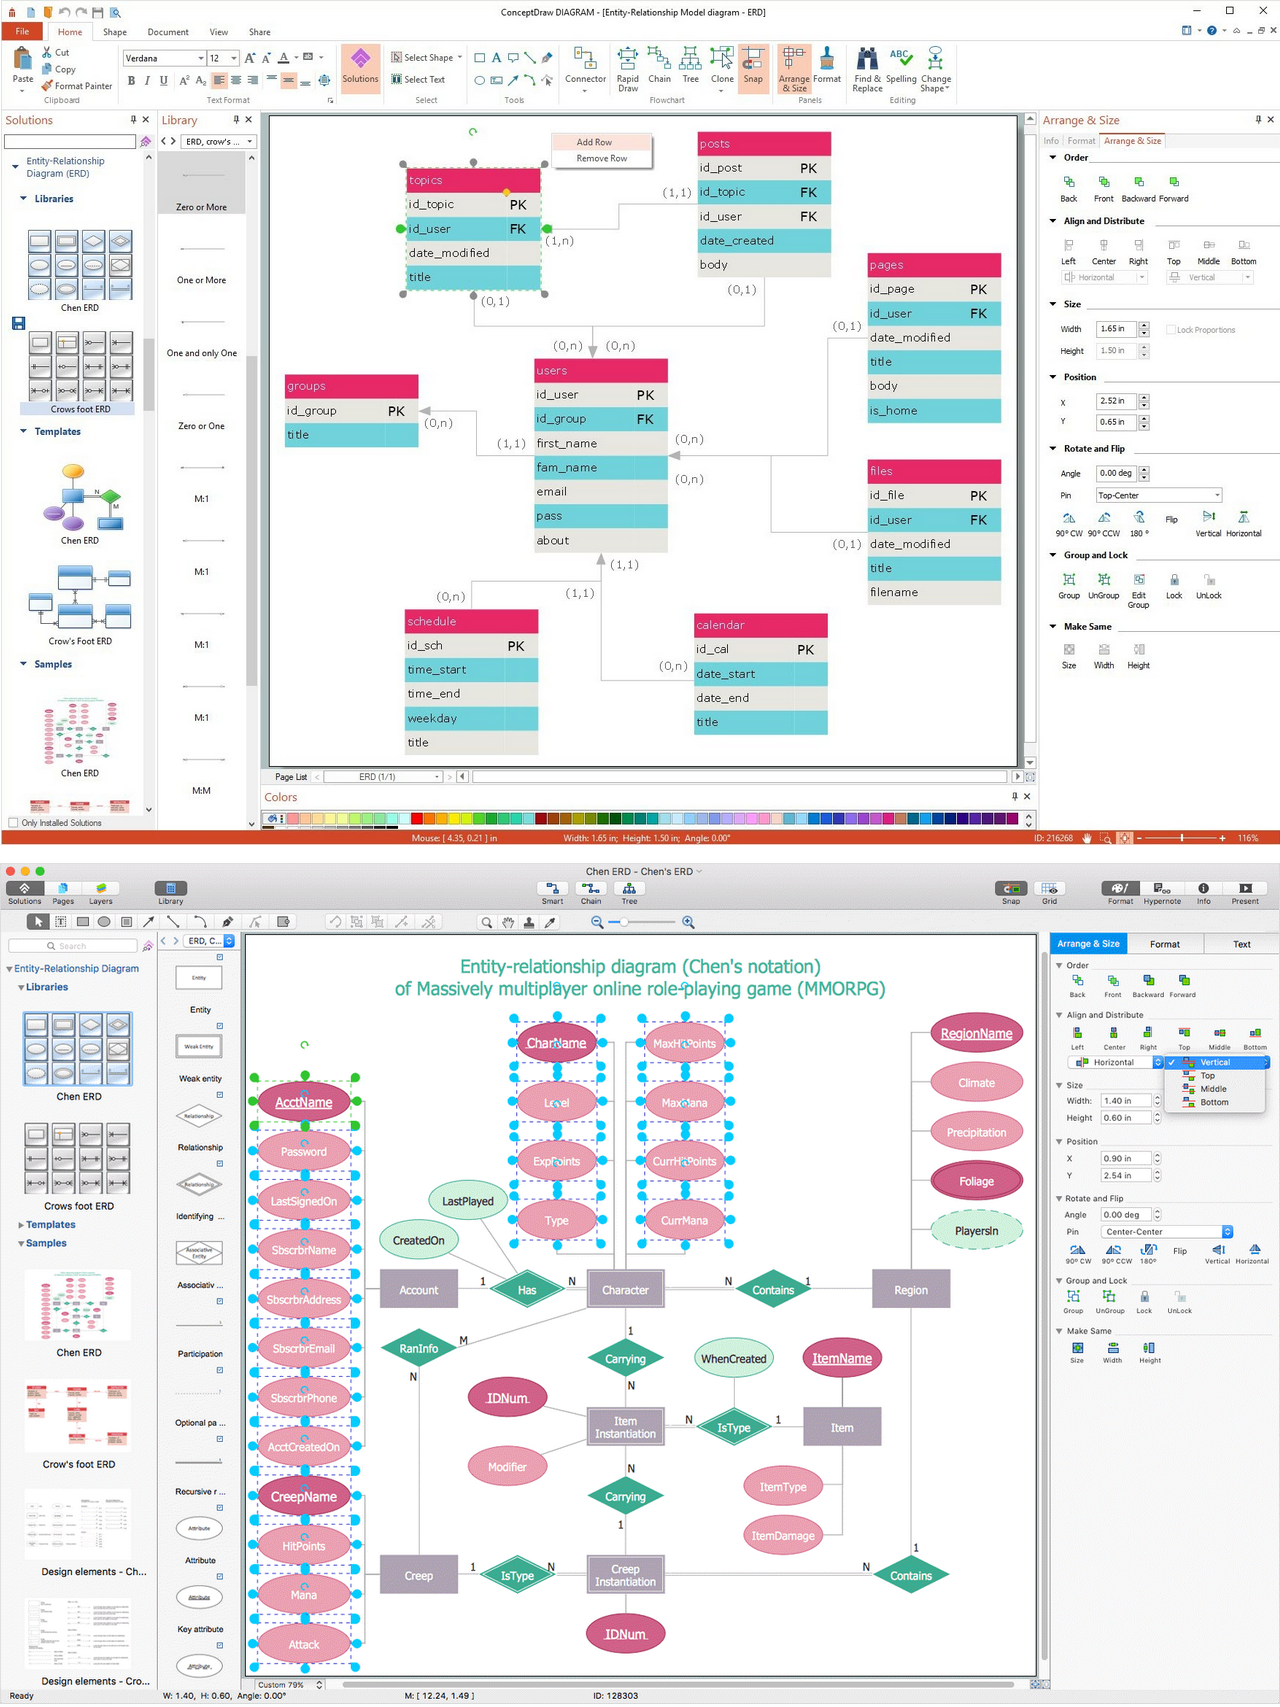
Picture: Entity Relationship Diagram Examples
Related Solution:
UML state machine's goal is to overcome the main limitations of traditional finite-state machines while retaining their main benefits.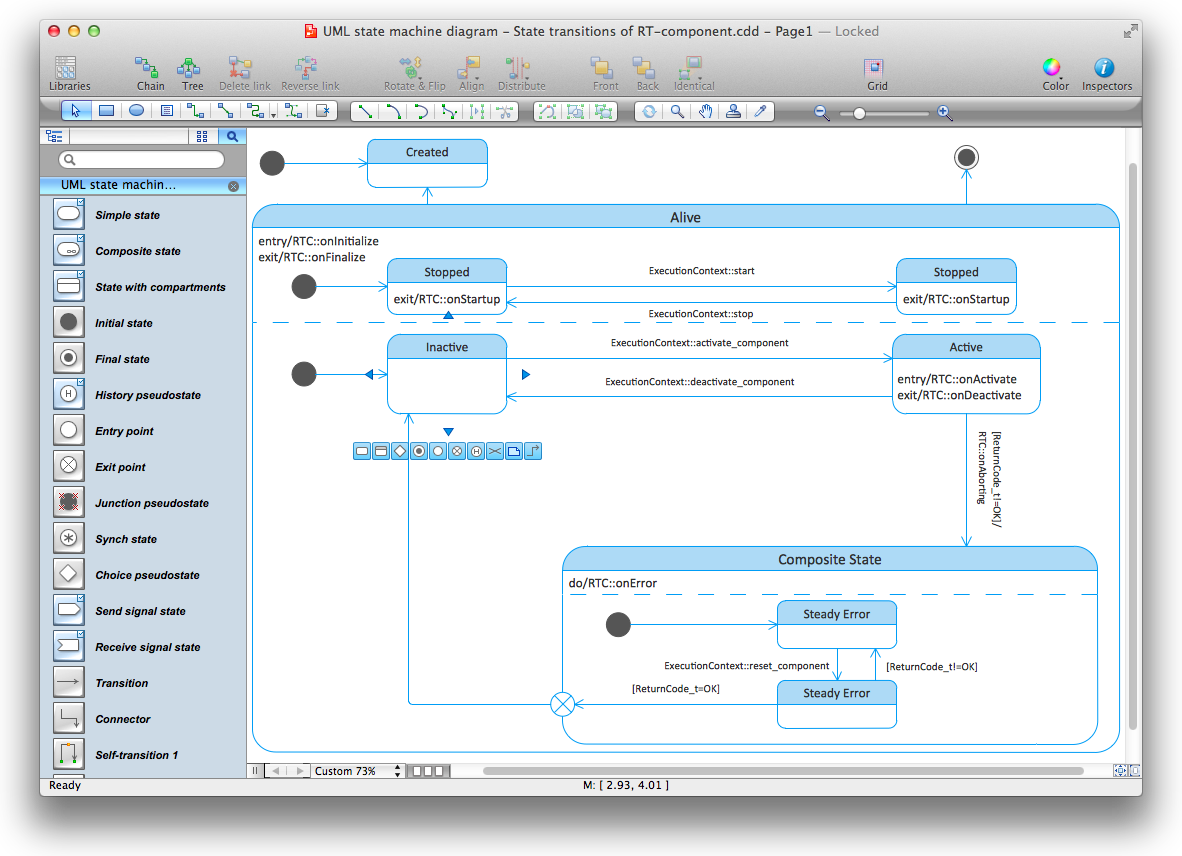
Picture: Diagramming Software for Design UML State Machine Diagrams
UML Sequence Diagram shows object interactions arranged in time sequence, how processes operate with one another and in what order and illustrate the sequence of messages exchanged between the objects and classes involved in the scenario.
Picture: UML Sequence Diagram. Design Elements
When we start to speak about databases, we must always mention database structure visualization. One of the most common ways to do it is to create an entity relationship diagram, and to put appropriate symbols on it. It is important either for database projecting and for its' future maintenance.
Entity Relationship Diagram describes data elements and their relationships within a database. There are a set of special symbols that depict each element of an entity relationship diagram. Entities - represents some stable components such as supplier, employee, invoice, client, etc. Relation symbols show how the entities interact. Attributes define characteristics of the relationships. Attributes can be one-to-one or many-to-many. Physical symbols is used in the physical models. They represent items such as fields, tables, types and keys. ERD physical symbols are the building material for the database. Notation lines are used to illustrate the relationships. The most common method is Crow’s Feet notation. You can use ConceptDraw Entity-Relationship Diagram (ERD) solution to represent a database using the Entity-Relationship model.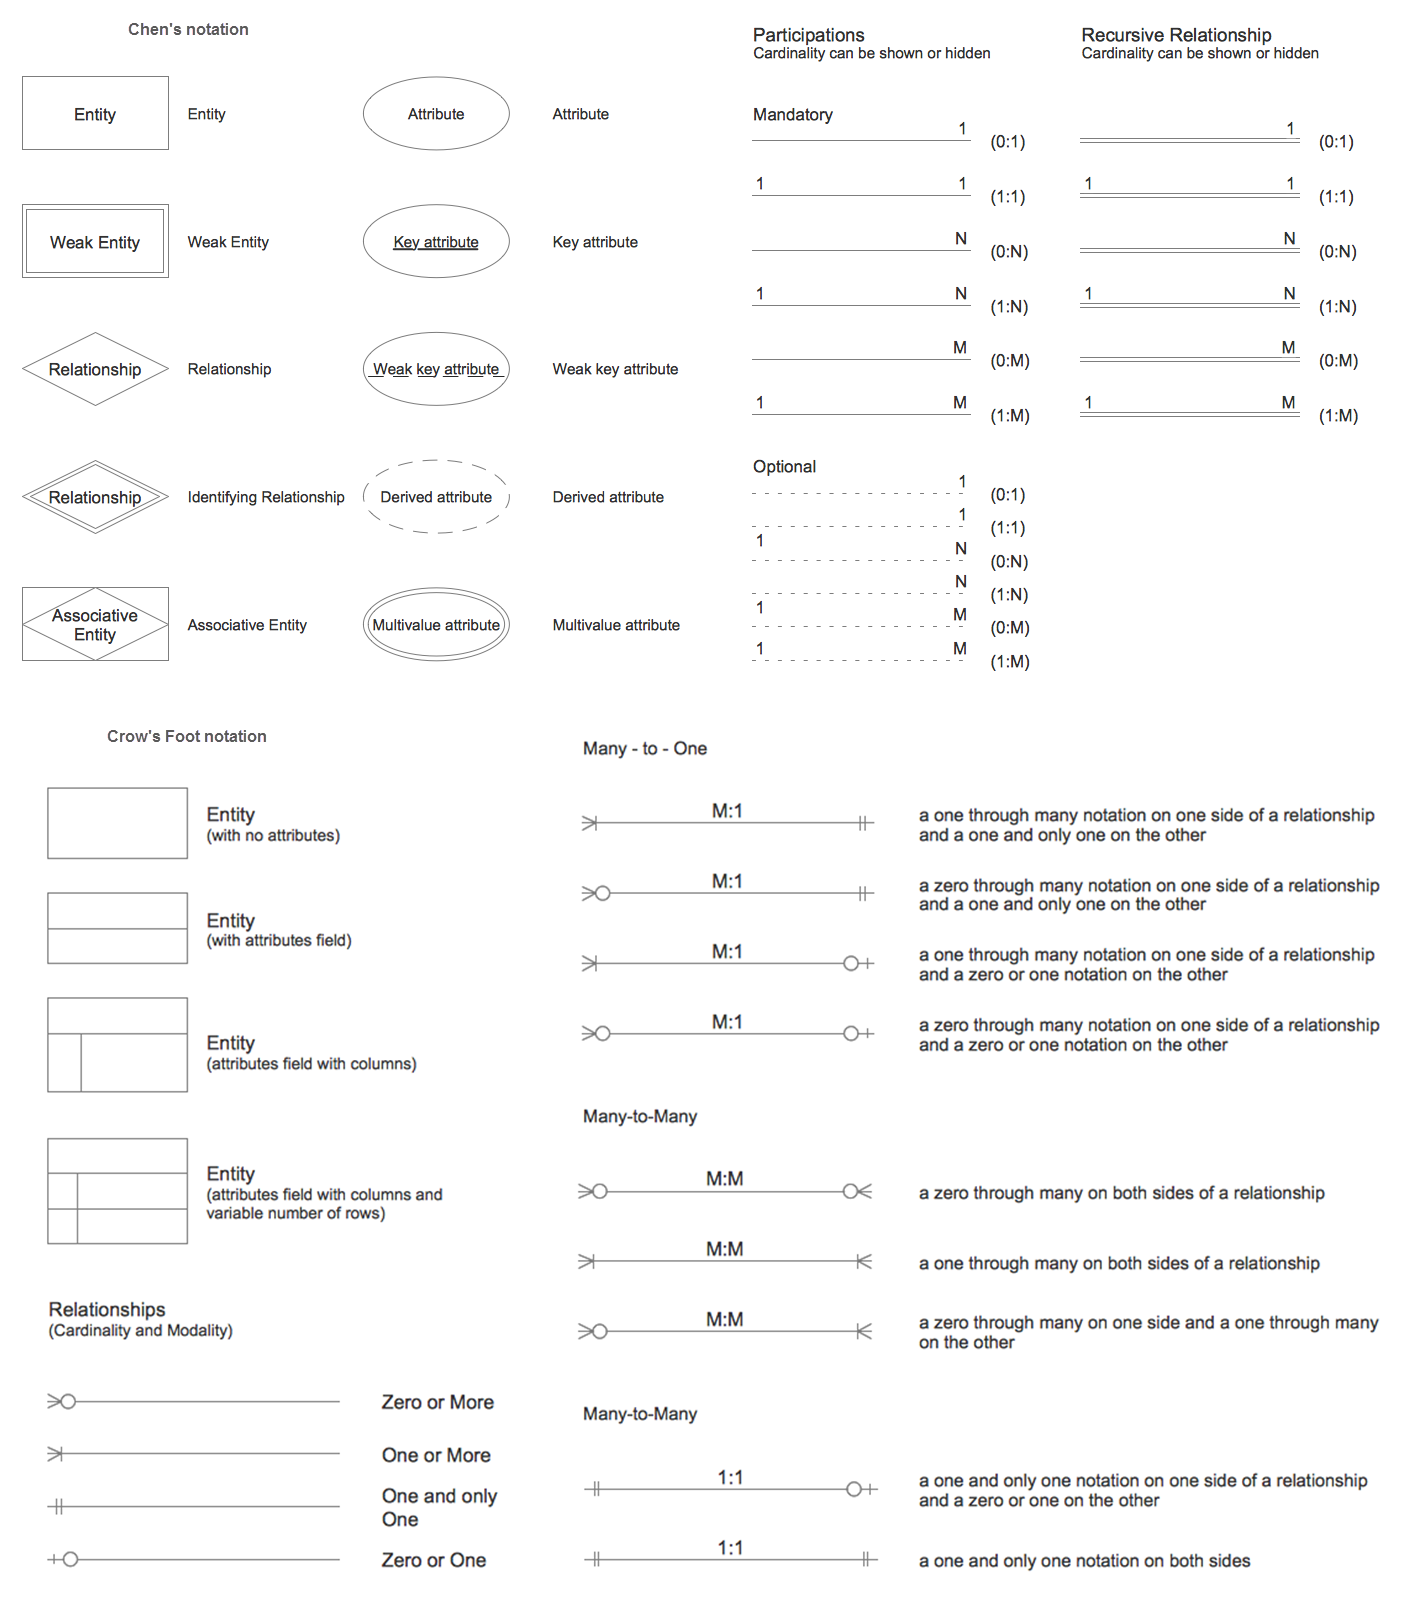
Picture: Entity Relationship Diagram Symbols
Related Solution:
While developing software, it is very important to have a visual model, because it helps to represent the logic and the architecture of an application. Experienced engineers use UML diagrams to denote relationships between classes and their instances. UML is a general language for a set of diagrams like deployment diagrams, object diagrams or use case diagrams.
This diagram represents UML class diagram used for a software system development using an object-oriented method. Class diagrams are categorized as static structure diagrams that depict the physical structure of a system. Class diagram divides a software system's structure into "classes". Classes are defined by the methods and variables of objects. UML Class diagram is used to depict relationships and source code dependencies between objects.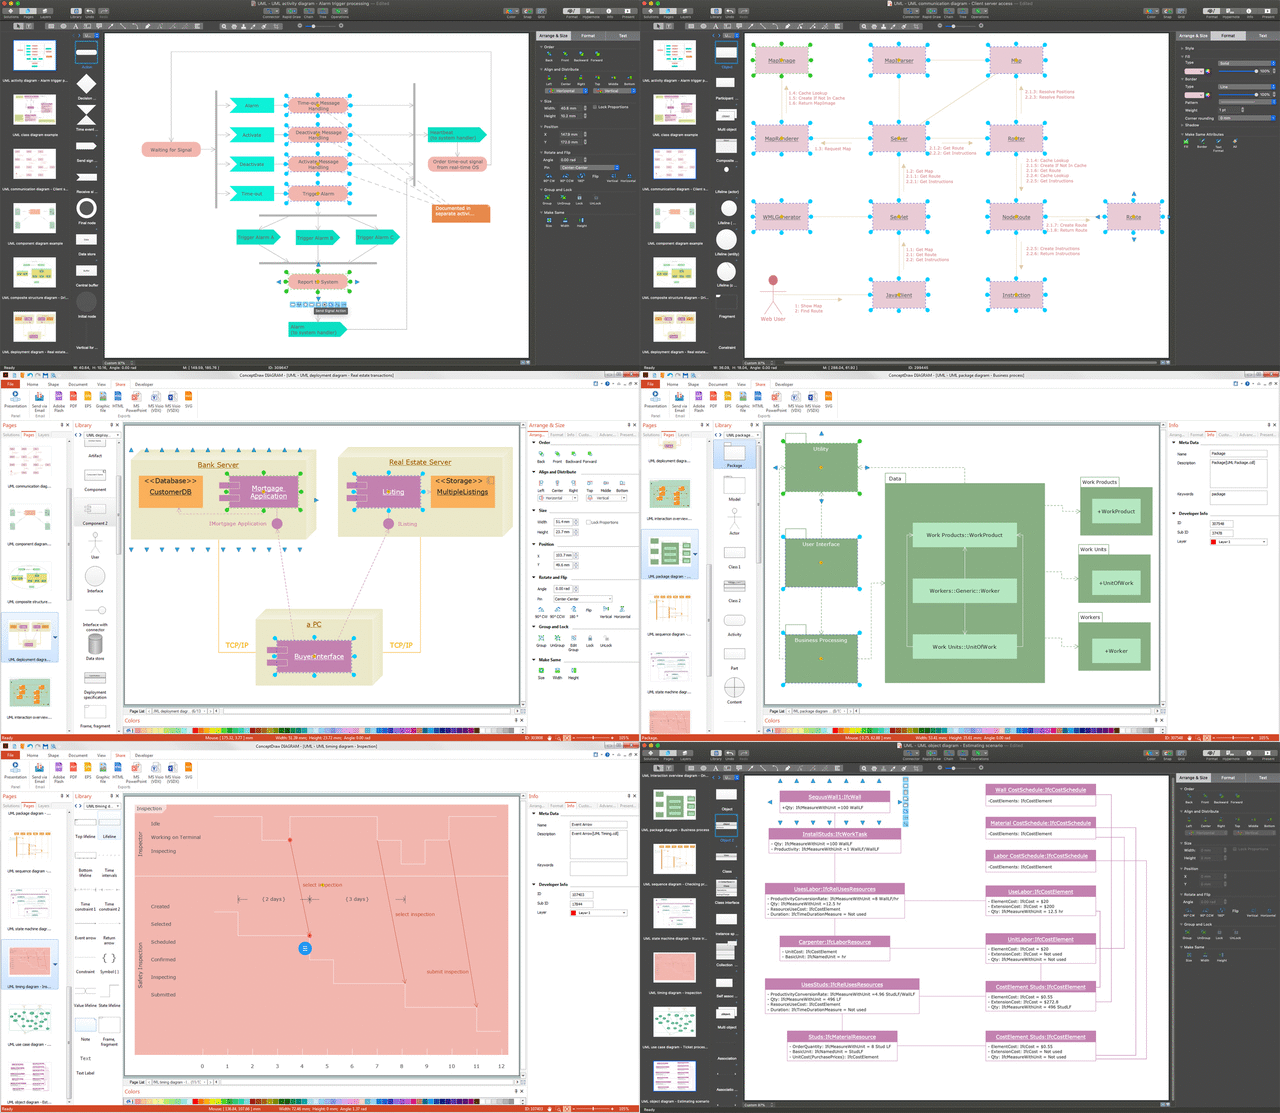
Picture: UML Diagram
Related Solution:
Use ConceptDraw DIAGRAM software with Flowcharts Solution to create Process Flow Charts, Flow Chart Process Maps, and High-Level Process Flow Charts to illustrate ✔️ high-level processes in industrial, chemical, and process engineering, ✔️ major plant processes, ✔️ minor details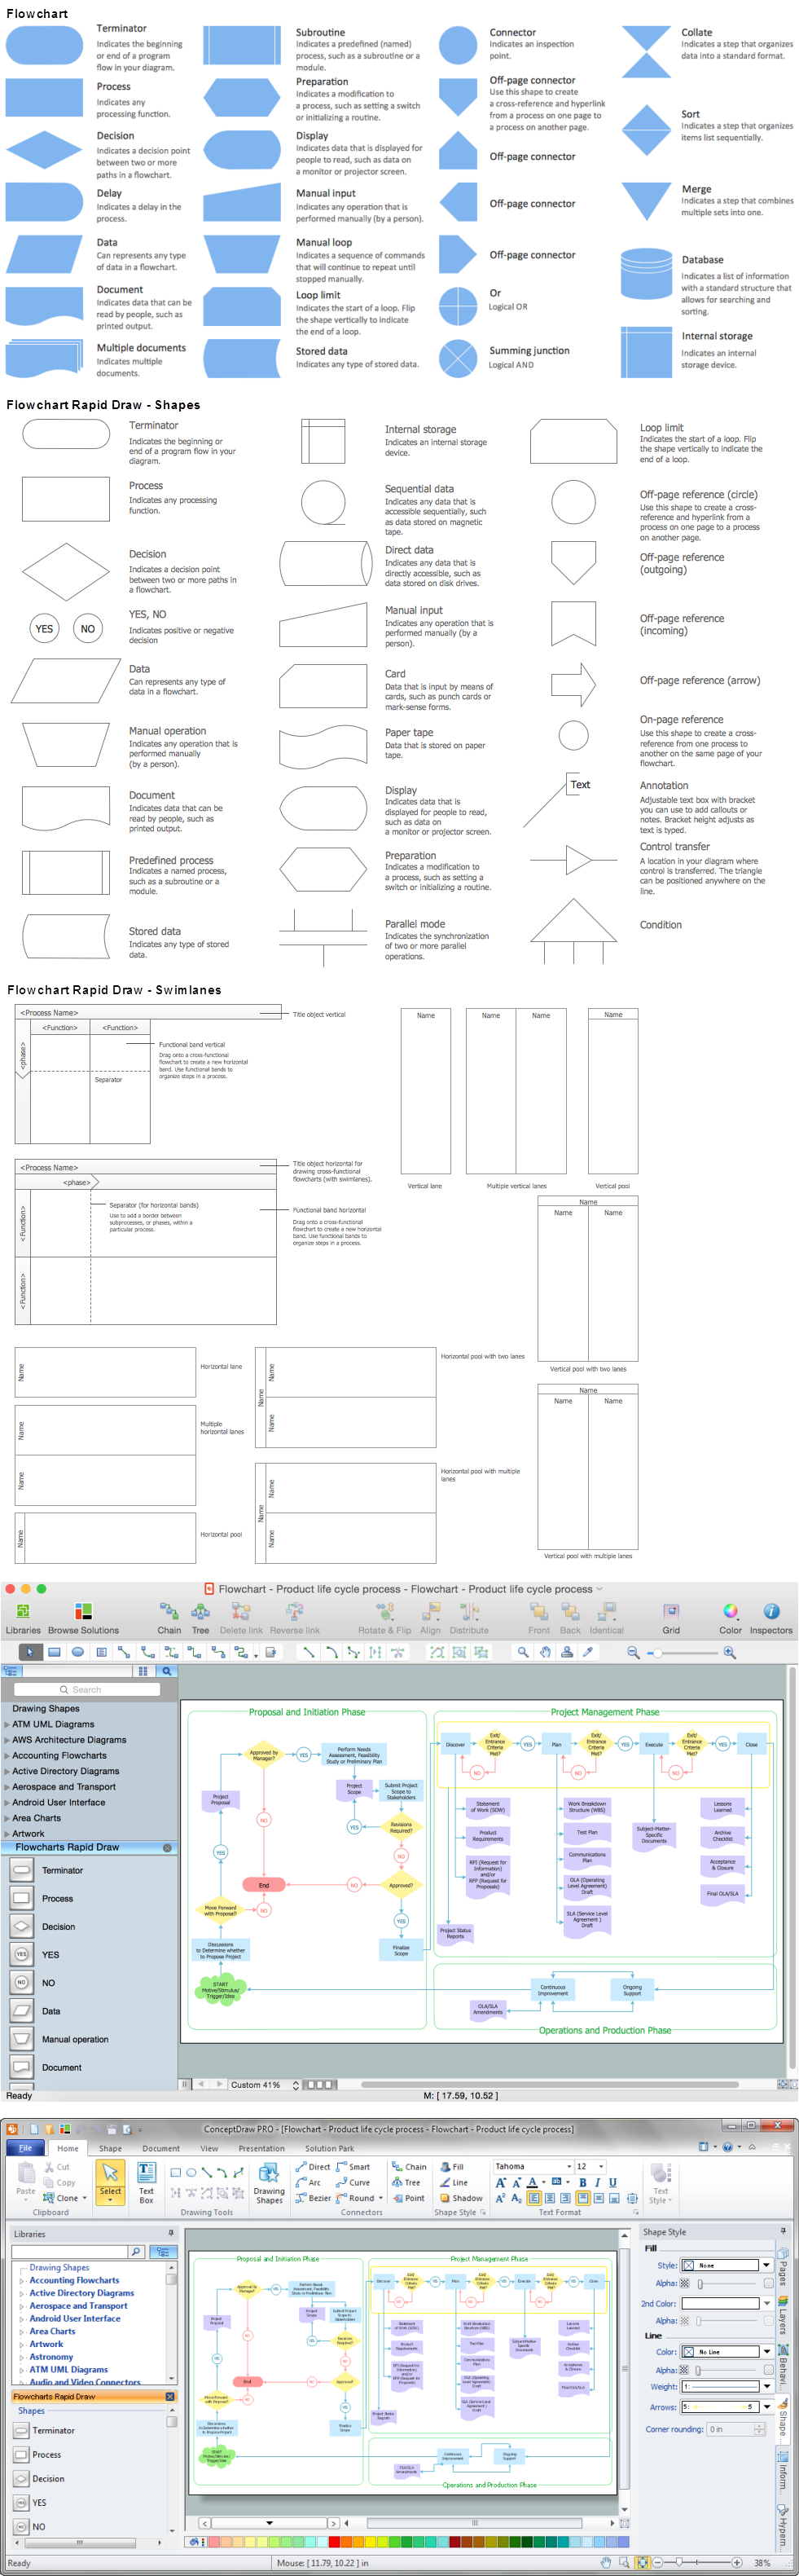
Picture: Process Flow Chart
Related Solution:
Flowcharts visualize a process or algorithm of program as step/operation blocks of various shapes connected with arrowed lines showed the process flow direction. They are used to visualize business or technical processes and software algorithms.
Conceptdraw DIAGRAM - feature-rich flowchart software. It will allow you to create professional looking flowcharts.
Picture: Best Flowcharts
Related Solution: