UML Sequence Diagram. Design Elements
UML Sequence Diagram is a type of Interaction Diagrams that describes the interactions between objects and classes that are involved in the scenario and the sequence of messages exchanged between them.
UML Sequence Diagram represents the processes and objects that occur at the same time as lifelines (parallel vertical lines), and the messages exchanged between them as horizontal arrows.
Sequence Diagrams are very popular in dynamic modeling.
The Rapid UML Solution for ConceptDraw DIAGRAM contains 13 vector stencils libraries with 393 interactive shapes that you can use to design your UML diagrams.
To design a Sequence Diagram use the UML Sequence Diagram library.
UML Sequence Diagram library contains 51 shapes:
- Lifeline (entity)
- Lifeline (control)
- Lifeline (boundary)
- Lifeline
- Return message
- Asynchronous message
- Synchronous message
- Execution occurrence
- Destroy message
- Create message
- Symbol { }
- Self message
- Symbol << >>
- Port
- State divider
- Stop symbol
- Found message
- State invariant/continuations
- Lost message
- Gate Sequence
- Note
- Message default
- Interaction use
- Combined fragment
- Lifeline (actor)
- Self message
- Initiator
- Message
- Unknown/unspecified participant
- Message
- Message synchronous
- Creation message
- Message inverse
- Synchronous
- Creation

Pic.1. UML Sequence Diagram Library

Pic.2. UML Sequence Diagram Library Elements
ConceptDraw Rapid UML solution provides UML Sequence Diagram library of vector stencils for UML sequence diagram elements like lifelines and message arrows.
Use the UML Sequence Diagram library to draw your own UML sequence diagrams that show process interactions as messages exchange arranged in time sequences during runtime scenarios.


All libraries for creating UML diagrams are available inside the ConceptDraw DIAGRAM Templates and samples are located in the Rapid UML section of ConceptDraw STORE.

TEN RELATED HOW TO's:
Create professional business process diagrams using ConceptDraw Expanded Objects library with 14 objects from BPMN.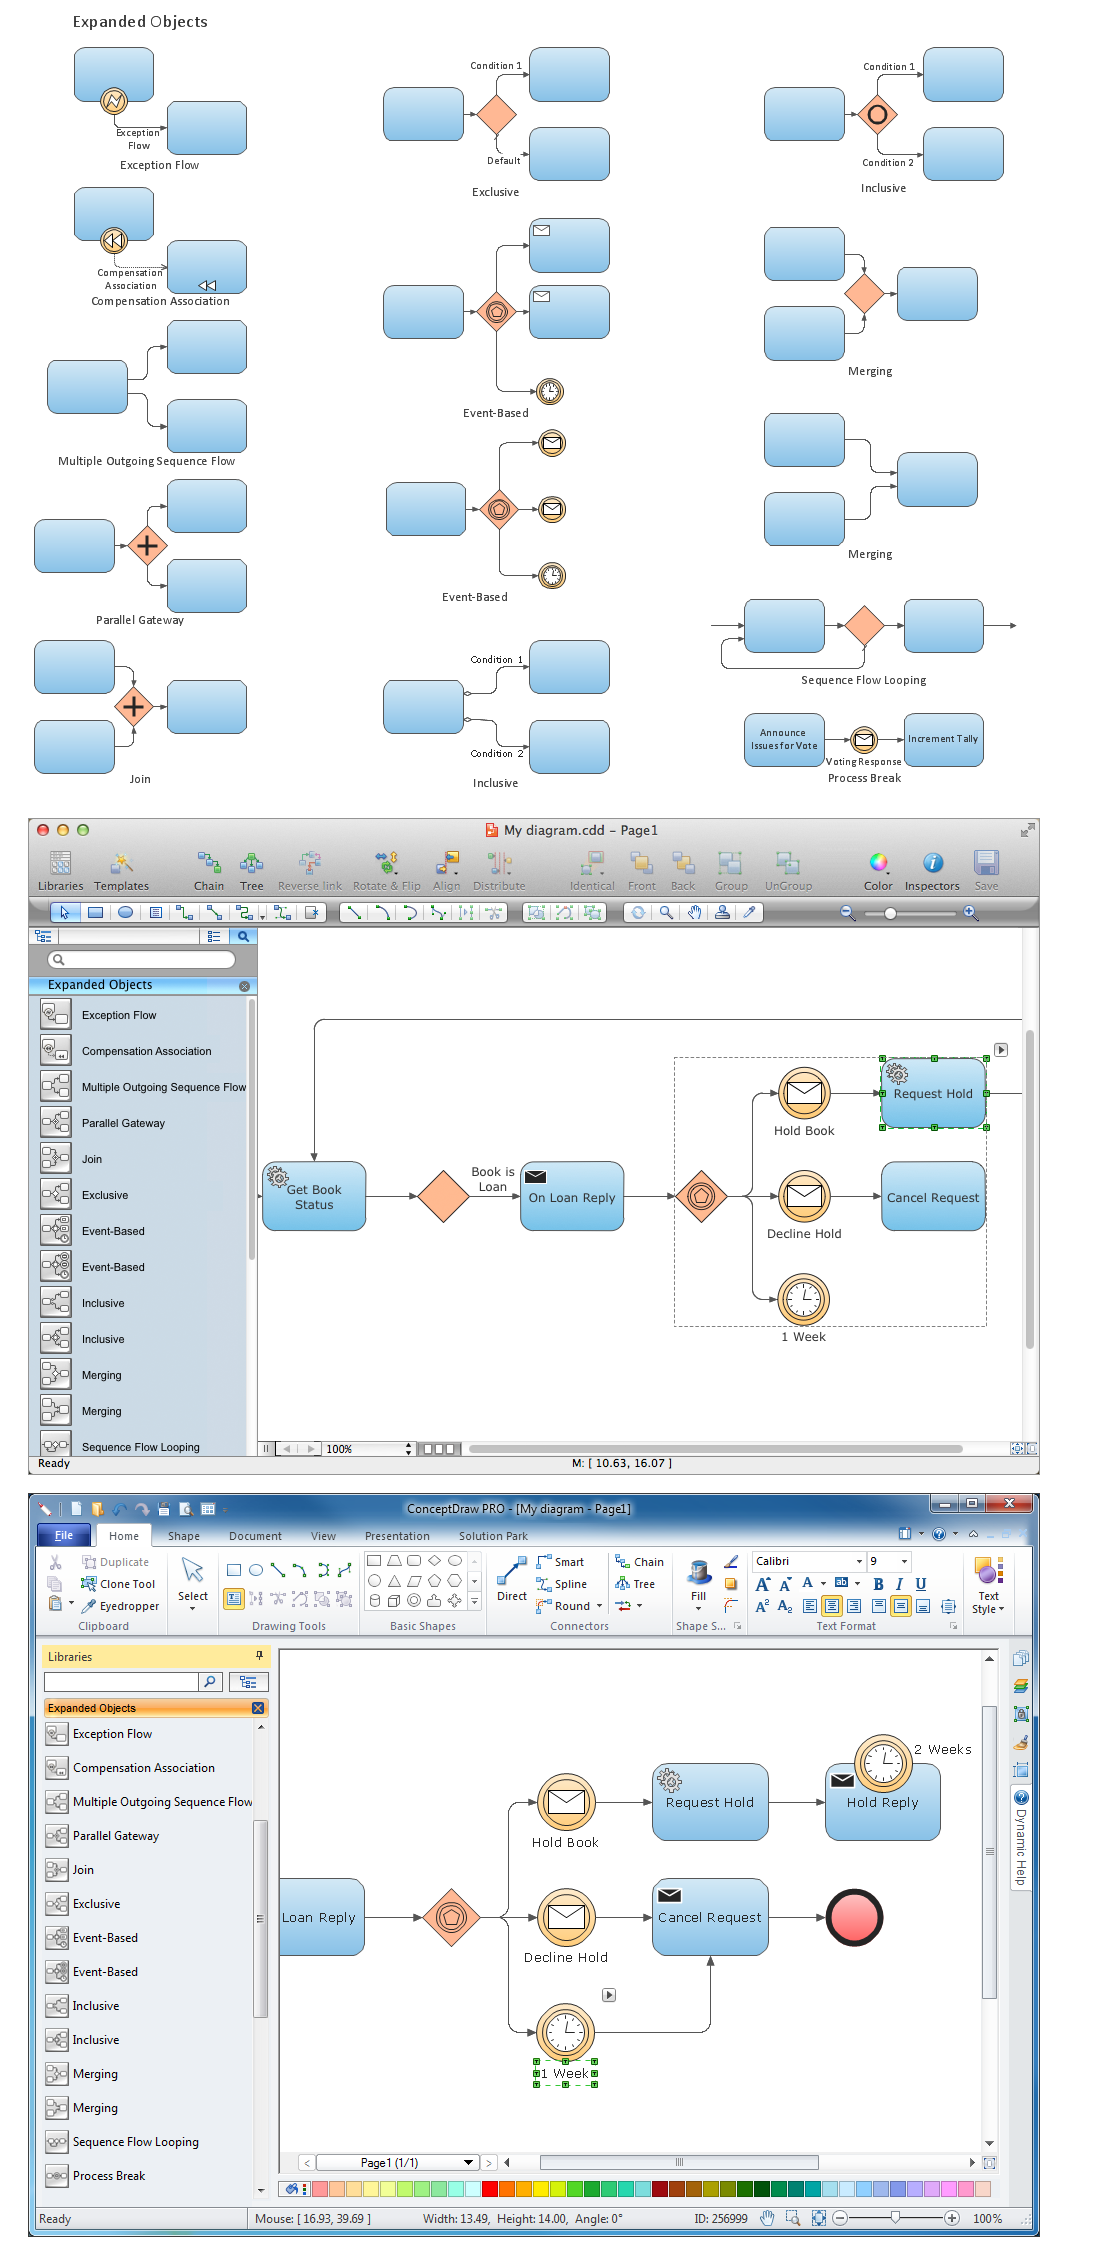
Picture: Diagramming Software for Business Process
UML Sequence Diagram shows object interactions arranged in time sequence, how processes operate with one another and in what order and illustrate the sequence of messages exchanged between the objects and classes involved in the scenario.Picture: UML Sequence Diagram. Design Elements
This sample shows the concept of working of the transport company and is used by transport companies, carriers at the transportation of various goods.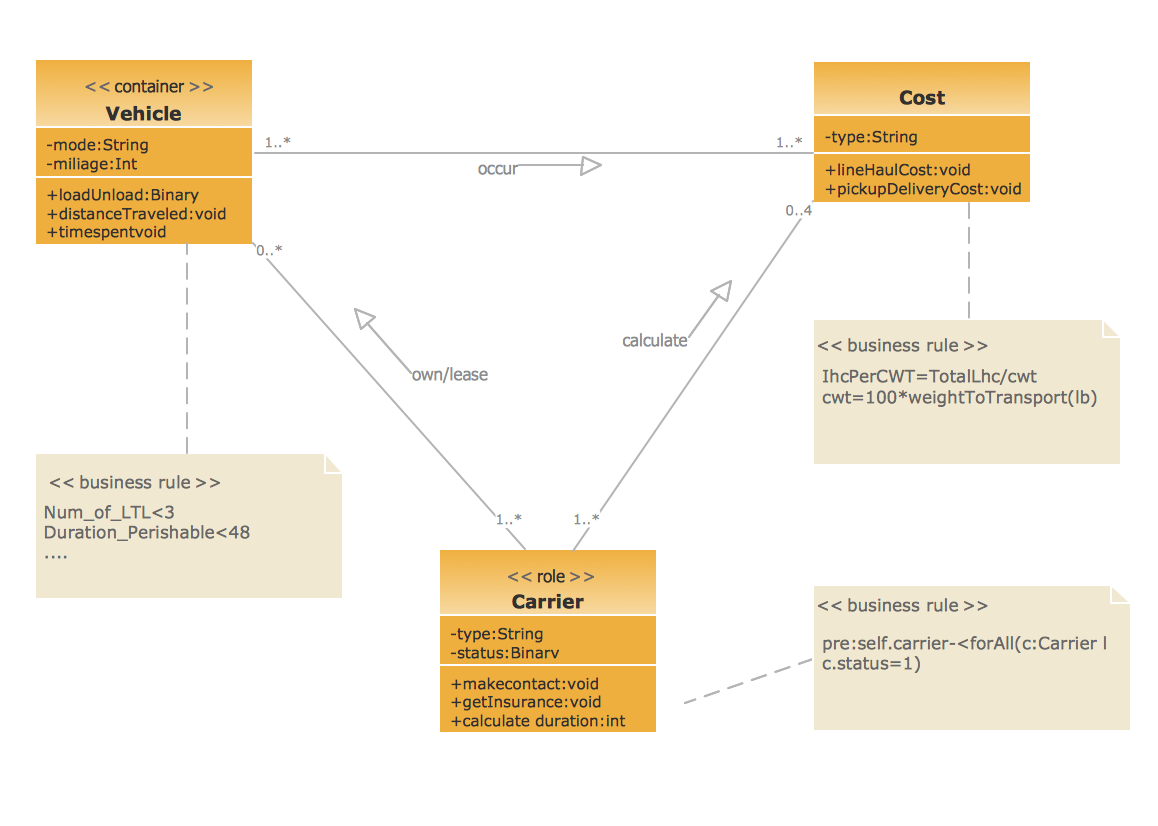
Picture: UML Class Diagram Example for GoodsTransportation System
Related Solution:
Data modeling is actively applied in analysis and uses wide set of methods for description the data requirements in a system. One of the most popular and well-known is the ERD method of database modeling.
The best ERD tool for the Mac and Windows is ConceptDraw DIAGRAM software extended with the Entity-Relationship Diagram (ERD) solution from the Software Development Area for ConceptDraw Solution Park, which is sharpened for professional ERD drawing and data modeling with Entity Relationship Diagram.
Picture: Data Modeling with Entity Relationship Diagram
Related Solution:
Diagramming software for Mac and PC - create flowcharts and presentations for Social Media Organizing.
Picture: Social Media Response DFD Flowcharts - diagramming software ( Mac PC )
Related Solution:
It's no secret that there is a list of skills that every average system administrator should have. And it's important to be able to manage domains via active directory technologies. The best way to keep all the details in mind is to draw a diagram representing users, groups and domains.
This diagram represents an Active Directory Services (Active Directory Domain Services). It can be helpful for system and network administrators to organize a network physical and logical elements (domains, data bases, servers, network equipment, end-user computers etc.) into a secure and logical structure. The logical structure of Active Directory is a hierarchical organization of all network components. The data that is stored in Active Directory comes from some diverse sources. The Active Directory diagram created using ConceptDraw Active Directory Diagram solution. It shows allocating group policies and functions assigned to end users. It helps to plan, manage and maintain the certain user access scenario.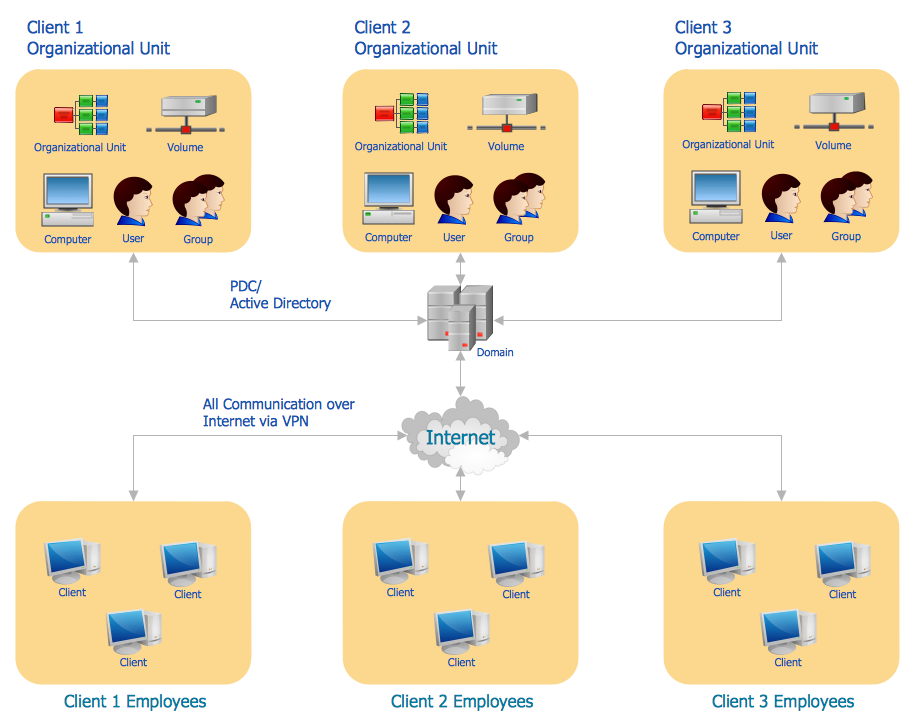
Picture: Active Directory Diagram
Related Solution:
Process mapping helps with sharing business results and reorganizing workflow. In almost every case, after creating a sales process flowchart the steps that are redundant become obvious for a manager. It's easy to find a flowchart examples that will help in developing one for your business.
This sales process flowchart consists of a sequence of steps that represent a simple sale process. Each step is shown graphically by a rectangle representing processing steps or an activity, or a diamond representing a decision. These rectangles are linked by arrows, that indicate the direction of the sales workflow. ConceptDraw Sales Flowcharts solution delivers a the full set of classical flowchart notation symbols, along with sales-related icons and pictograms.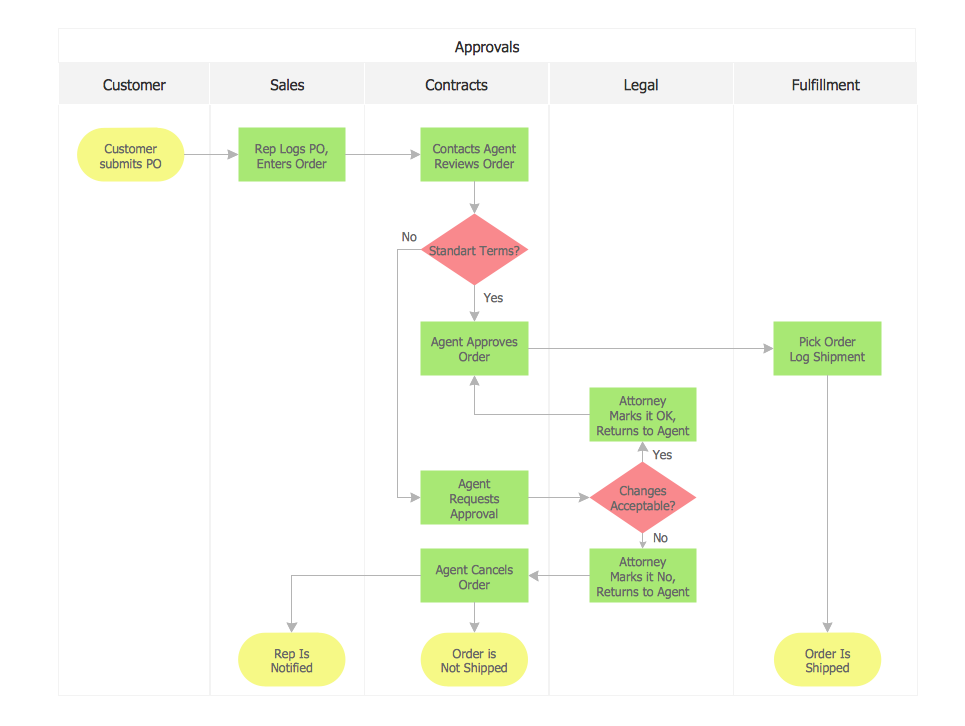
Picture:
Sales Process Flowchart
Flowchart Examples
Related Solutions:
While designing a conceptual data model, you should use appropriate software. For instance, ConceptDraw DIAGRAM is a user-friendly ER diagram tool that has a lot of samples and templates to facilitate your work. A clear entity-relationship diagram helps to define the relations between system’s components.
Software engineering is the section of a computer science engaged to design, realization, and support of complex software products. An ERD is a data modeling method that is widely applied in the software engineering practice. Commonly it is used for developing a structure of a a relational database. An entity relationship diagram is helpful for structuring and organizing databases that can be modeled using a relational structure. An entity relationship diagram is designed to depicts the interrelationships within the sets of entities which are accumulated in the database. Each entity represents a particular component of a data. Thus, ER diagrams depicts the logical structure of databases. ConceptDraw ER Diagrams solution provides software engineers with the professional tool for making entity-relationship diagrams.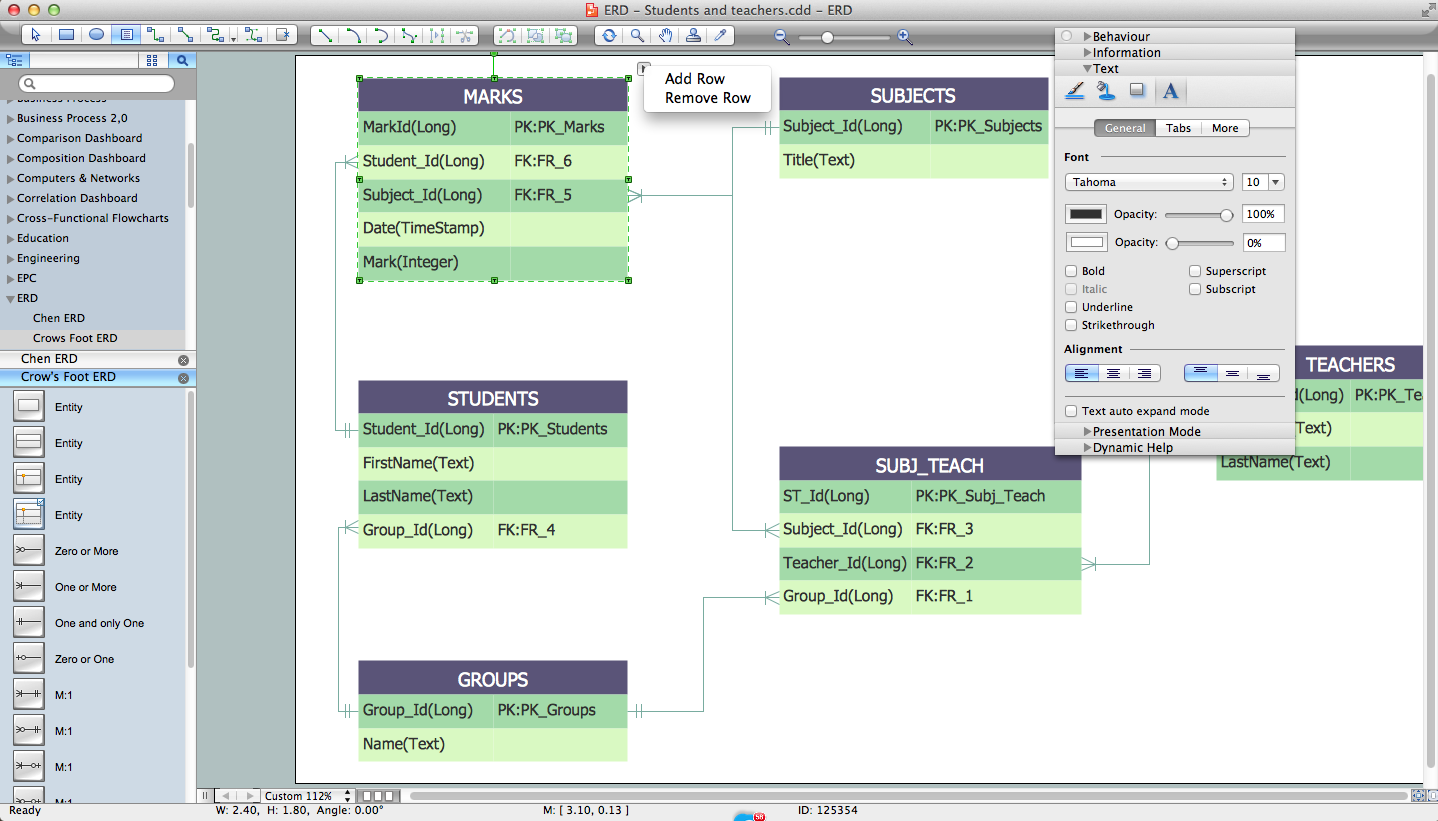
Picture: Entity Relationship Diagram Software Engineering
Related Solution:
The Accounting flowchart shows how information flows from source documents through the accounting records. The are based on the accounting procedures or processes.
Flowcharts are used to represent accounting information in a system. There are special symbols which are used to create accounting flowcharts. Try conceptdraw flowcharting set of symbols to draw a professional charts.
Picture: Why Flowchart Important to Accounting Information System?
Related Solution:
Relationships Analysis. Relations Diagram - factors analysis, factors relations. Create Relations Diagram with ConceptDraw DIAGRAM.
The Seven Management and Planning Tools is a tool for Interaction diagram drawing. This diagram identifies causal relationships. Determine what factors are causes and which factors are effects. Interaction diagram helps establish KPIs to monitor changes and the effectiveness of corrective actions in resolving the problem.
Picture: Relationships Analysis


