UML Use Case Diagram. Design Elements
UML Use Case Diagram is a type of Behavior Diagrams that displays the dependencies between the actors and use cases.
UML Use Case Diagram displays the system on the conceptual level.
The purpose of a UML Use Case Diagram is to demonstrate the various types of users of a system and the different ways of their interacting with this system. Use Case Diagrams are often used together with the textual use cases and other types of diagrams.
The notation for a Use Case Diagram involves the following types of symbols:
- Use cases are represented as the horizontally shaped ovals and display the different uses.
- Actors are the people that employ the use cases and are represented on the diagram as figures of persons. Actors cannot be related each to other (except relations of generalization/inheritance).
- Associations are shown as lines between actors and use cases.
- System boundary – the box with the name and ovals (use cases) inside that sets a system scope to use cases.
- Packages that allow you to add the elements in groups.
The Rapid UML Solution for ConceptDraw DIAGRAM contains 13 vector stencils libraries with 393 interactive shapes that you can use to design your UML diagrams.
To design a Use Case Diagram use the UML Use Case Diagram library.
UML Use Case Diagram library contains 26 shapes:
- Include relationship
- Use case
- Communicates relationship
- Actor 1
- Uses relationship
- Extend relationship
- Generalization relationship
- Multiplicity: mandatory
- Package
- Multiplicity: many (zero or more)
- Communication line
- Use case set 2.0
- Divider
- Actor 2
- System boundary
- Frame, fragment
- Note
- Symbol << >>
- Association Many-to-Many
- Association One-to-Many
- Smart connector (with options)
- Interface
- Smart connector
- Line connector
- Note connector

Pic.1. UML Use Case Diagram Library

Pic.2. UML Use Case Diagram Library Elements
ConceptDraw Rapid UML solution provide UML Use Case Diagram library of vector stencils for use case diagram elements like actors, use cases, connectors, etc.
Use the library UML Use Case Diagram to draw your own UML use case diagrams that show interactions between a roles (actors) and a system, to achieve a goal.
TEN RELATED HOW TO's:
UML Collaboration Diagram illustrates how components are wired together to larger components and software systems that shows the structure of arbitrarily complex systems.
ConceptDraw has 393 vector stencils in the 13 libraries that helps you to start using software for designing your own UML Diagrams. You can use the appropriate stencils of UML notation from UML Collaboration library with 36 objects
Picture: UML Collaboration Diagram. Design Elements
Related Solution:
Database structures are usually described by ER-diagrams which represents entities as boxes with lines-connections between them. You can create any entity-relationship diagram (ERD) by means of ConceptDraw DIAGRAM using ready-to-use templates and special libraries containing all the needed symbols and shapes. Creating a model for your database from now on can take just a few minutes.
ERD (entity relationship diagram) designed to show the logical structure of databases. It intended to depict the relationships between data components (entities). ERDs are a popular tool for software engineers and architects. Using ERD they can manage the every aspect of database design. Also ERD can be used as guidelines for testing and communications before software release. This diagram represents the file reference system of the WordPress web platform. Because entity relationship diagrams have such a broad application area through the prevalence of database technology, it can be applied for a wide range of users.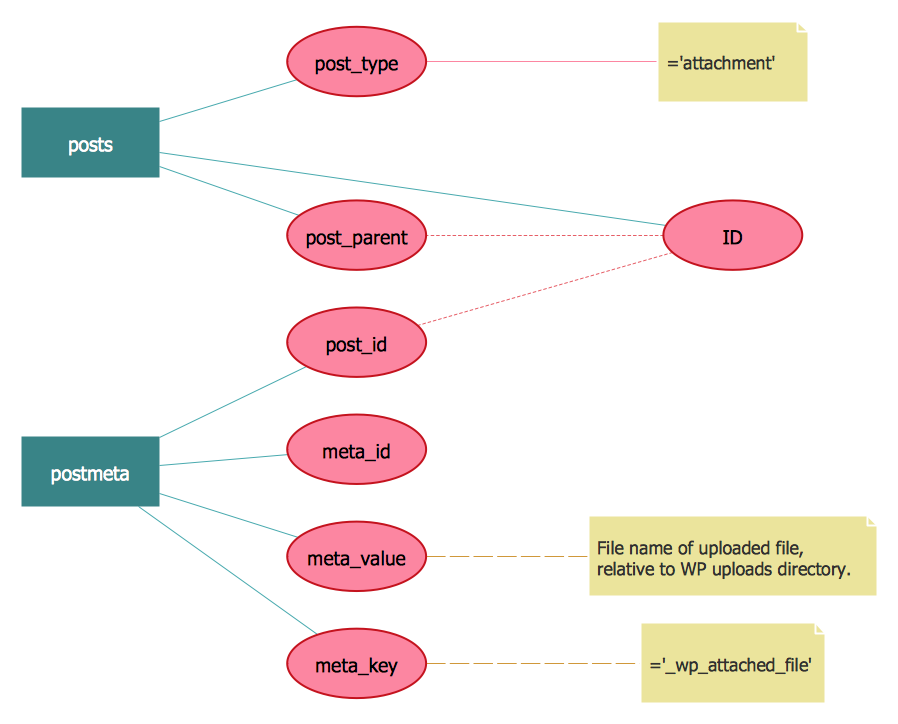
Picture: Entity-Relationship Diagram (ERD) with ConceptDraw DIAGRAM
Related Solution:
If you want to find a way to understand complex things in minutes, you should try to visualize data. One of the most useful tool for this is creating a flowchart, which is a diagram representing stages of some process in sequential order. There are so many possible uses of flowcharts and you can find tons of flow charts examples and predesigned templates on the Internet. Warehouse flowchart is often used for describing workflow and business process mapping. Using your imagination, you can simplify your job or daily routine with flowcharts.
Warehouse flowcharts are used to document product and information flow between sources of supply and consumers. The flowchart provides the staged guidance on how to manage each aspect of warehousing and describes such aspects as receiving of supplies; control of quality; shipment and storage and corresponding document flow. Warehouse flowchart, being actual is a good source of information. It indicates the stepwise way to complete the warehouse and inventory management process flow. Also it can be very useful for an inventory and audit procedures.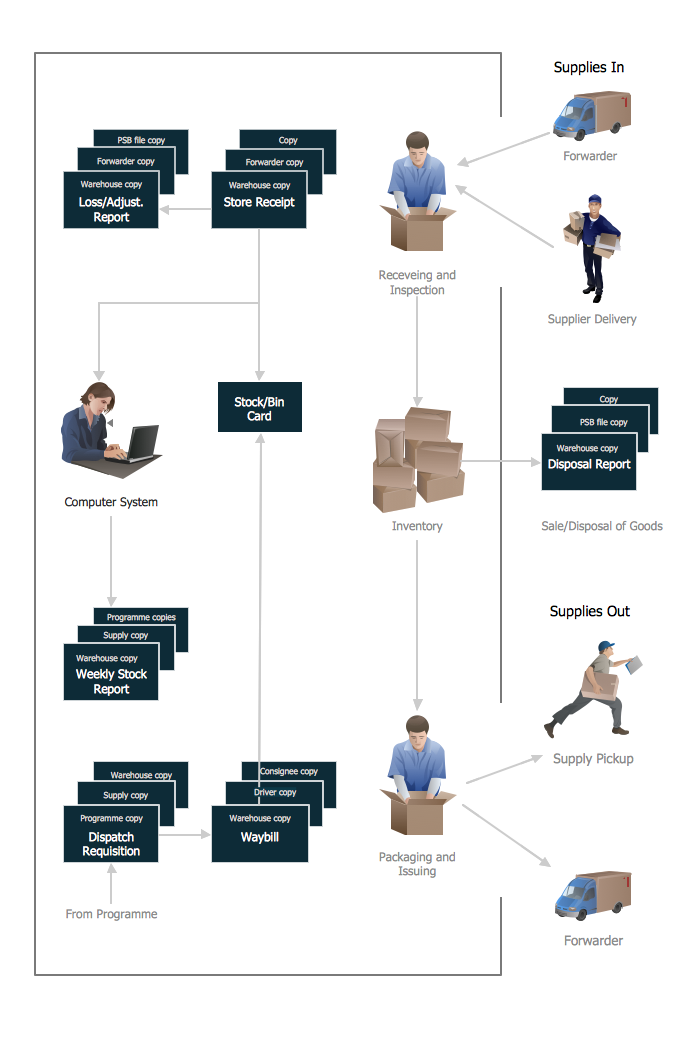
Picture: Flow Chart Example: Warehouse Flowchart
Related Solution:
The ConceptDraw Flowchart component includes a set of samples and templates. This geathered as flowchart maker toolbox which focused on drawing flowcharts of any industry standards.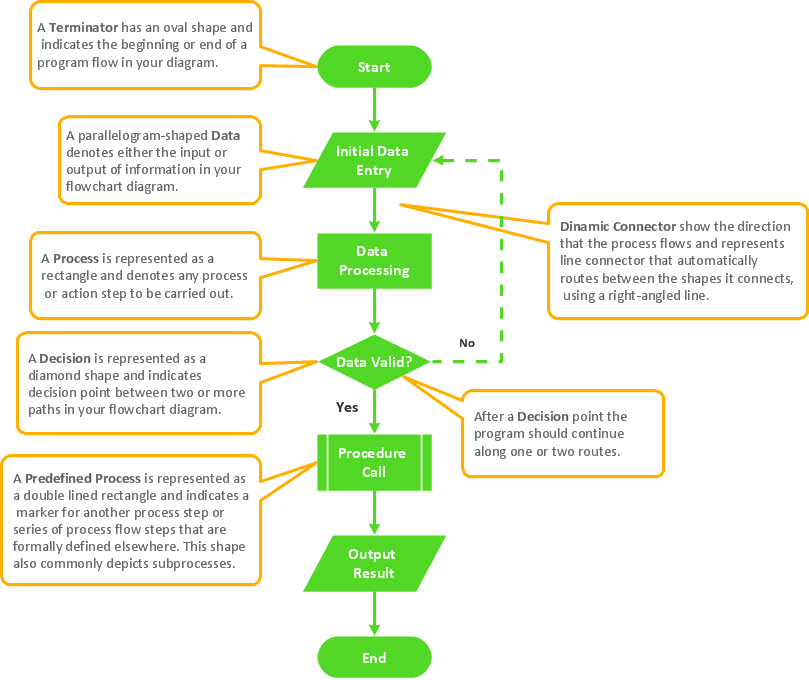
Picture: Flowchart Components
Related Solution:
This sample represents the actors, use cases and dependencies between them, and also the relationships between use cases. There are used dependency and use case generalization associations on this UML diagram. Use case generalization is used when you have two similar use cases, but one of them does more than another.
This sample shows the work of the Financial Trade sphere and can be used by trading companies, commercial organizations, traders, different exchanges.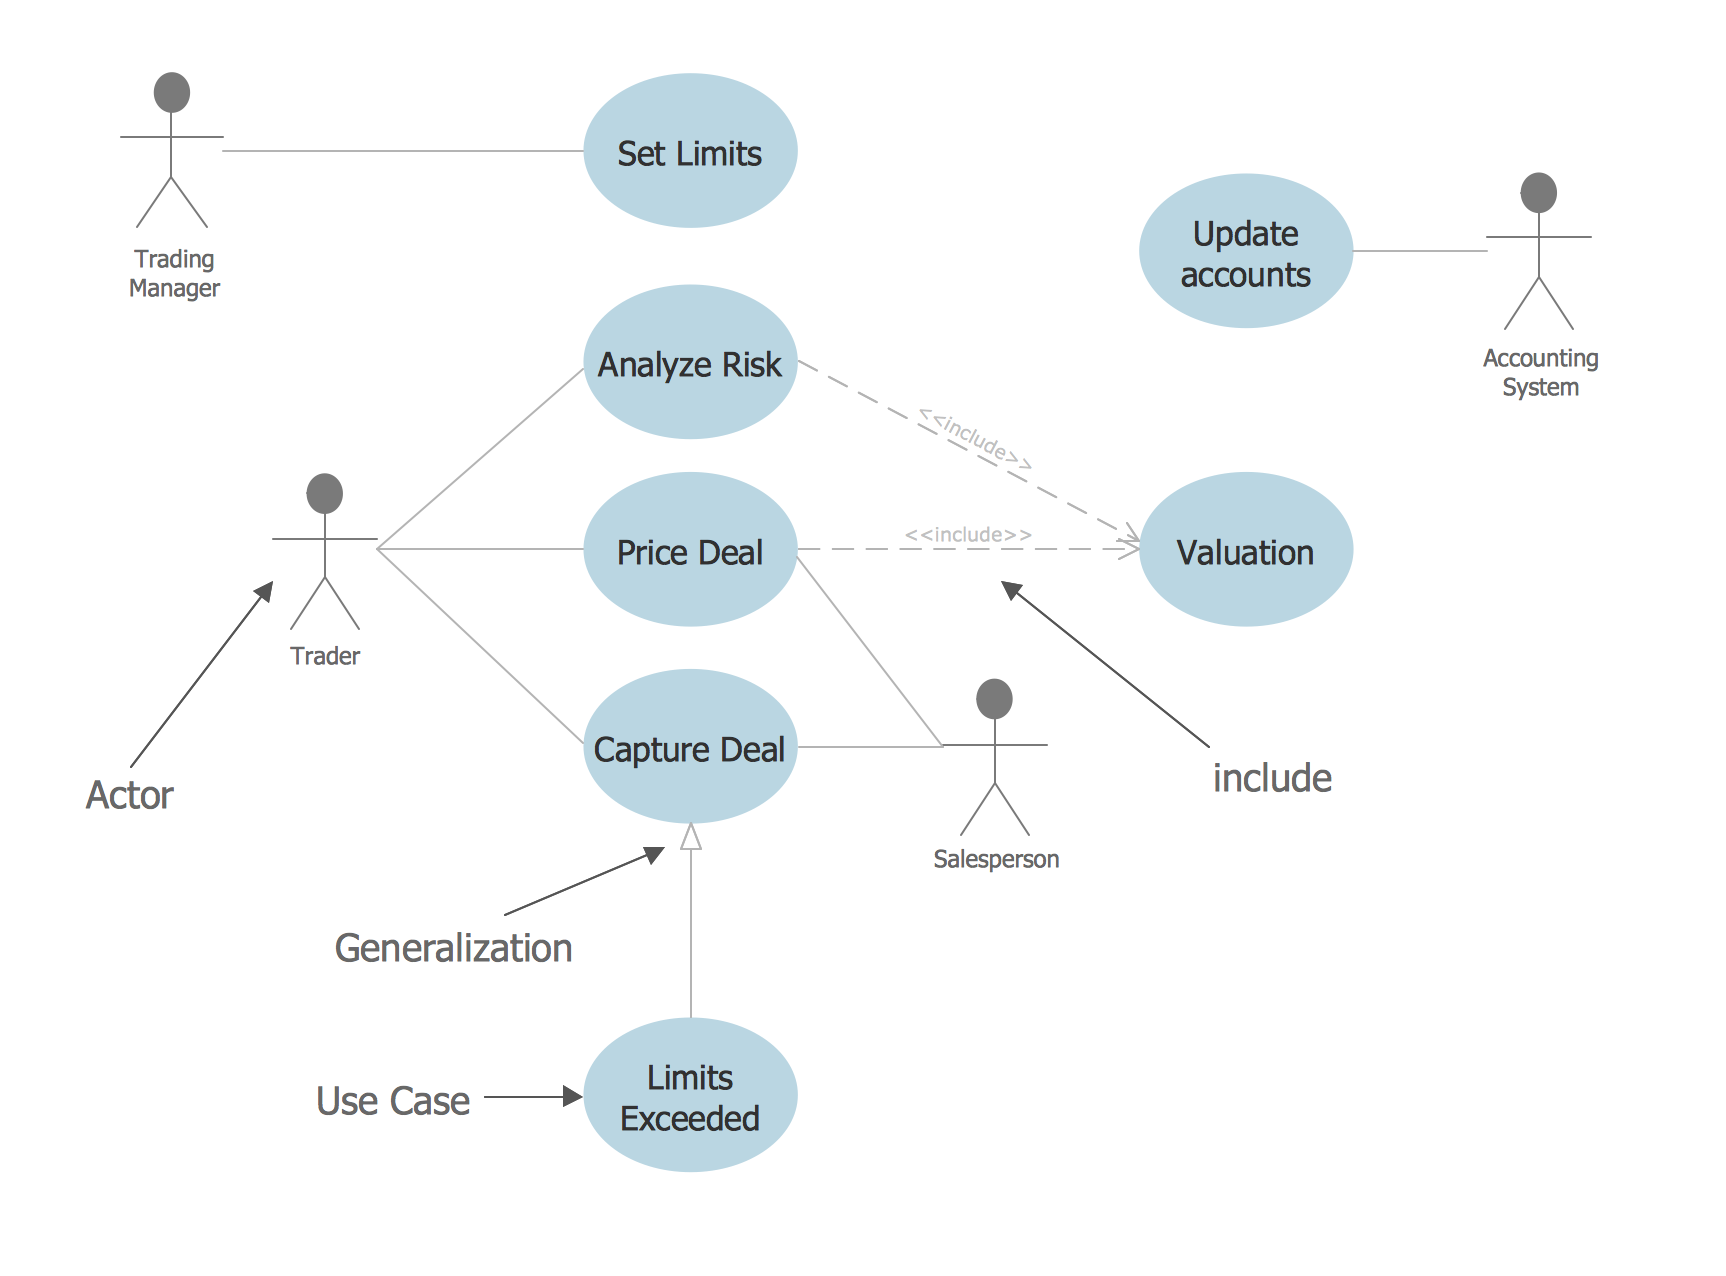
Picture: Financial Trade UML Use Case Diagram Example
There are numerous articles about the advantages of flowcharting, creating business graphics and developing different charts. Nevertheless, these articles are almost useless without the main component - the examples of flowcharts, org charts and without a fine example, it is difficult to get all the conveniences of creating diagrams. You can find tons of templates and vivid examples on Solution Park.
This illustration shows a variety of business diagrams that can be created using ConceptDraw DIAGRAM. It comprises a different fields of business activities: management, marketing, networking, software and database development along with design of infographics and business illustrations. ConceptDraw DIAGRAM provides a huge set of sample drawings including business process modeling diagrams,, network diagrams, UML diagrams, orgcharts, DFD, flowcharts, ERD, geographical maps and more.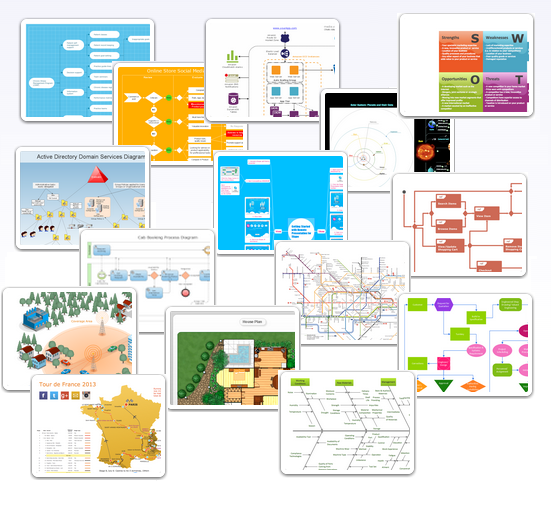
Picture: Examples of Flowcharts, Org Charts and More
Related Solution:
The vector stencils library UML Use Case contains specific symbols of the UML notation such as actors, actions, associations and relationships for the ConceptDraw DIAGRAM diagramming and vector drawing software.
Picture: Jacobson Use Cases Diagram
Related Solution:
ConceptDraw DIAGRAM is a professional diagramming and vector drawing software. Now, enhanced with SysML Solution from the Software Development Area of ConceptDraw Solution Park, ConceptDraw DIAGRAM became an ideal software for model based systems engineering (MBSE).
Picture: Model Based Systems Engineering
Related Solution:
This sample was created in ConceptDraw DIAGRAM diagramming and vector drawing software using the Flowcharts solution from the Diagrams area of ConceptDraw Solution Park.
This sample shows the Flowchart of the Subprime Mortgage Crisis. This Flowchart describes the decline in housing prices when the housing bubble burst and what it caused on the housing and financial markets. You can also see the Government and Industry responses in this crisis situation.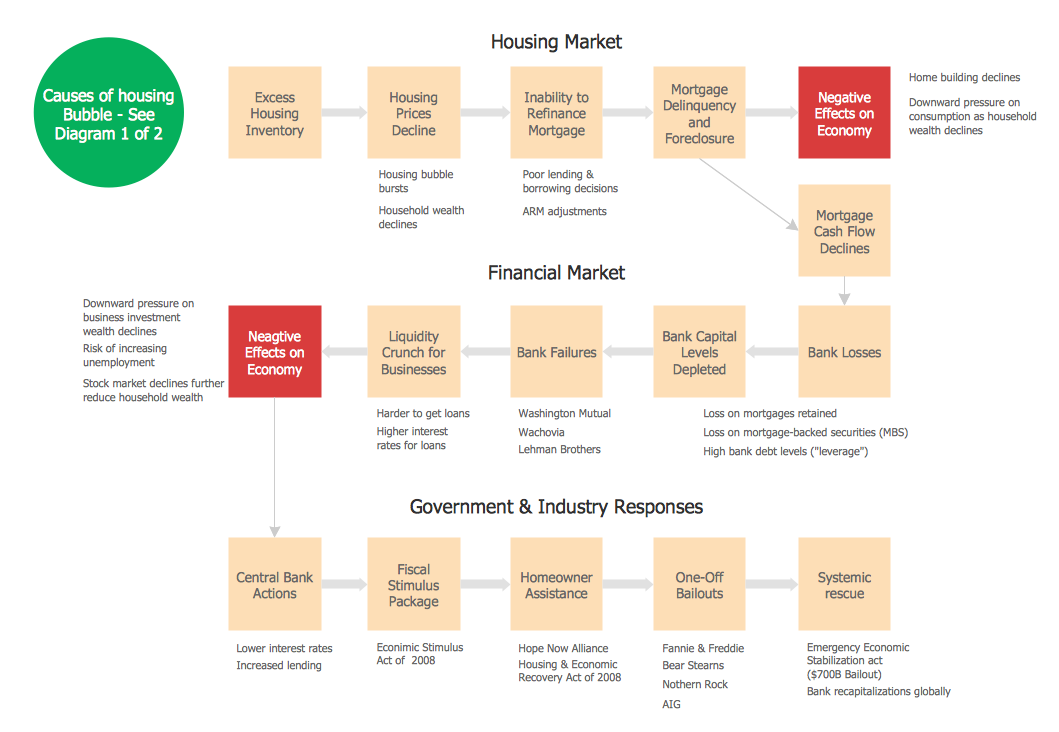
Picture: Flowchart on Bank. Flowchart Examples
Related Solution:
Starting producing workflow diagram from template you save time and avoid the blank page syndrome. At first, the workflow template is set of rules for a workflow. The workflow symbols used in the specific case are part of workflow template. This is the subset of large standard collections of workflow symbols. The first part of workflow template is identification of symbols allowed in use in your specific case. The best way would be to collect them in your customized drawing collection of workflow symbols which used in your specific cases of workflow diagrams. Another way to create business process documents is using business process flow diagram which have similar purposes and have different visual notation.
ConceptDraw DIAGRAM is professional workflow diagram software with the rich extentions from ConceptDraw Solution Park. The basic solution for workflow diagramming is Workflow Diagrams Solution. It delivers a rich set of workflow diagram templates and samples help you draw diagrams e
Picture: Workflow Diagram Template
Related Solution: