Made with
ConceptDraw
DIAGRAM 18

UML Tool & UML Diagram Examples

Types of UML Diagrams

UML or Unified Modelling Language can be at any time applied in different spheres of business activity, such as finance, internet technologies, banking, healthcare, aerospace and other business activities. This language is an accepted standard and this standard can be used for modelling any needed system. There are lots of notations you can use for making any needed UML diagrams. These notations can be made for visual representation of any needed subsystems, requirements, physical and logical elements, behavioural and structural patterns, as they are especially relevant to the systems built during using a so-called “object-oriented” style.

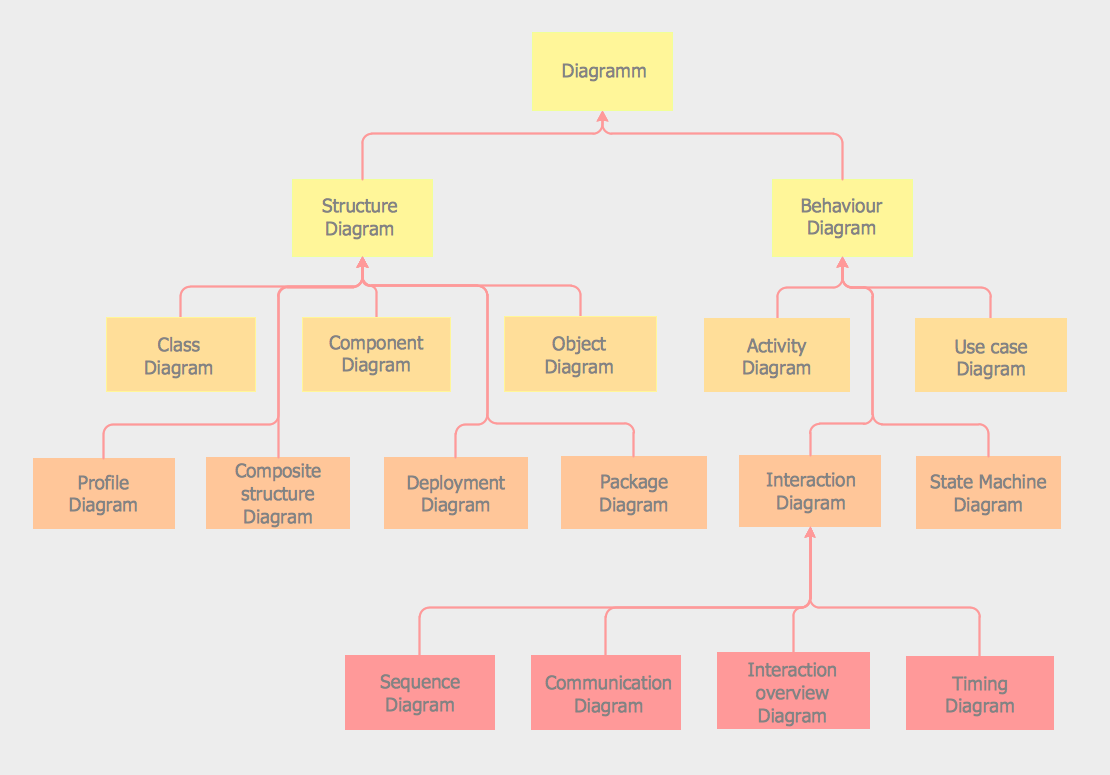
The Unified Modelling Language (UML) is a standardized and general-purpose language and it is very popular and quite widely used, especially in the field of software engineering in IT. This Unified Modelling Language includes a set of some graphic notation techniques for creating the visual models of object-oriented software-intensive systems. There are thirteen types of such UML diagrams and you can always create any of them in ConceptDraw DIAGRAM software. These types of UML diagrams are: “package” (or “class”), “collaboration”, “object”, “use case”, “sequence”, “component”, “activity”, “deployment” “state machine”, “timing”, “interaction overview” and “composite structure” UML diagrams. Each of the types of Unified Modelling Language will be described later in this article.

Thus, Unified Modelling Language “Class” diagrams are the static structure diagrams, with the help of which you can describe a structure of some system in a way of showing the system's methods, classes, attributes, operations as well as the relationships among the objects within this system. The so-called Unified Modelling Language “Package” diagram can be used in the Unified Modelling Language for a reason of depicting the dependencies between the packages that can make a particular model. The so-called Unified Modelling Language “Object” diagrams are popular for being used in the Unified Modelling Language (UML). Unified Modelling Language “Object” diagrams show a partial or a complete view of a system’s structure within some specific period of time. The so-called Unified Modelling Language “Use Case” diagrams can be the representations of a user's interaction with some system and with their aid you can depict some particular specifications of a use case. The so-called Unified Modelling Language “Sequence” diagrams are also known as interaction diagrams with the help of which it is simpler for you to show the way some particular processes operate with each other and in which order they do it. The UML “Communication” diagrams model the interactions between different parts in terms of sequenced messages. “Communication” diagrams represent the information from “Use Case”, “Class” and “Sequence” diagrams, describing the dynamic behaviour and the static structure of some system. The UML “Activity” diagrams are the representations of the workflows of the actions as well as the activities with an iteration, choice and concurrency. In the Unified Modelling Language “Activity” diagrams there are models of both organisational and computational processes (for example, workflows) represented and this type of UML diagrams in general represents the overall flow of the control. With UML “Component” diagram you can depict the way some system components are wired with each other and so to form the larger components of software systems or software systems themselves. These diagrams are used for illustrating the structure of arbitrarily complex systems. The UML “Deployment” diagrams can be used for modelling the physical deployment of the artifacts on nodes. The nodes with the artifacts appear in a way of boxes and the artifacts in each node appear in a way of the rectangles in these boxes. These nodes can also have sub-nodes and these sub-nodes can appear in a way of the nested boxes. One single node in the UML “Deployment” diagrams can represent a lot of different physical nodes. The UML “State Machine” diagrams can be used for enhancing the mathematical concept of some finite automaton once it is used in some computer science applications. The UML “Timing” diagrams are quite specific and still interaction diagrams. They are used for concentrating on the timing constraints. The UML “Timing” diagrams can be also used for exploring the behaviour of objects within some particular period of time. With the aid of the UML “Interaction Overview” diagram you can illustrate a control flow with nodes which contain the interaction diagrams. The UML “Interaction Overview” diagrams are identical to the “Activity” diagrams and they both visualize a sequence of some activities, although there is a slight difference between them. The UML “Composite Structure” diagrams are similar to the “Static Structure” diagrams and with their help you can show the internal structure of a class so the collaborations, which this structure makes possible. While creating the UML “Composite Structure” diagrams you can include the internal parts, with the help of which the parts of some system can interact with each other.

You can always create any of mentioned and described above Unified Modelling Language diagrams with the aid of ConceptDraw DIAGRAM software. Besides downloading the ConceptDraw DIAGRAM application, it is also beneficial to have ConceptDraw STORE one as well, as this another product of “CS Odessa” allows ConceptDraw DIAGRAM users to download any solution they need for making your charts, flowcharts, maps and diagrams, schemes and plans, as well as any of the mentioned above UML diagrams at any time you need to create them.

“Rapid UML” solution enables you to make any of the Unified Modelling Language diagrams, using so many different examples and templates from this solution for simplifying ConceptDraw DIAGRAM users' work of creating similar great looking diagrams.
UML Notation


Pic.1. UML Notation

Solution RapidUML from Software Development area of ConceptDraw Solution Park provides templates, examples and 13 vector stencils libraries for drawing all types of UML 1.x and 2.x diagrams using ConceptDraw DIAGRAM diagramming and vector drawing software.

Use these UML diagram templates and examples to quickly start drawing your own UML diagrams.

Package Diagrams

UML Package Diagram illustrates the functionality of a software system.
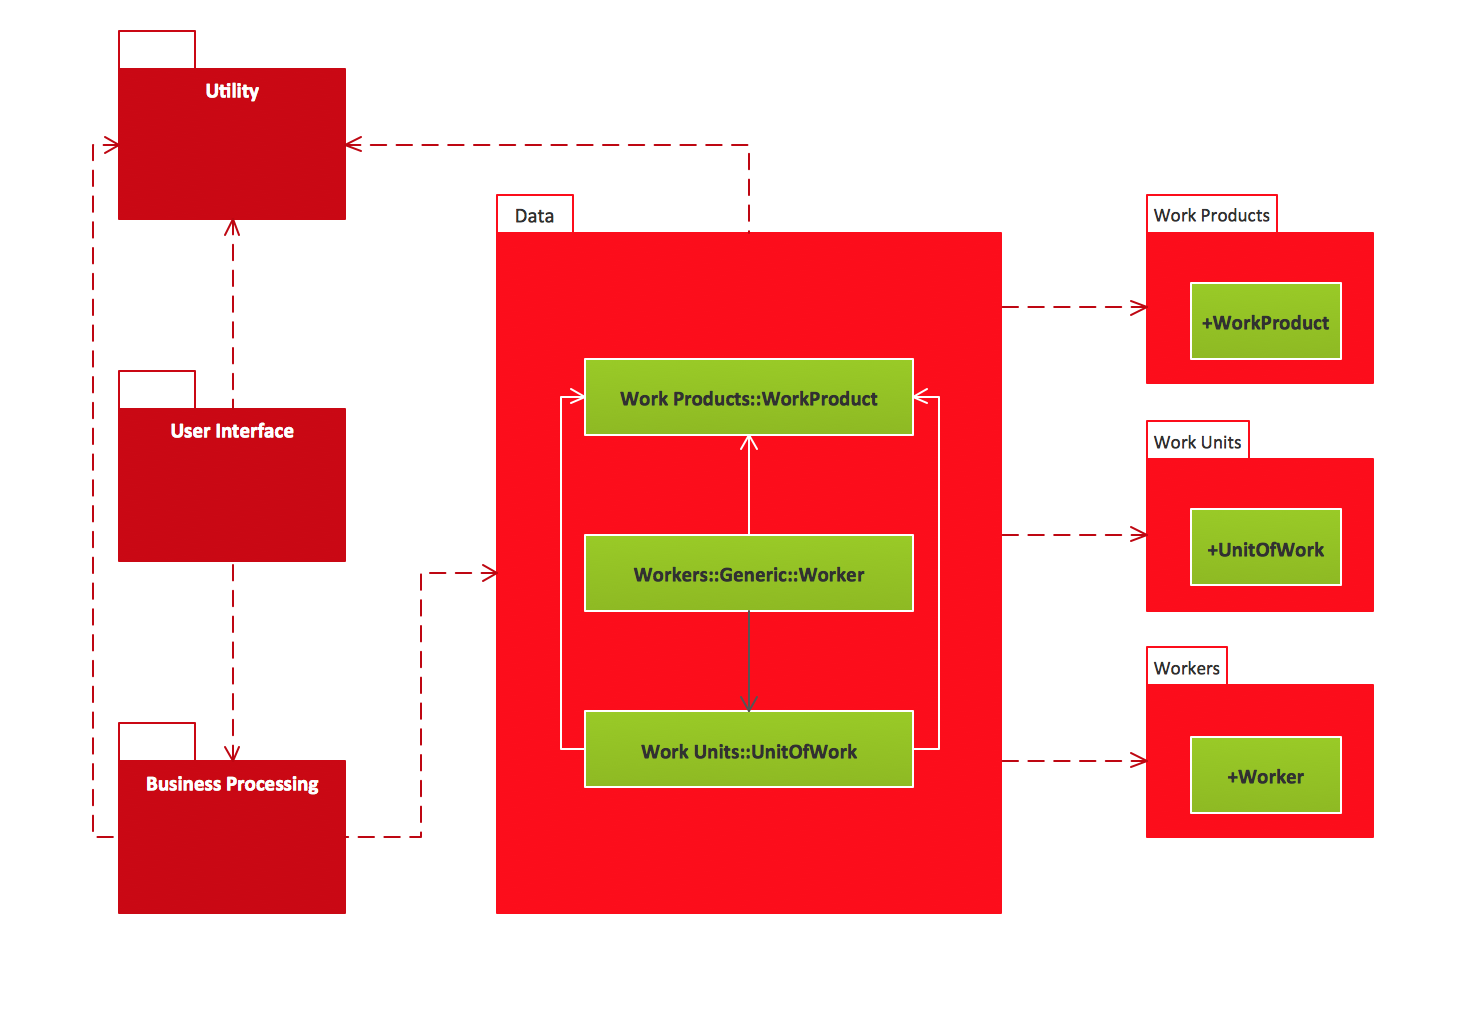
UML Package Diagrams. Business process Business process

Collaboration Diagrams

UML Communication Diagram depicts the interactions between objects or parts in terms of sequenced messages and describes both the static structure and dynamic behavior of a system.

UML Collaboration Diagrams. Ticket processing system Ticket processing system

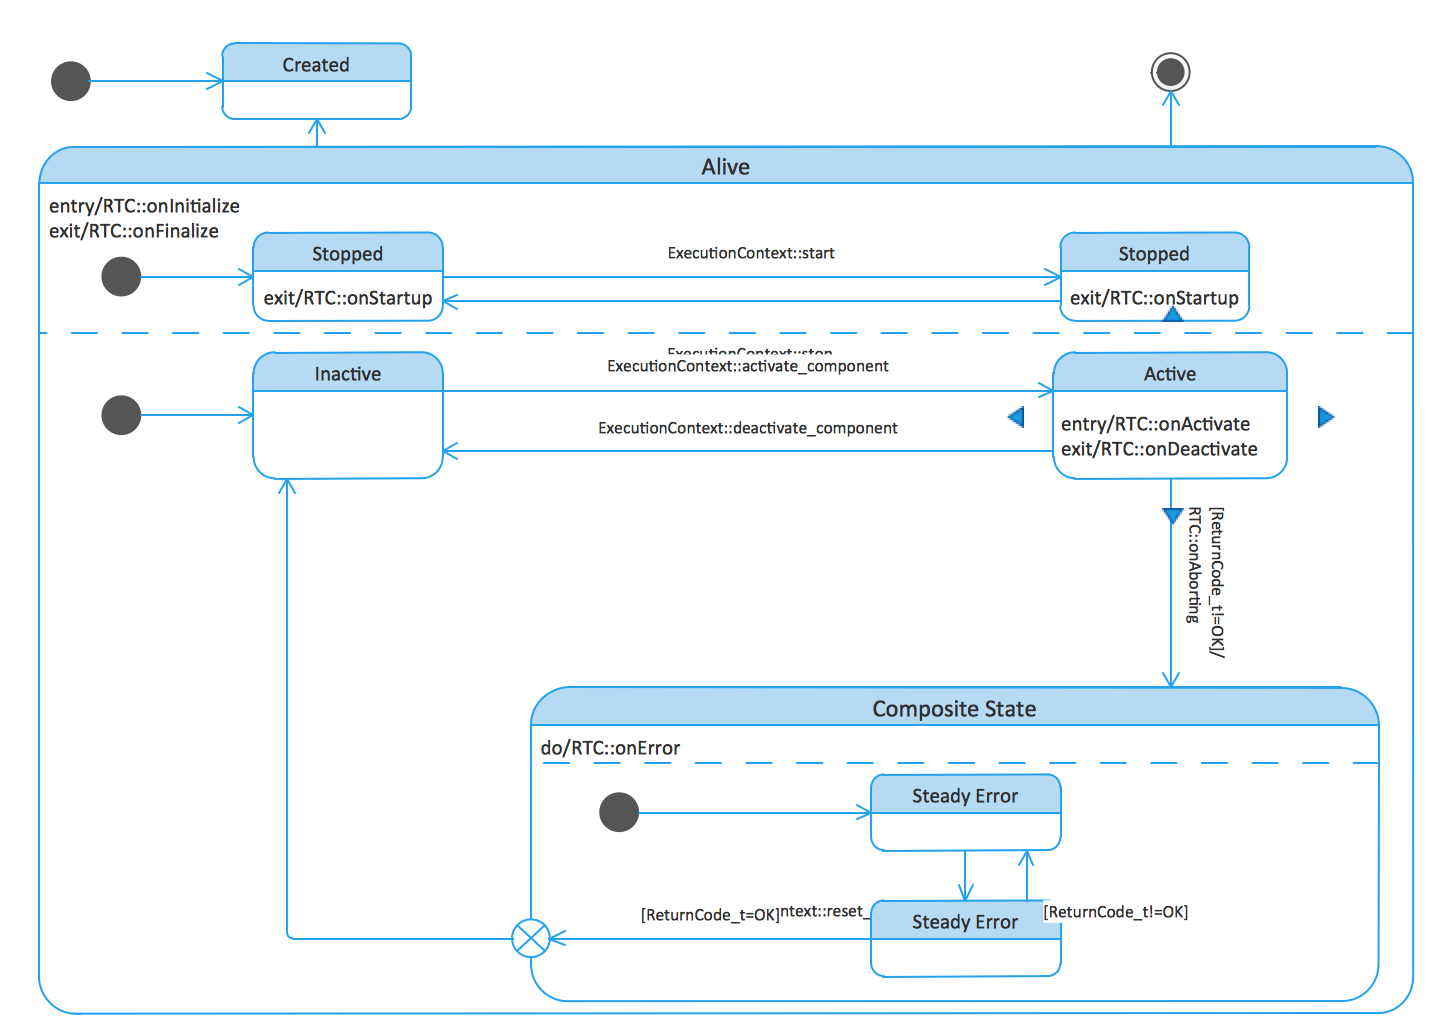
State Machine Diagrams

UML state machine's goal is to overcome the main limitations of traditional finite-state machines while retaining their main benefits.

UML State Machine Diagrams. State transitions of RT component State transitions of RT component

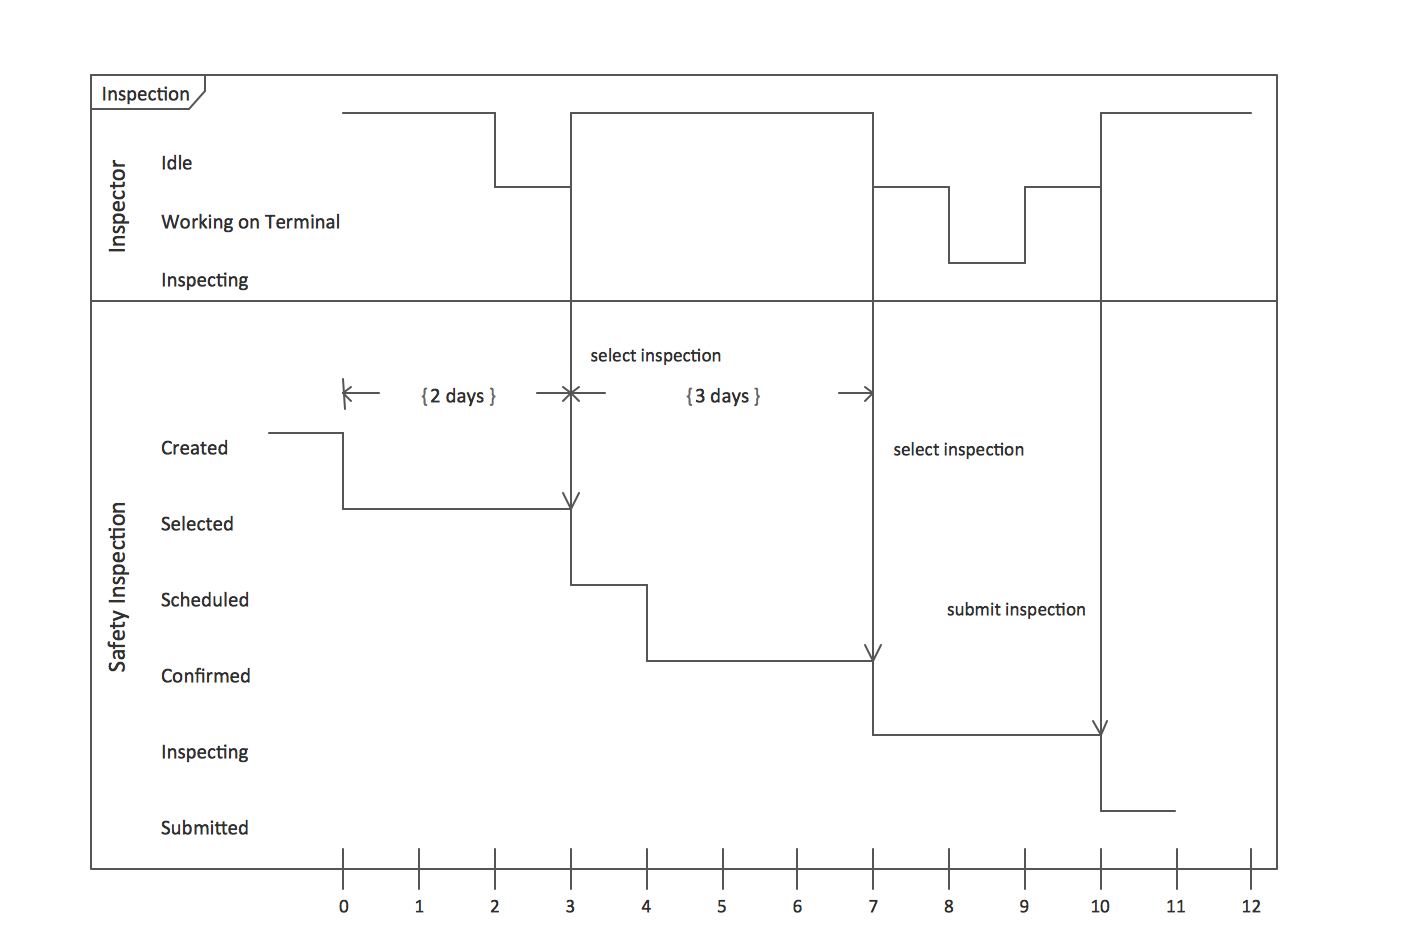
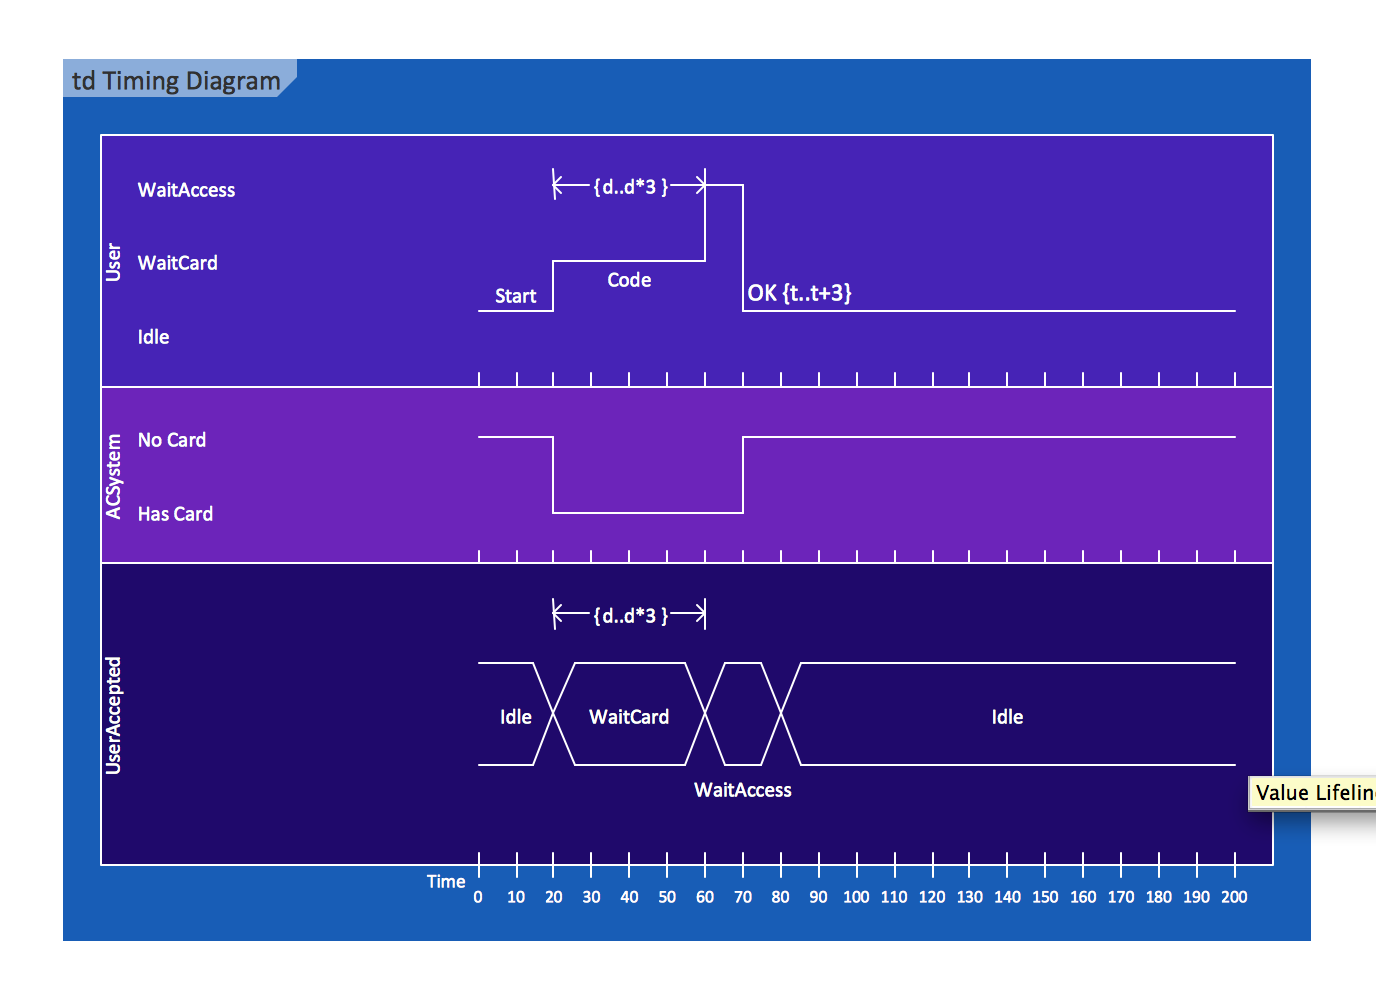
Timing Diagrams

UML Timing Diagram as special form of a sequence diagram are used to explore the behaviors of objects throughout a given period of time.

UML Timing Diagrams. Inspection Inspection UML Timing Diagram UML timing diagram

Class Diagrams

Class Diagrams describes the structure of a system by showing the system's classes, their attributes, and the relationships among the classes

UML Class Diagrams. Metadata information model Metadata information model UML Class Diagram UML class diagram

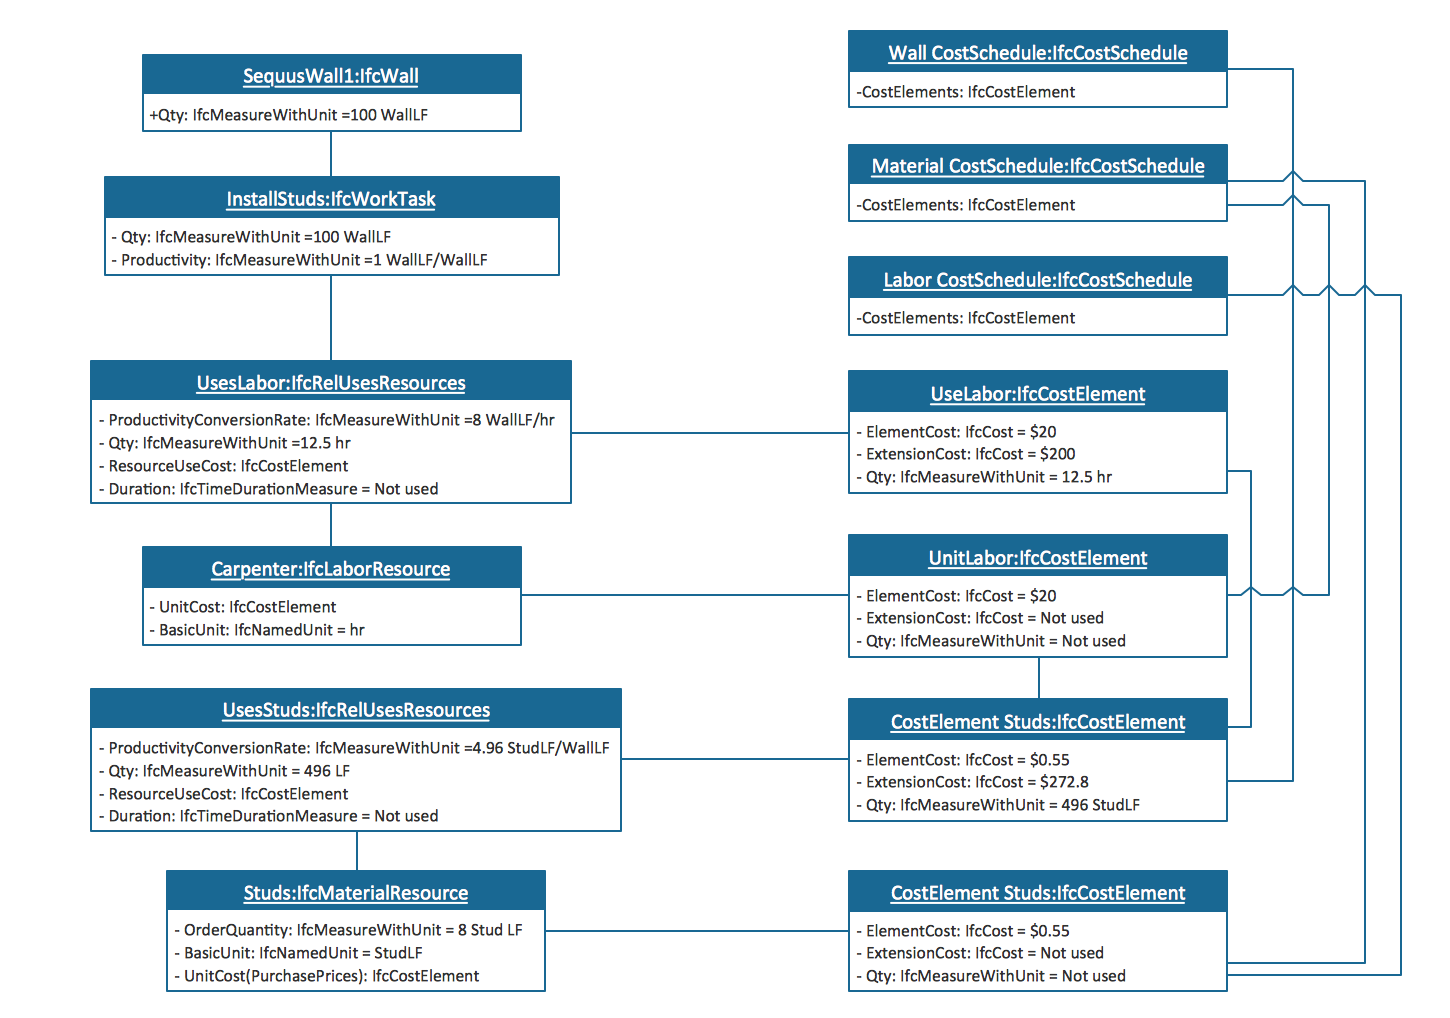
Object Diagrams

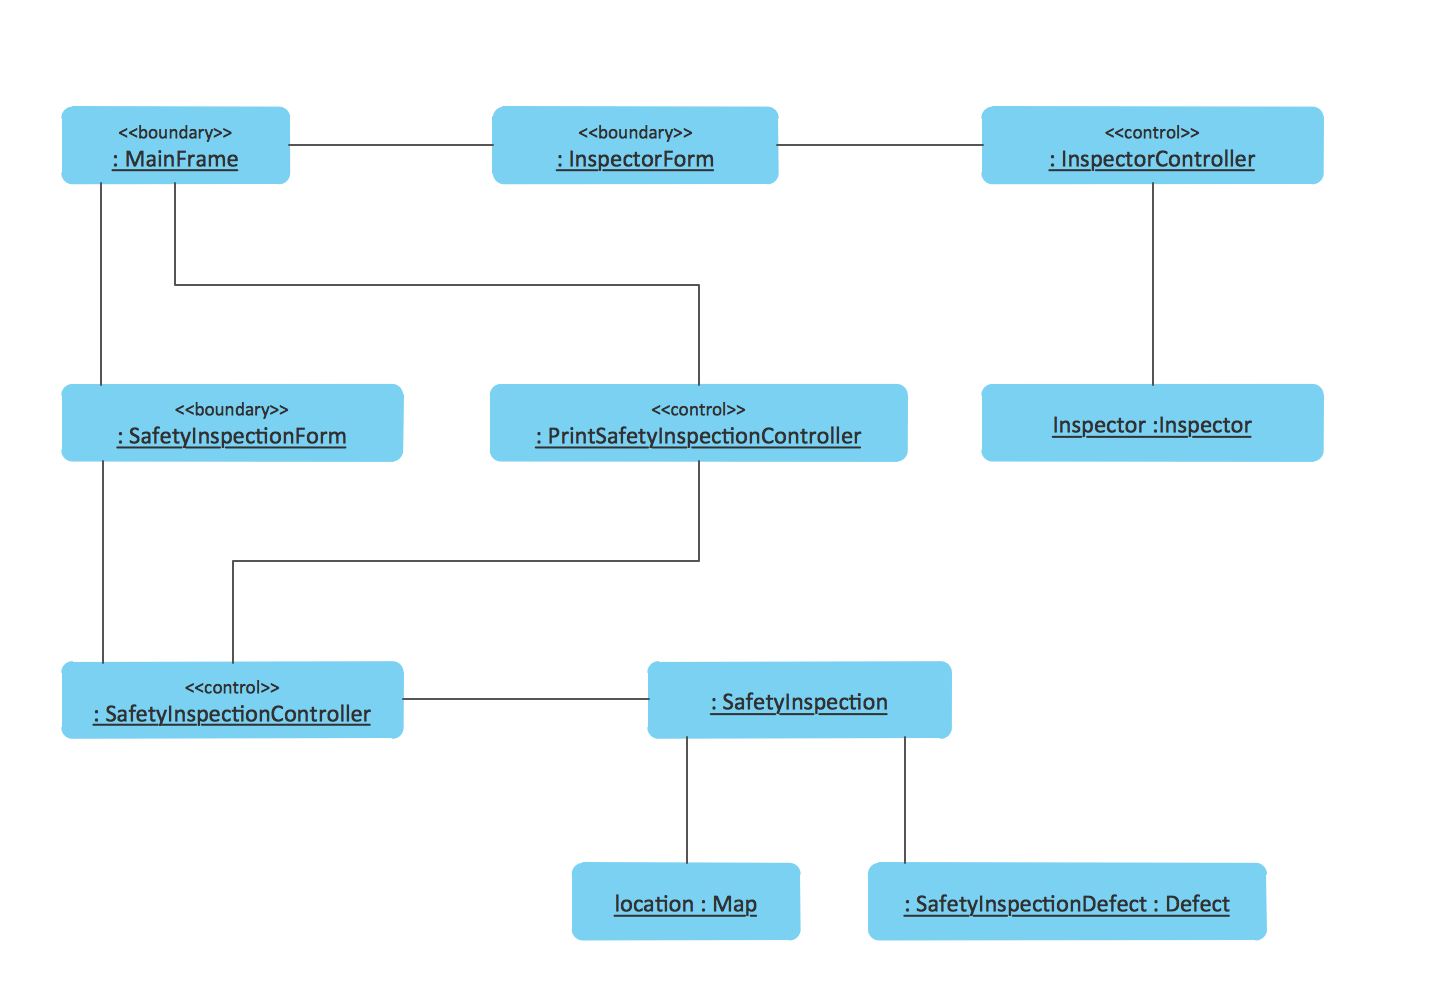
UML Object Diagram shows the structure of a modeled system at a specific time.

UML Object Diagrams. Estimating scenario Estimating scenario UML Object Diagrams. Safety inspection Safety inspection

Composite Structure Diagrams

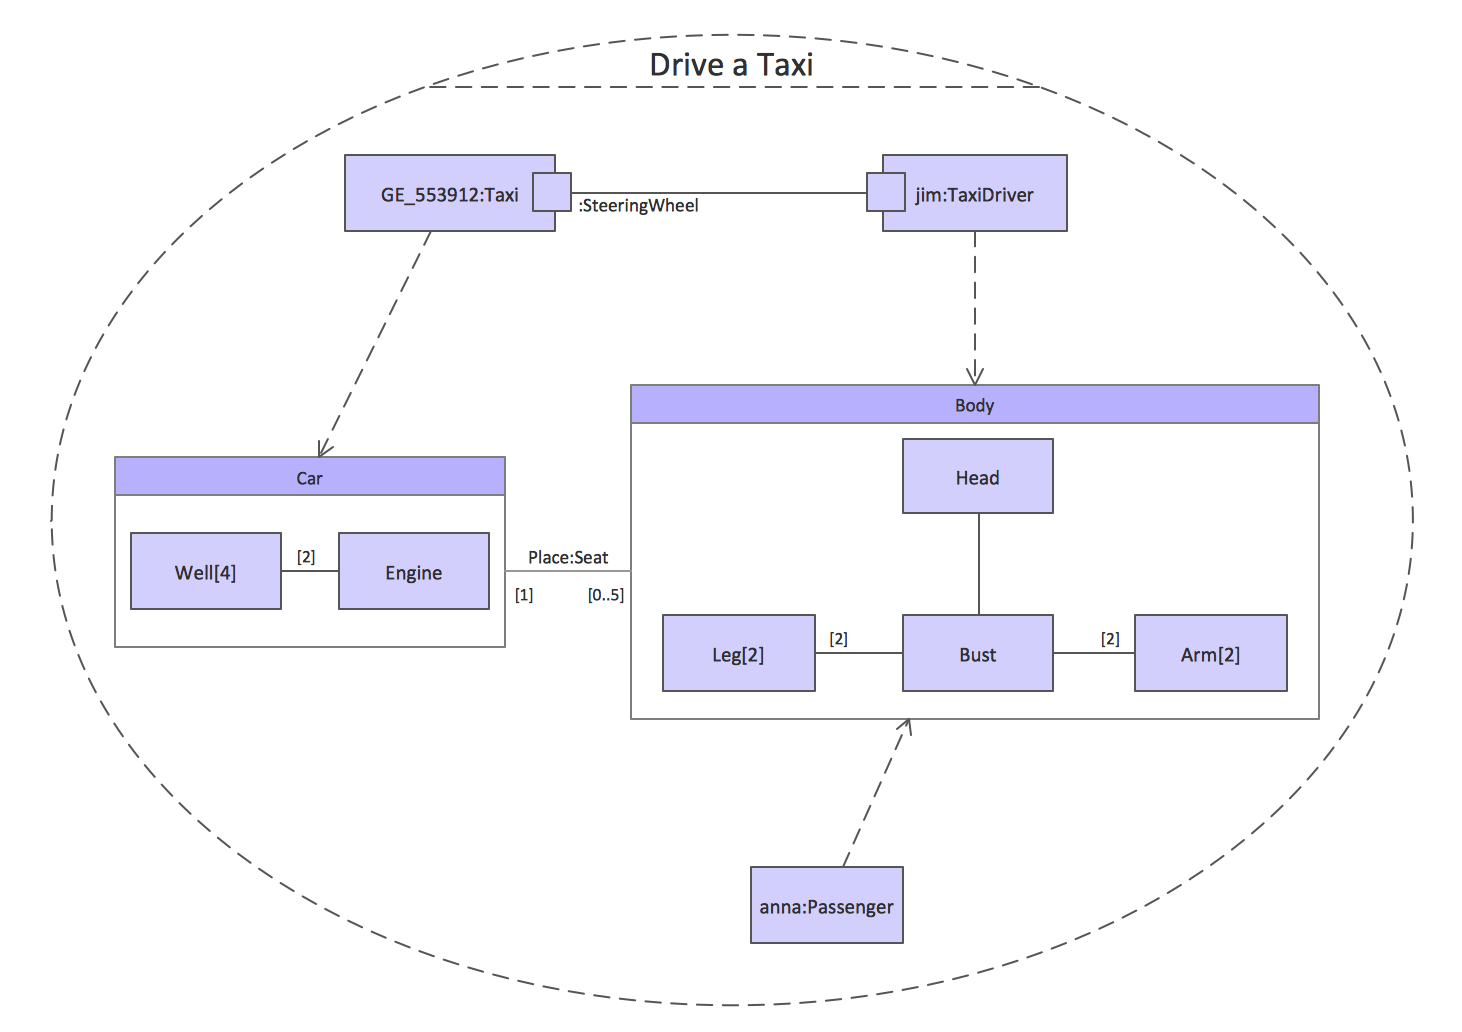
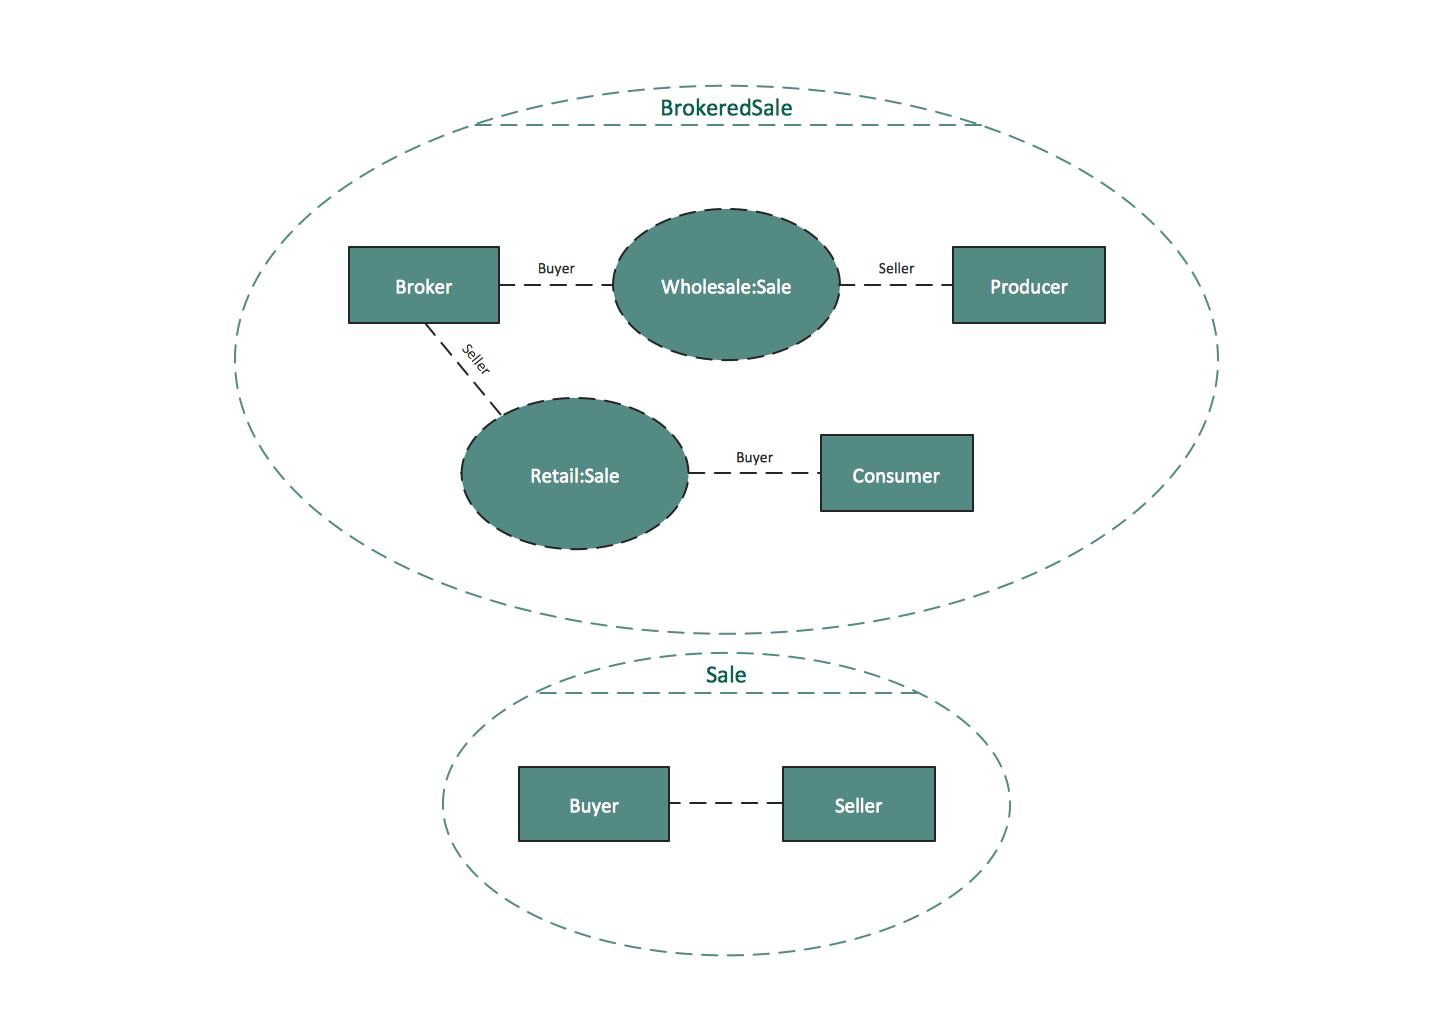
UML Composite Structure Diagram shows the internal structure of a class and the possible interactions at this structure.

UML Composite Structure Diagrams. Drive a taxi Drive a taxi UML Composite Structure Diagrams. Sale process Sale process

Interaction Overview Diagrams

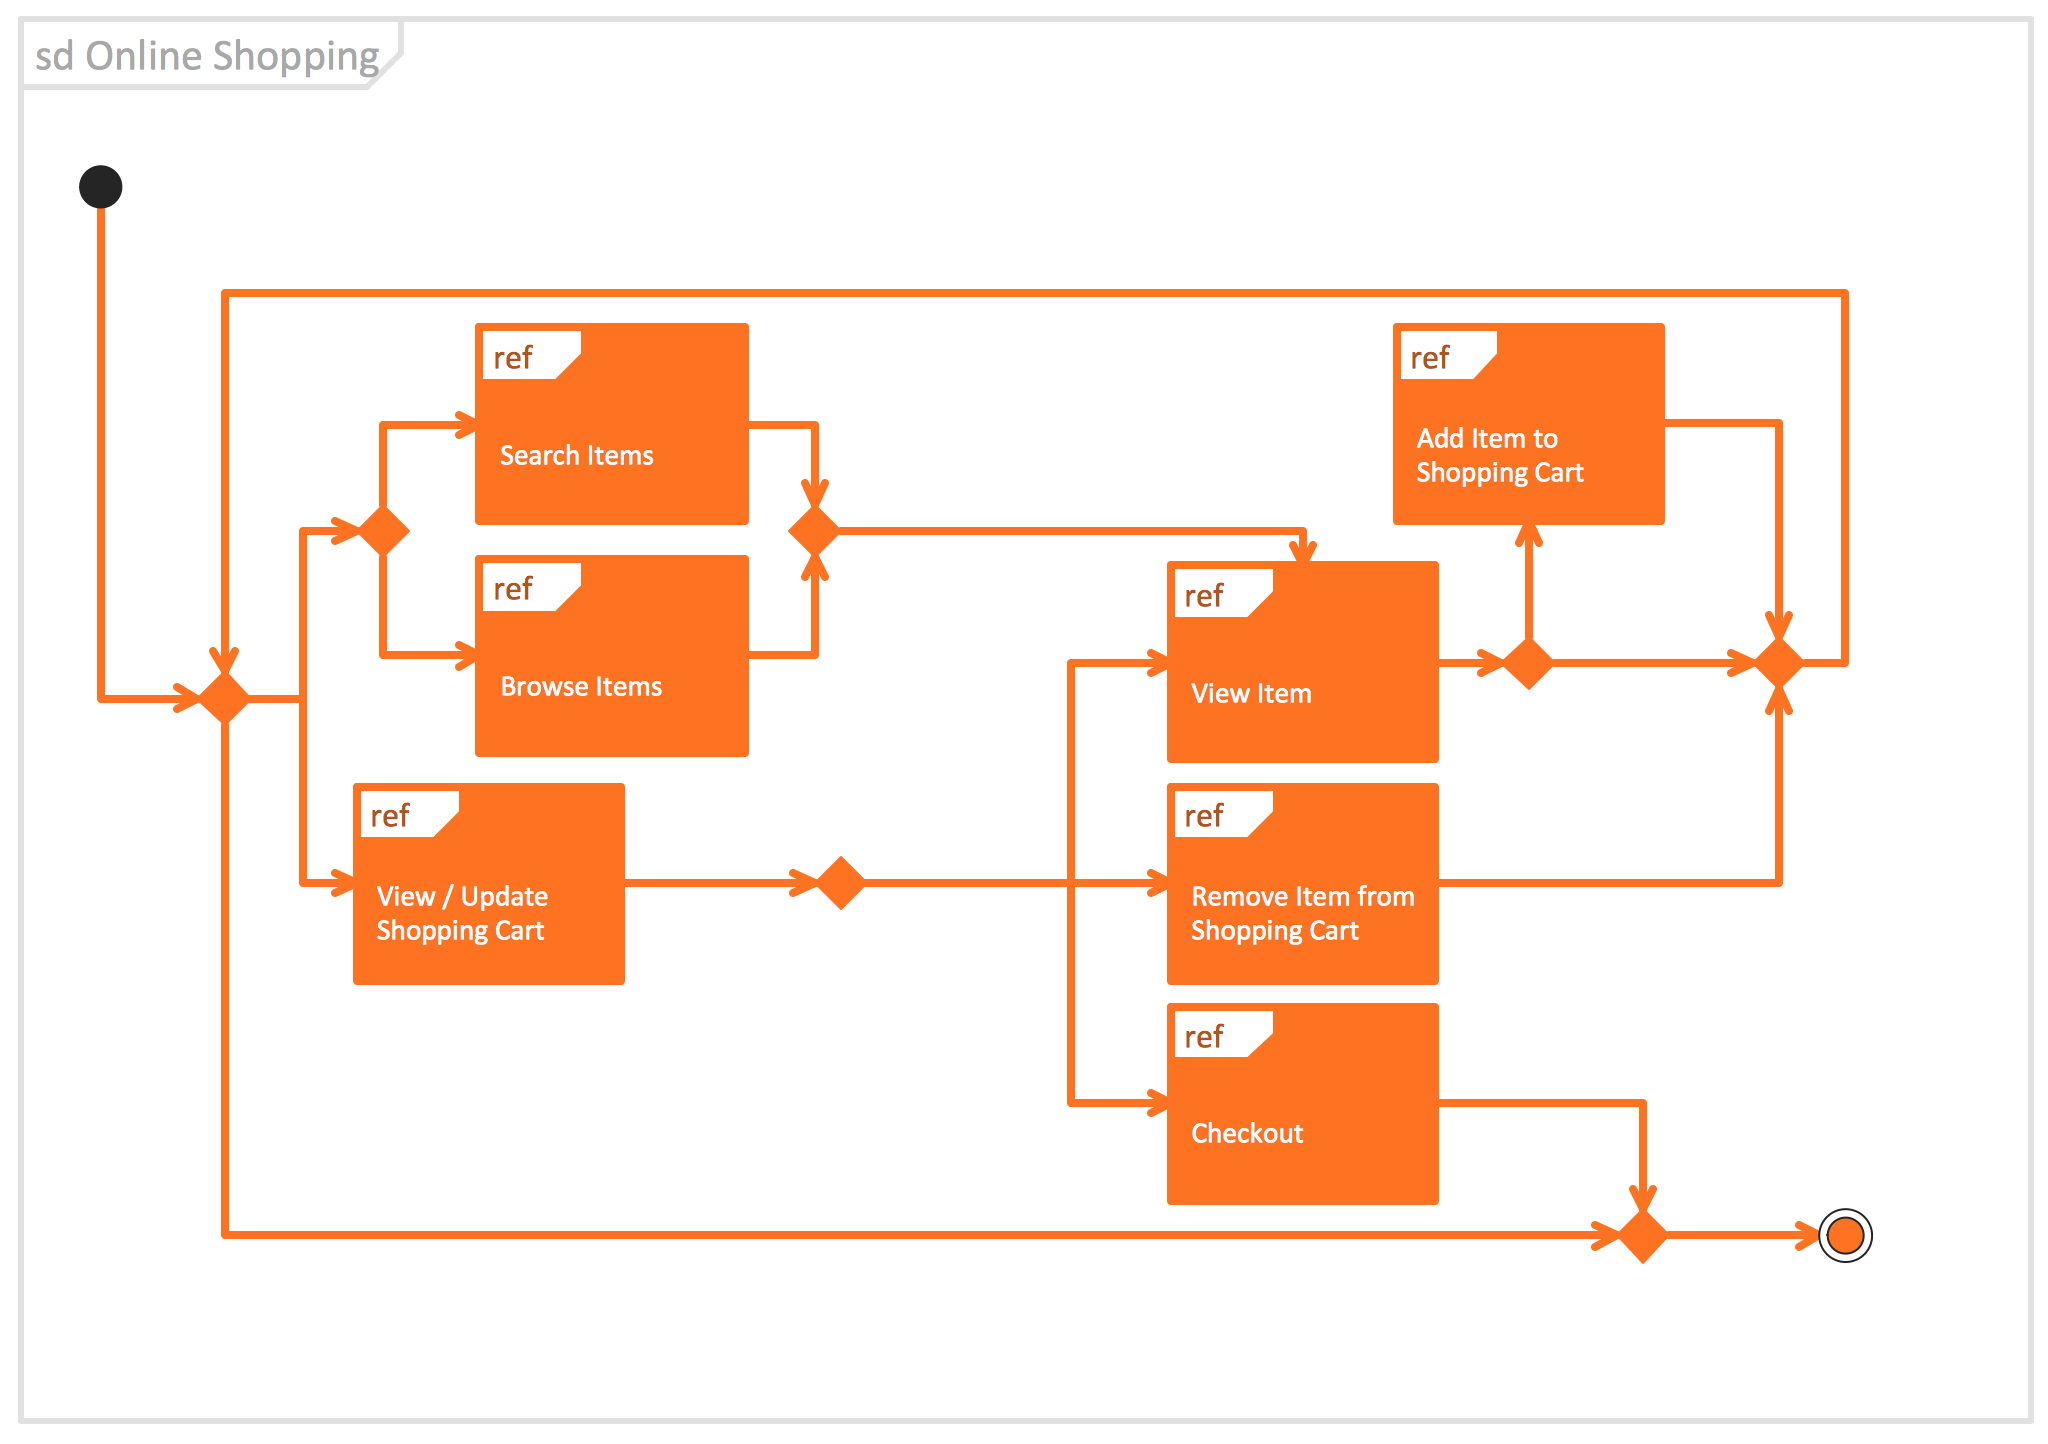
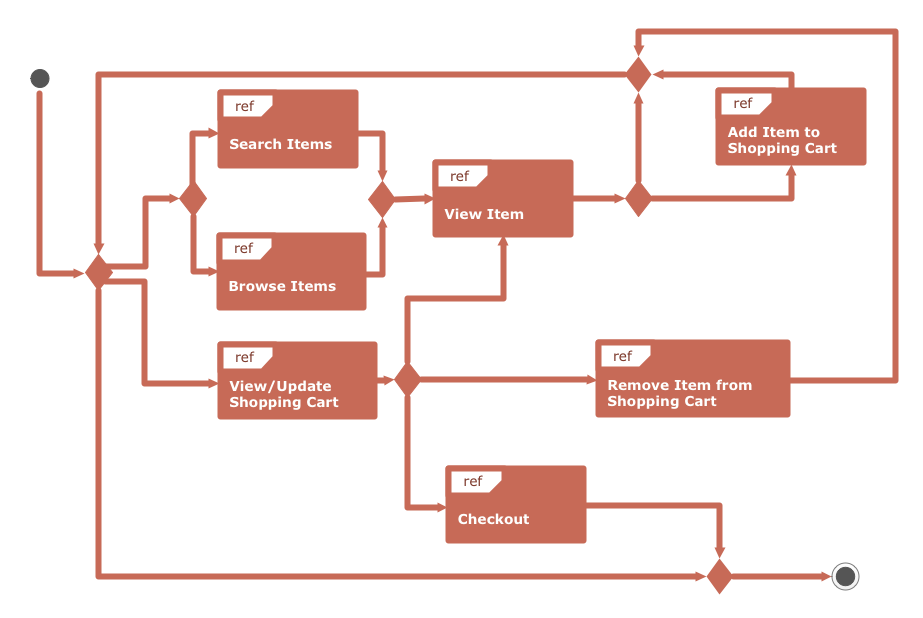
UML Interaction Overview Diagram schematically shows a control flow with nodes and a sequence of activities that can contain interaction or sequence diagrams.

UML Interaction Overview Diagrams. System authentication System authentication UML Interaction Overview Diagram UML interaction overview diagram UML Interaction Overview Diagram. Online ShoppingOnline Shopping
Use Case Diagrams

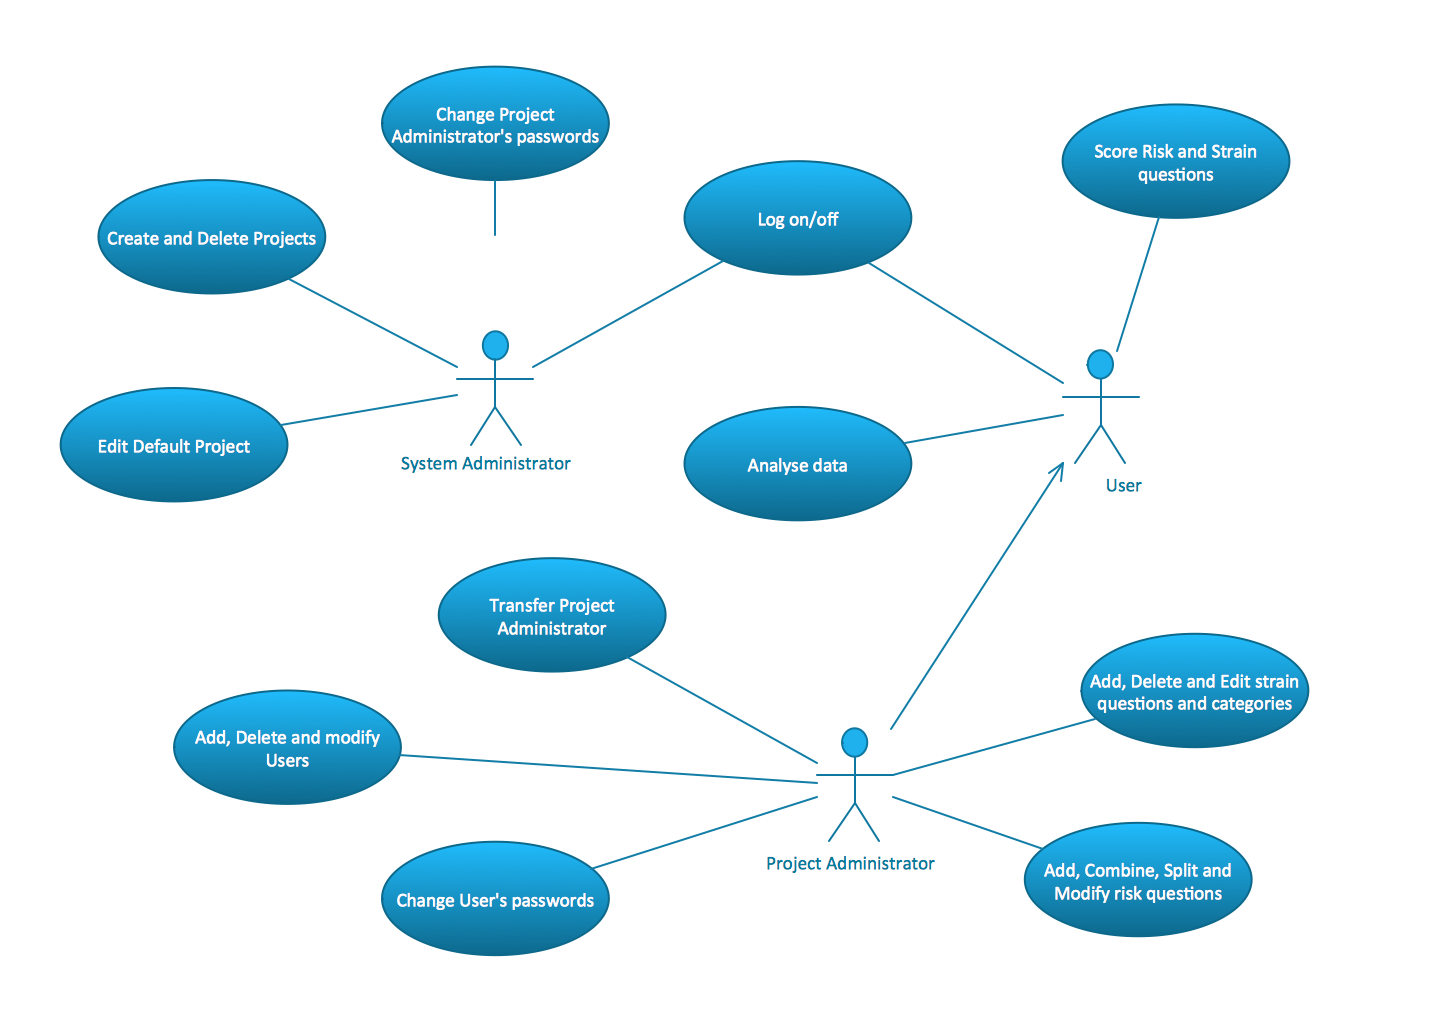
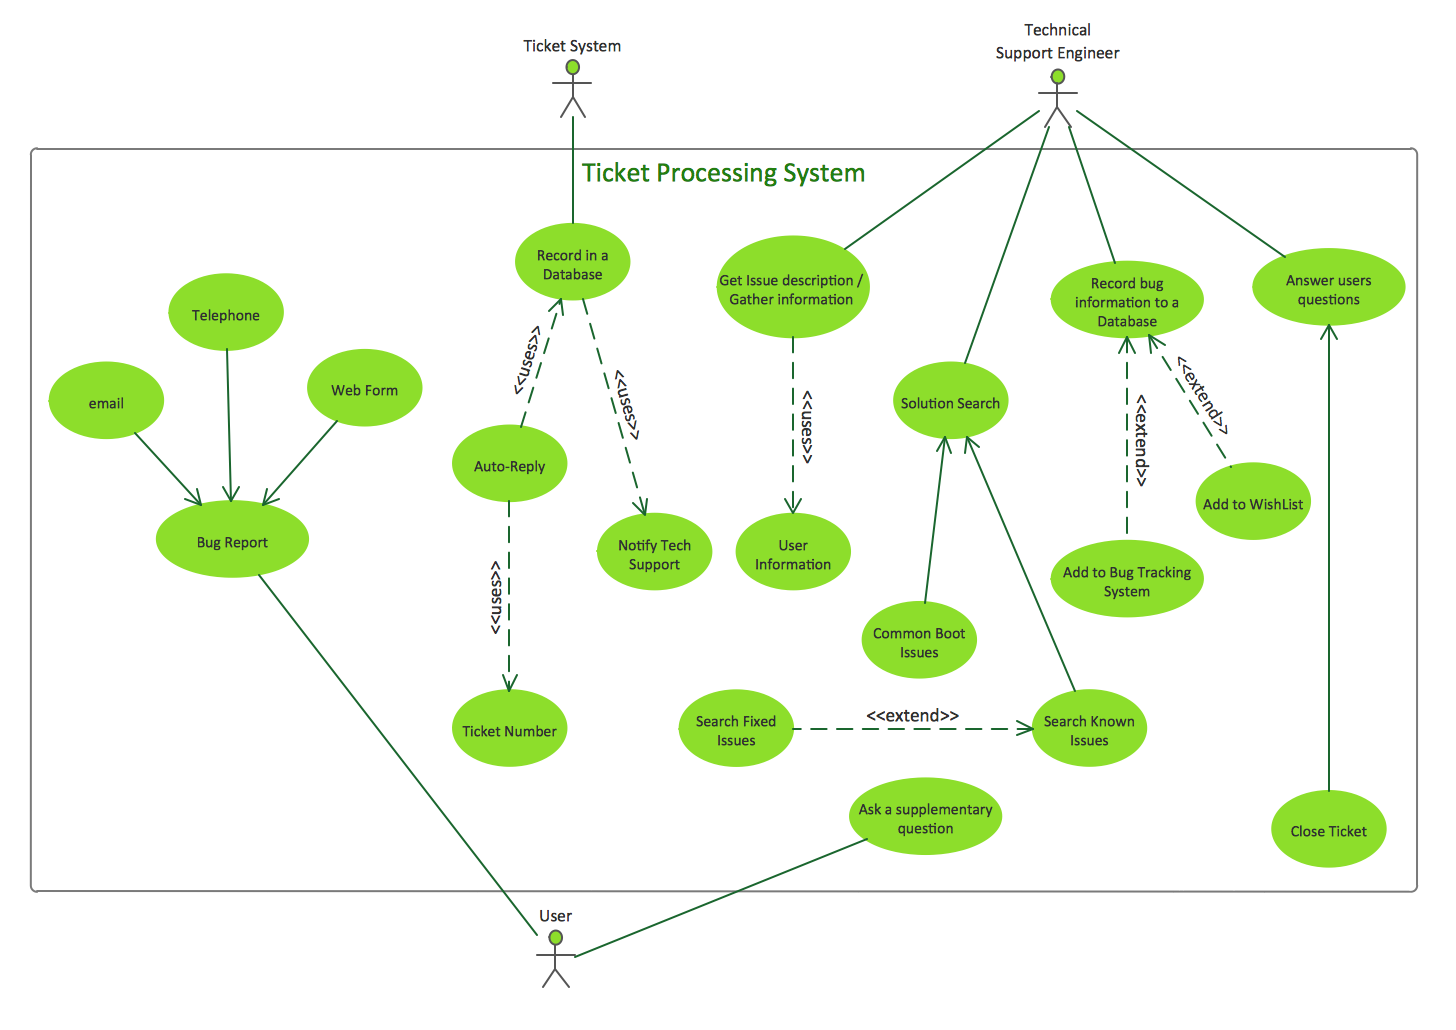
Use Case Diagrams describes the functionality provided by a system in terms of actors, their goals represented as use cases, and any dependencies among those use cases.

UML Use Case Diagrams. Project administrator Project administrator UML Use Case Diagrams. Ticket processing system Ticket processing system UML Use Case Diagrams. Trading system usage scenarios Trading system usage scenarios

Sequence Diagrams

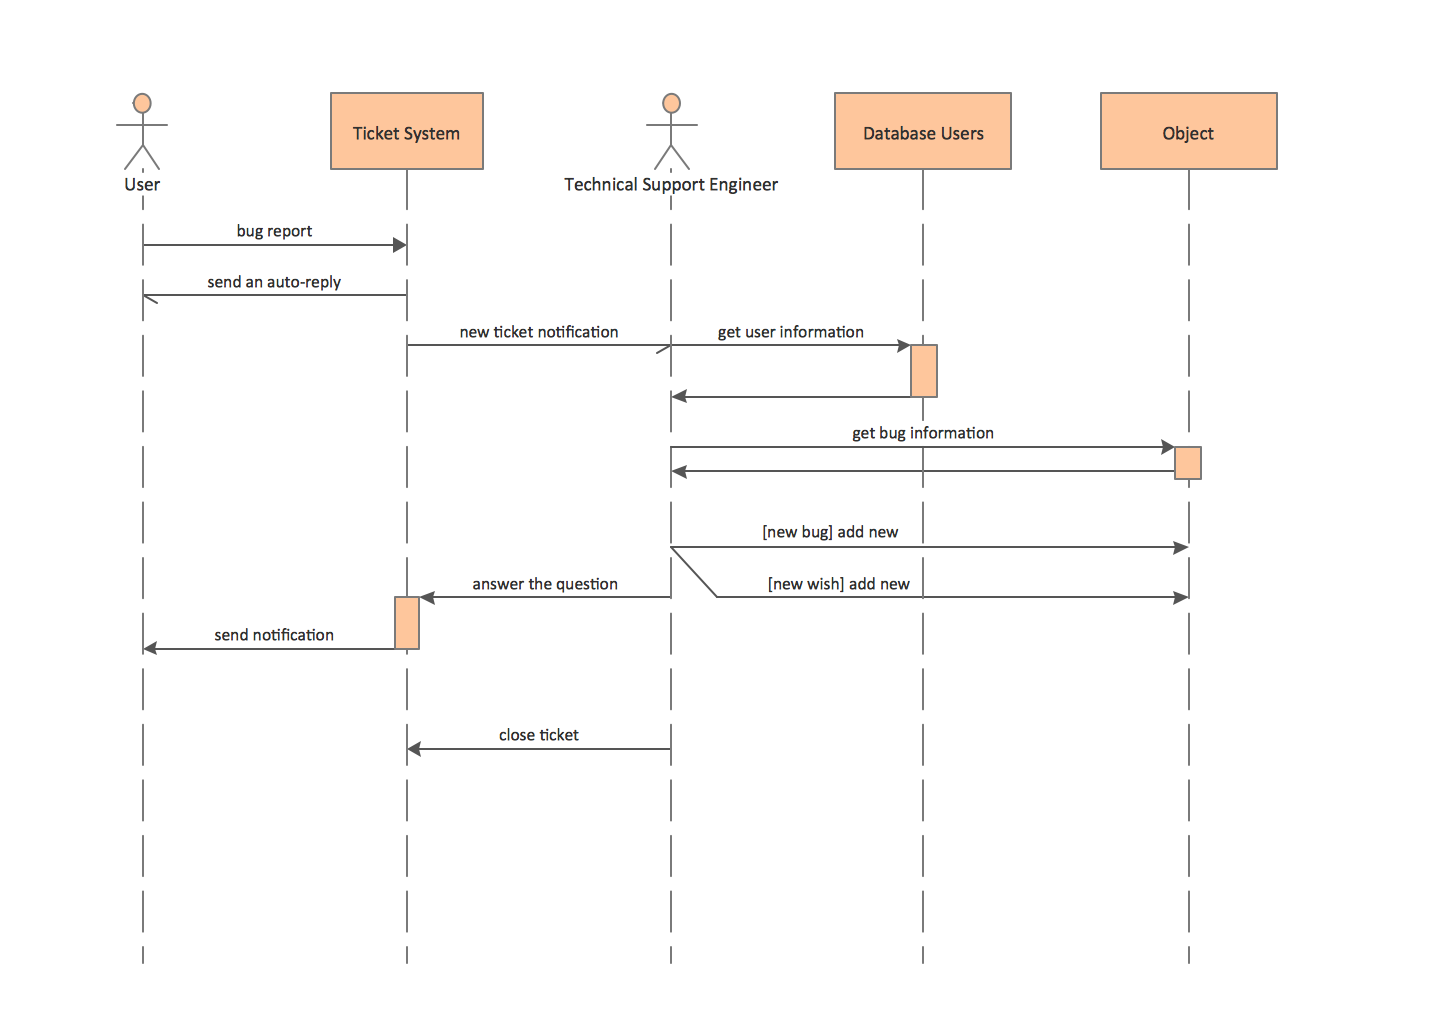
Sequence Diagrams shows how objects communicate with each other in terms of a sequence of messages. Also indicates the lifespans of objects relative to those messages.

UML Sequence Diagrams. Checking process Checking process UML Sequence Diagrams. GET request GET request UML Sequence Diagrams. Ticket processing system Ticket processing system

Activity Diagrams

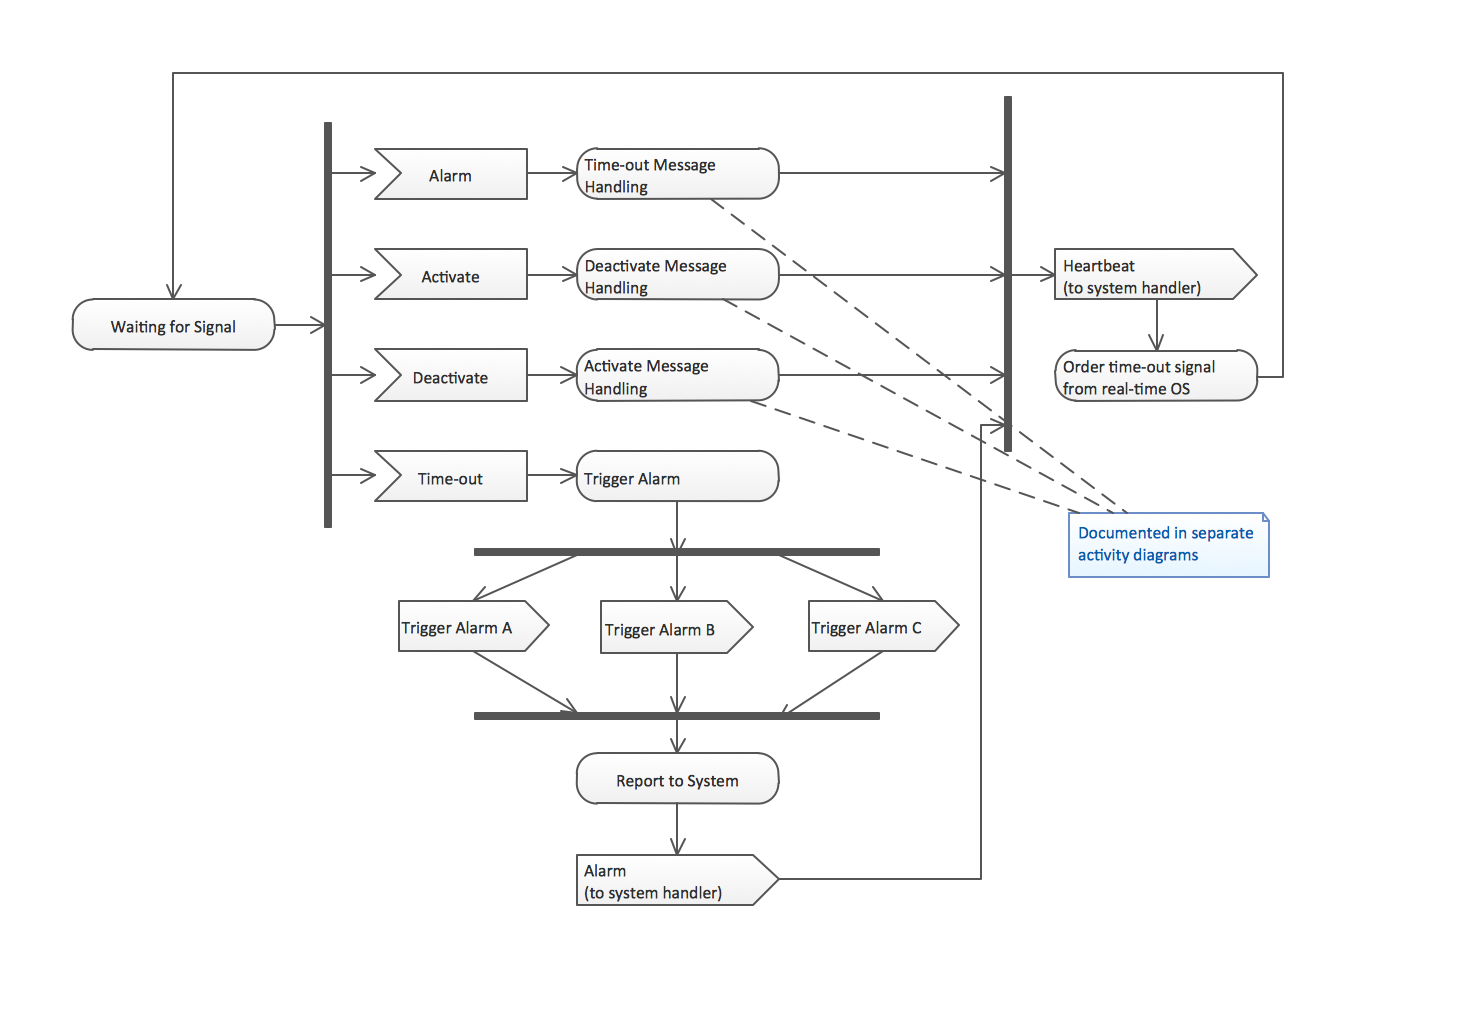
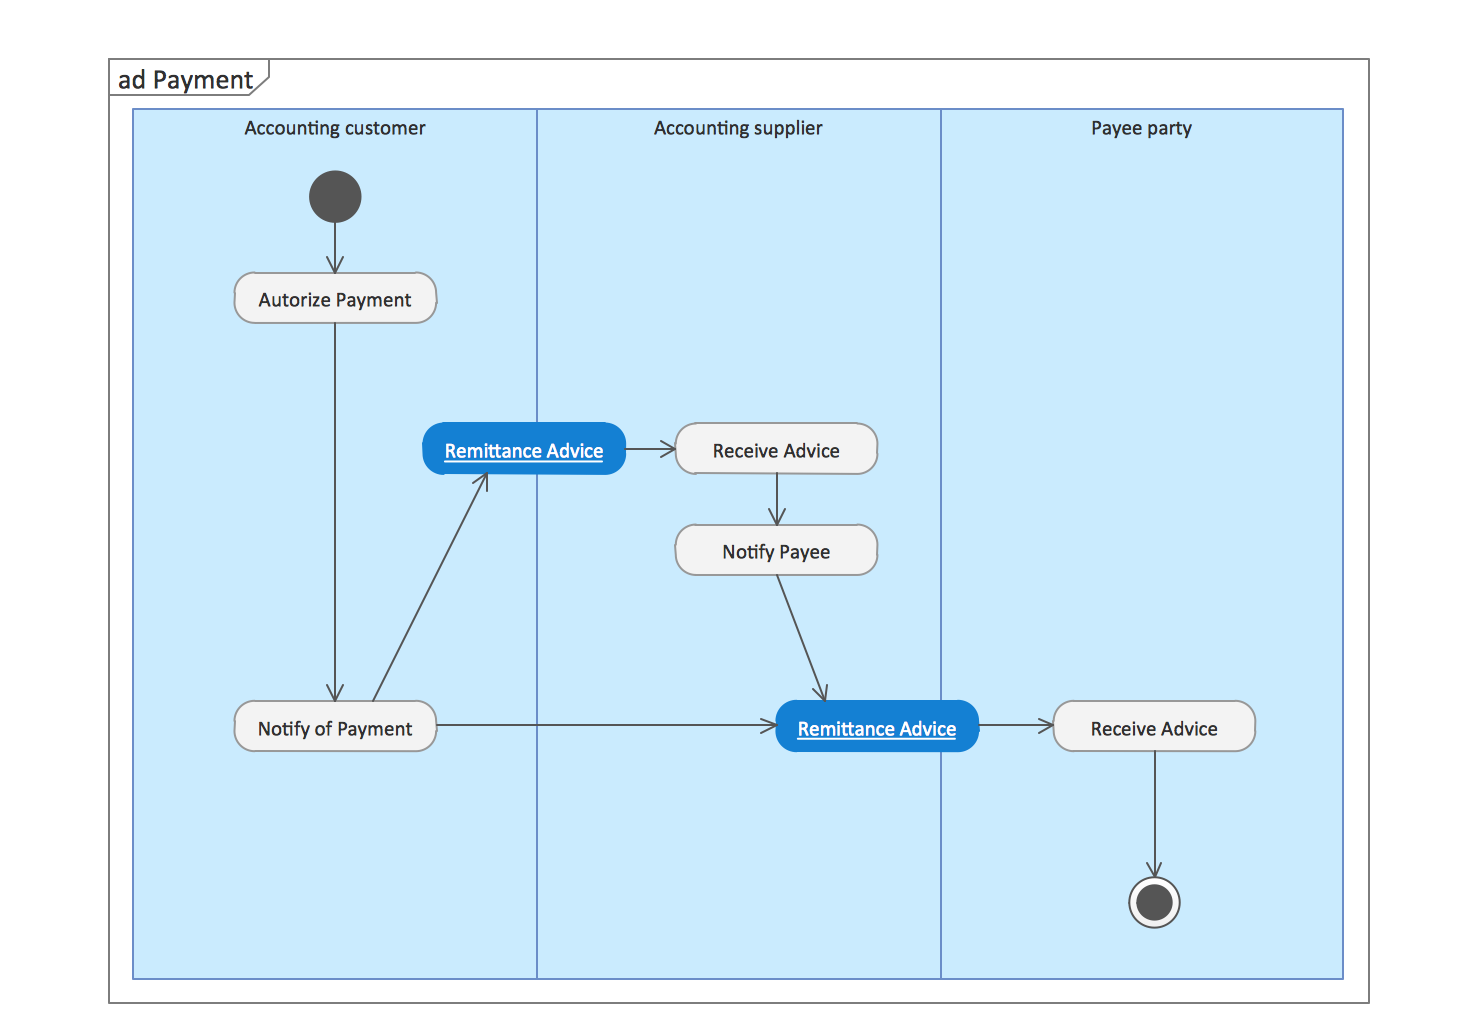
Activity diagram describes the business and operational step-by-step workflows of components in a system. An activity diagram shows the overall flow of control.

UML Activity Diagrams. Alarm trigger processing Alarm trigger processing UML Activity Diagrams. Cash withdrawal from ATM Cash withdrawal from ATM UML Activity Diagrams. Payment process Payment process

Component Diagrams

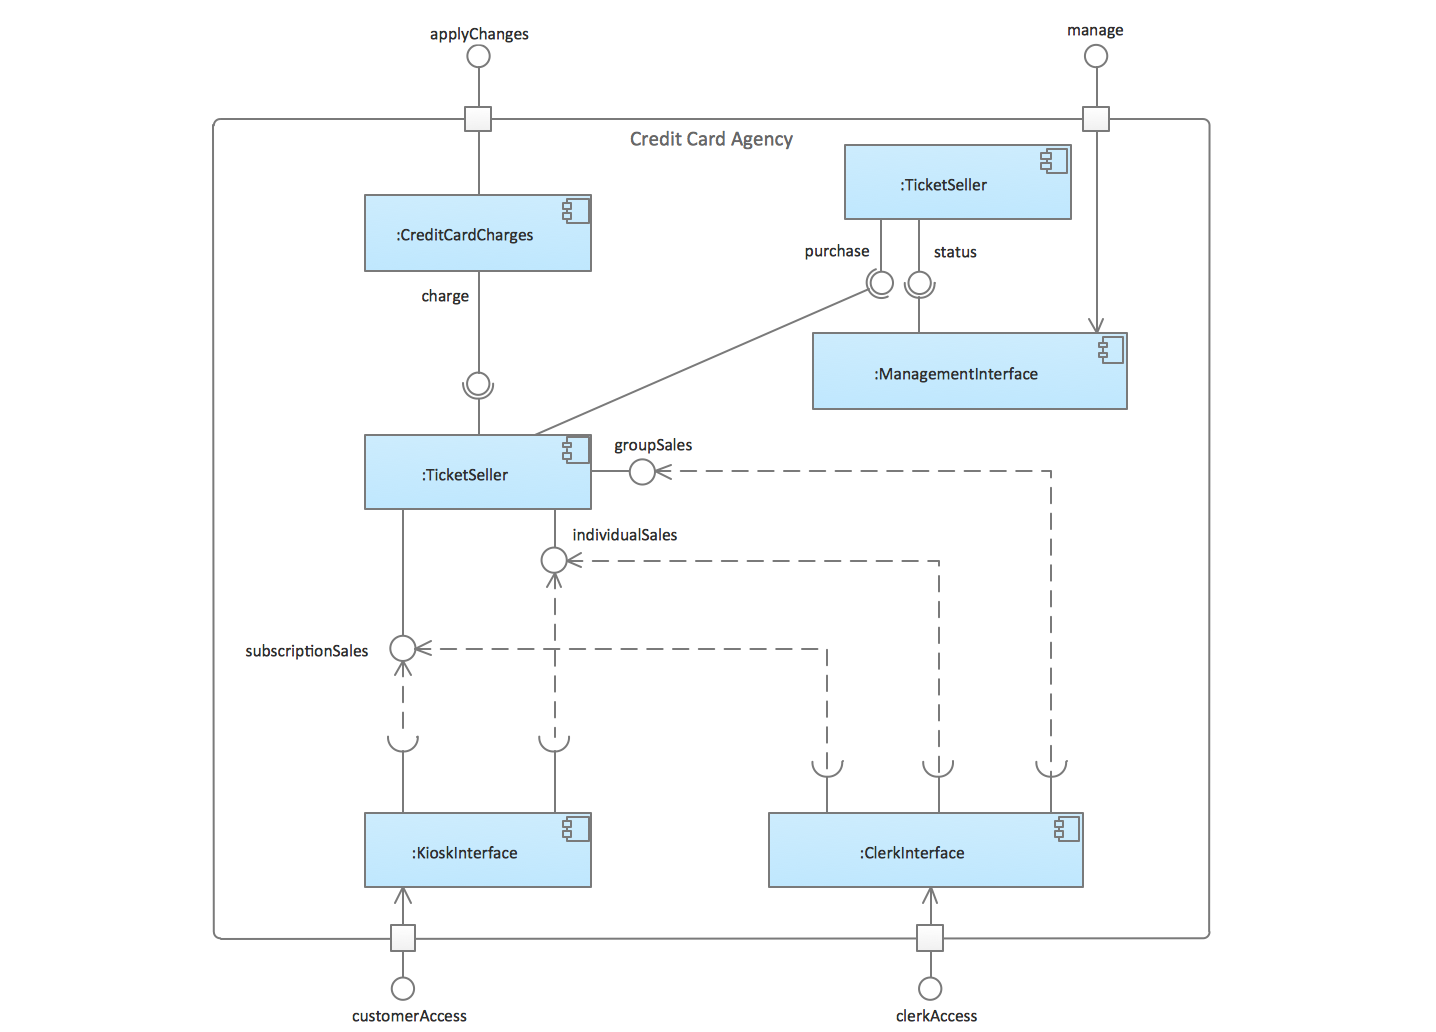
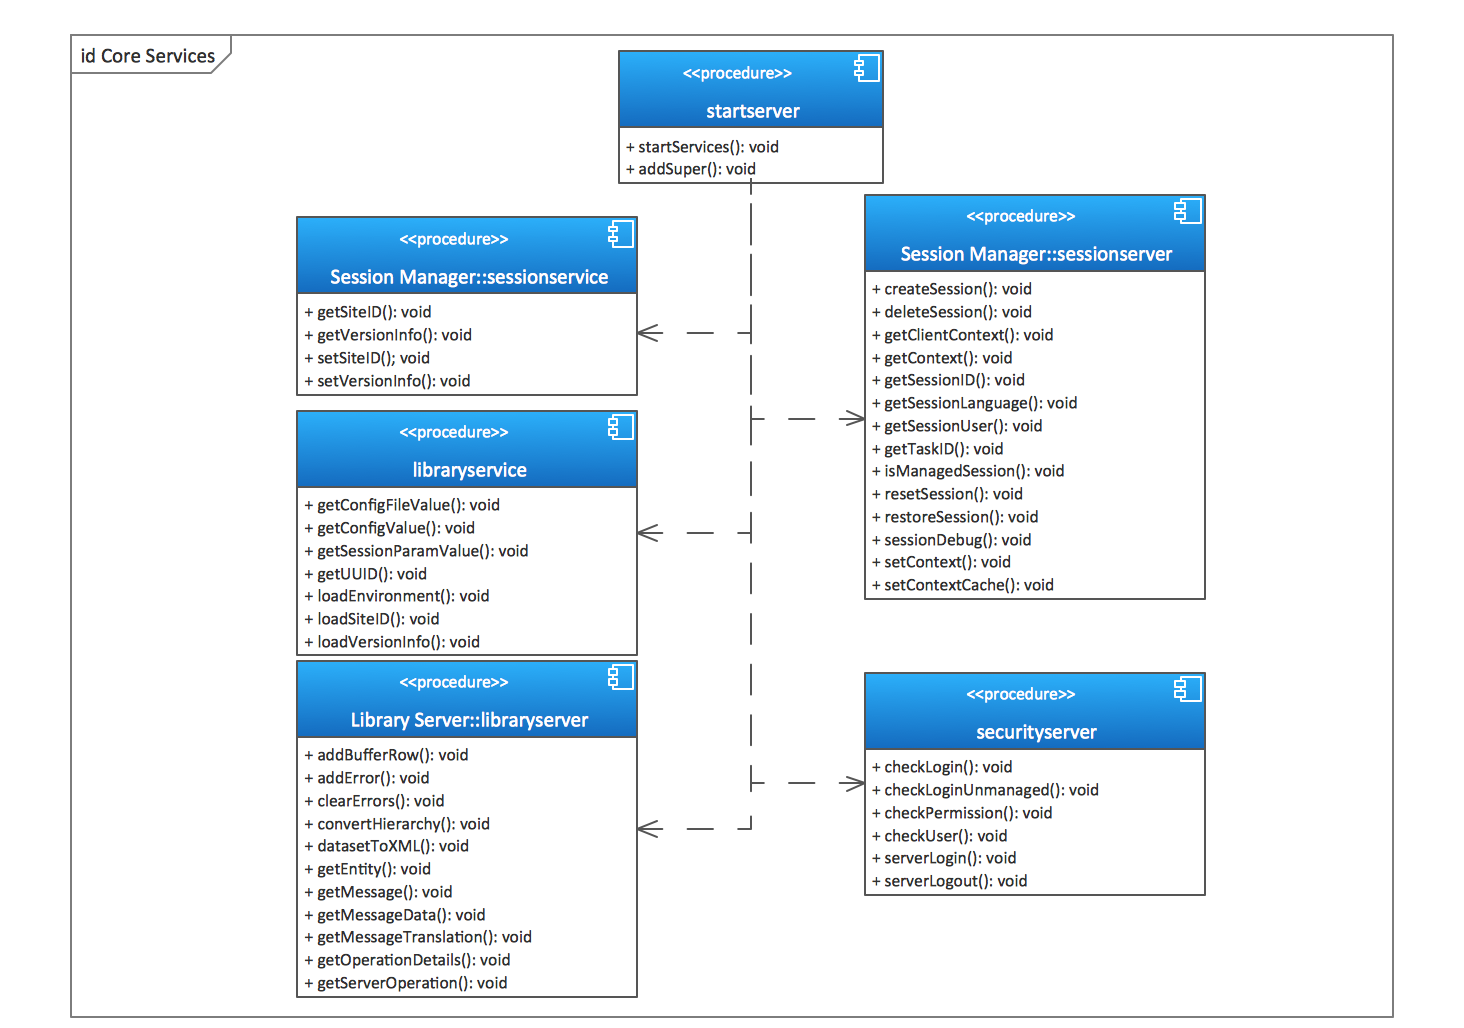
UML Component Diagram illustrate how components are wired together to larger components and software systems that shows the structure of arbitrarily complex systems.

UML Component Diagrams. Credit card agency Credit card agency UML Component Diagrams. Start server Start server UML Component Diagram UML component diagram template

Deployment Diagrams

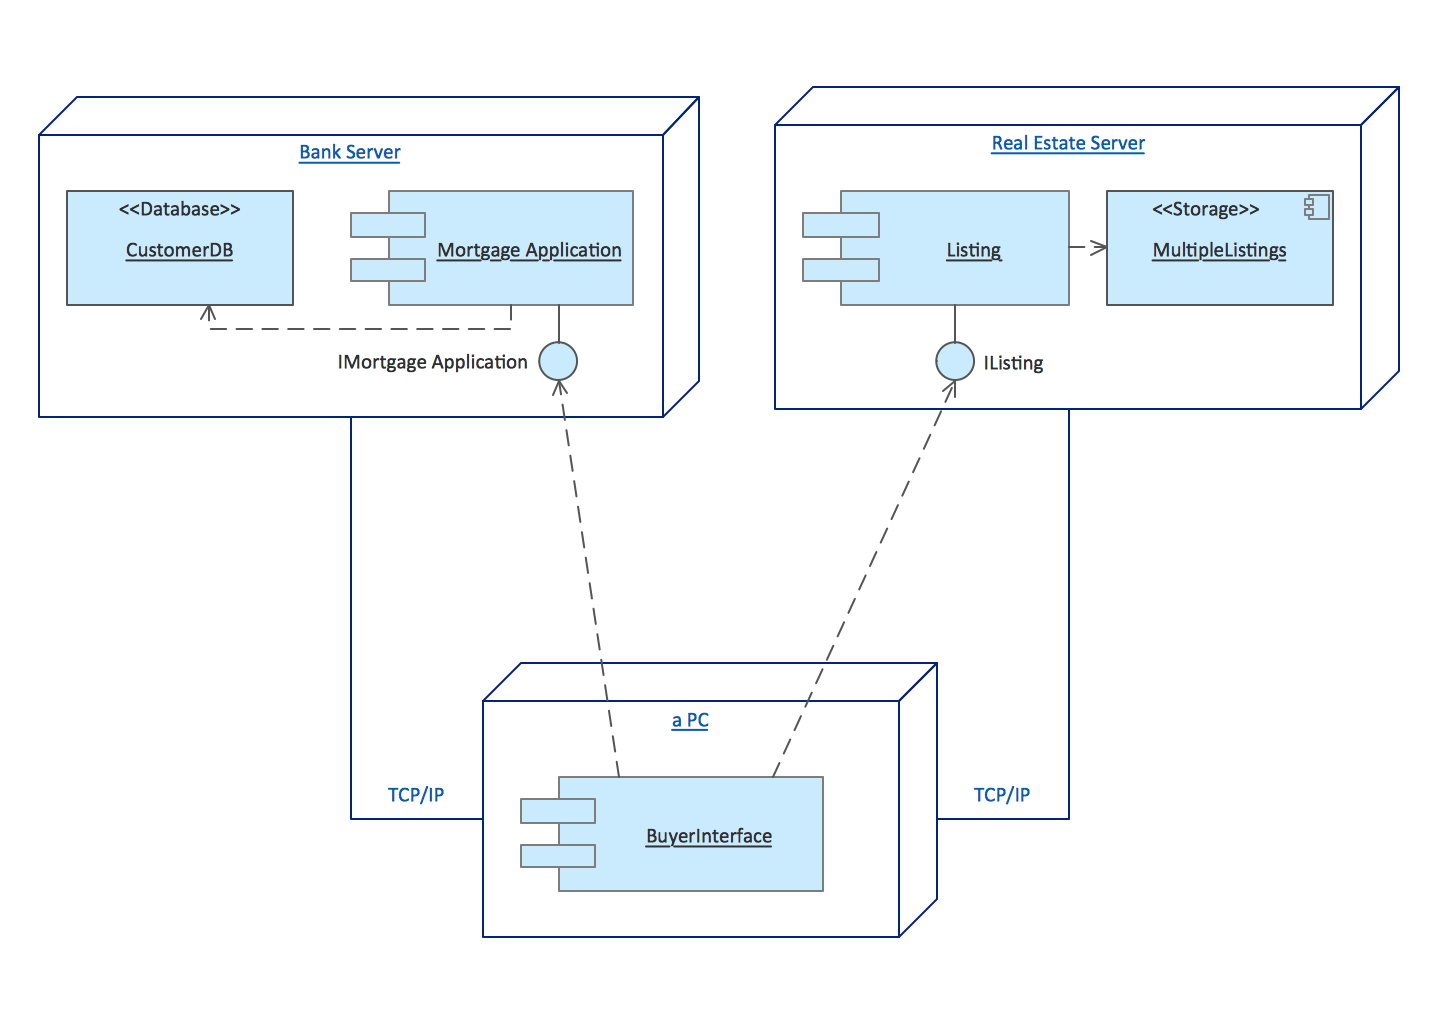
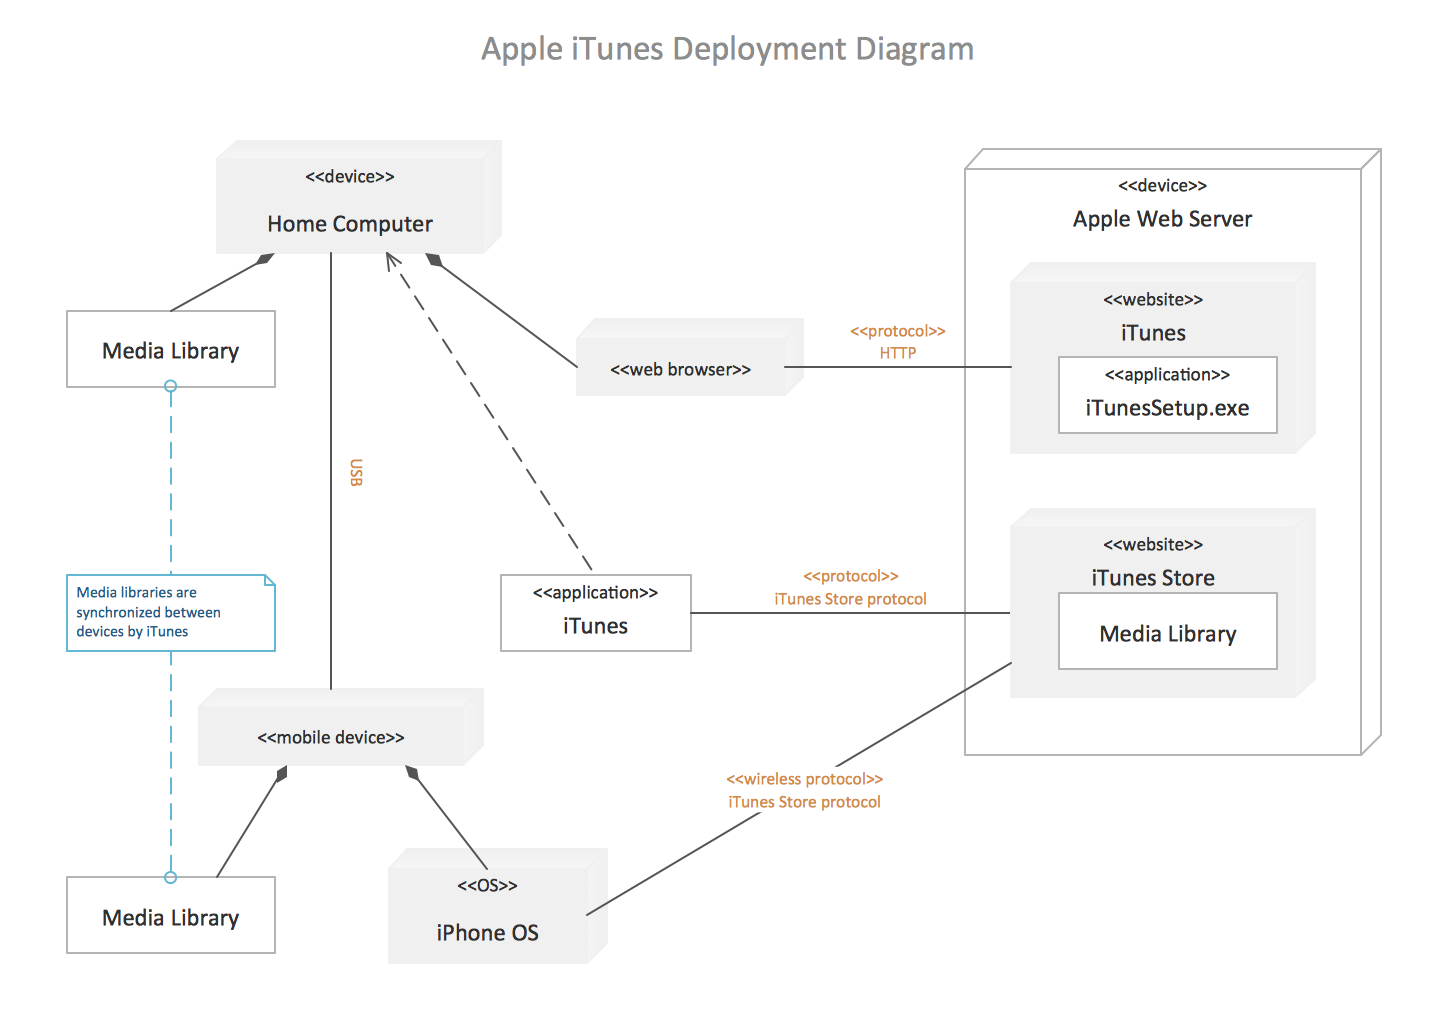
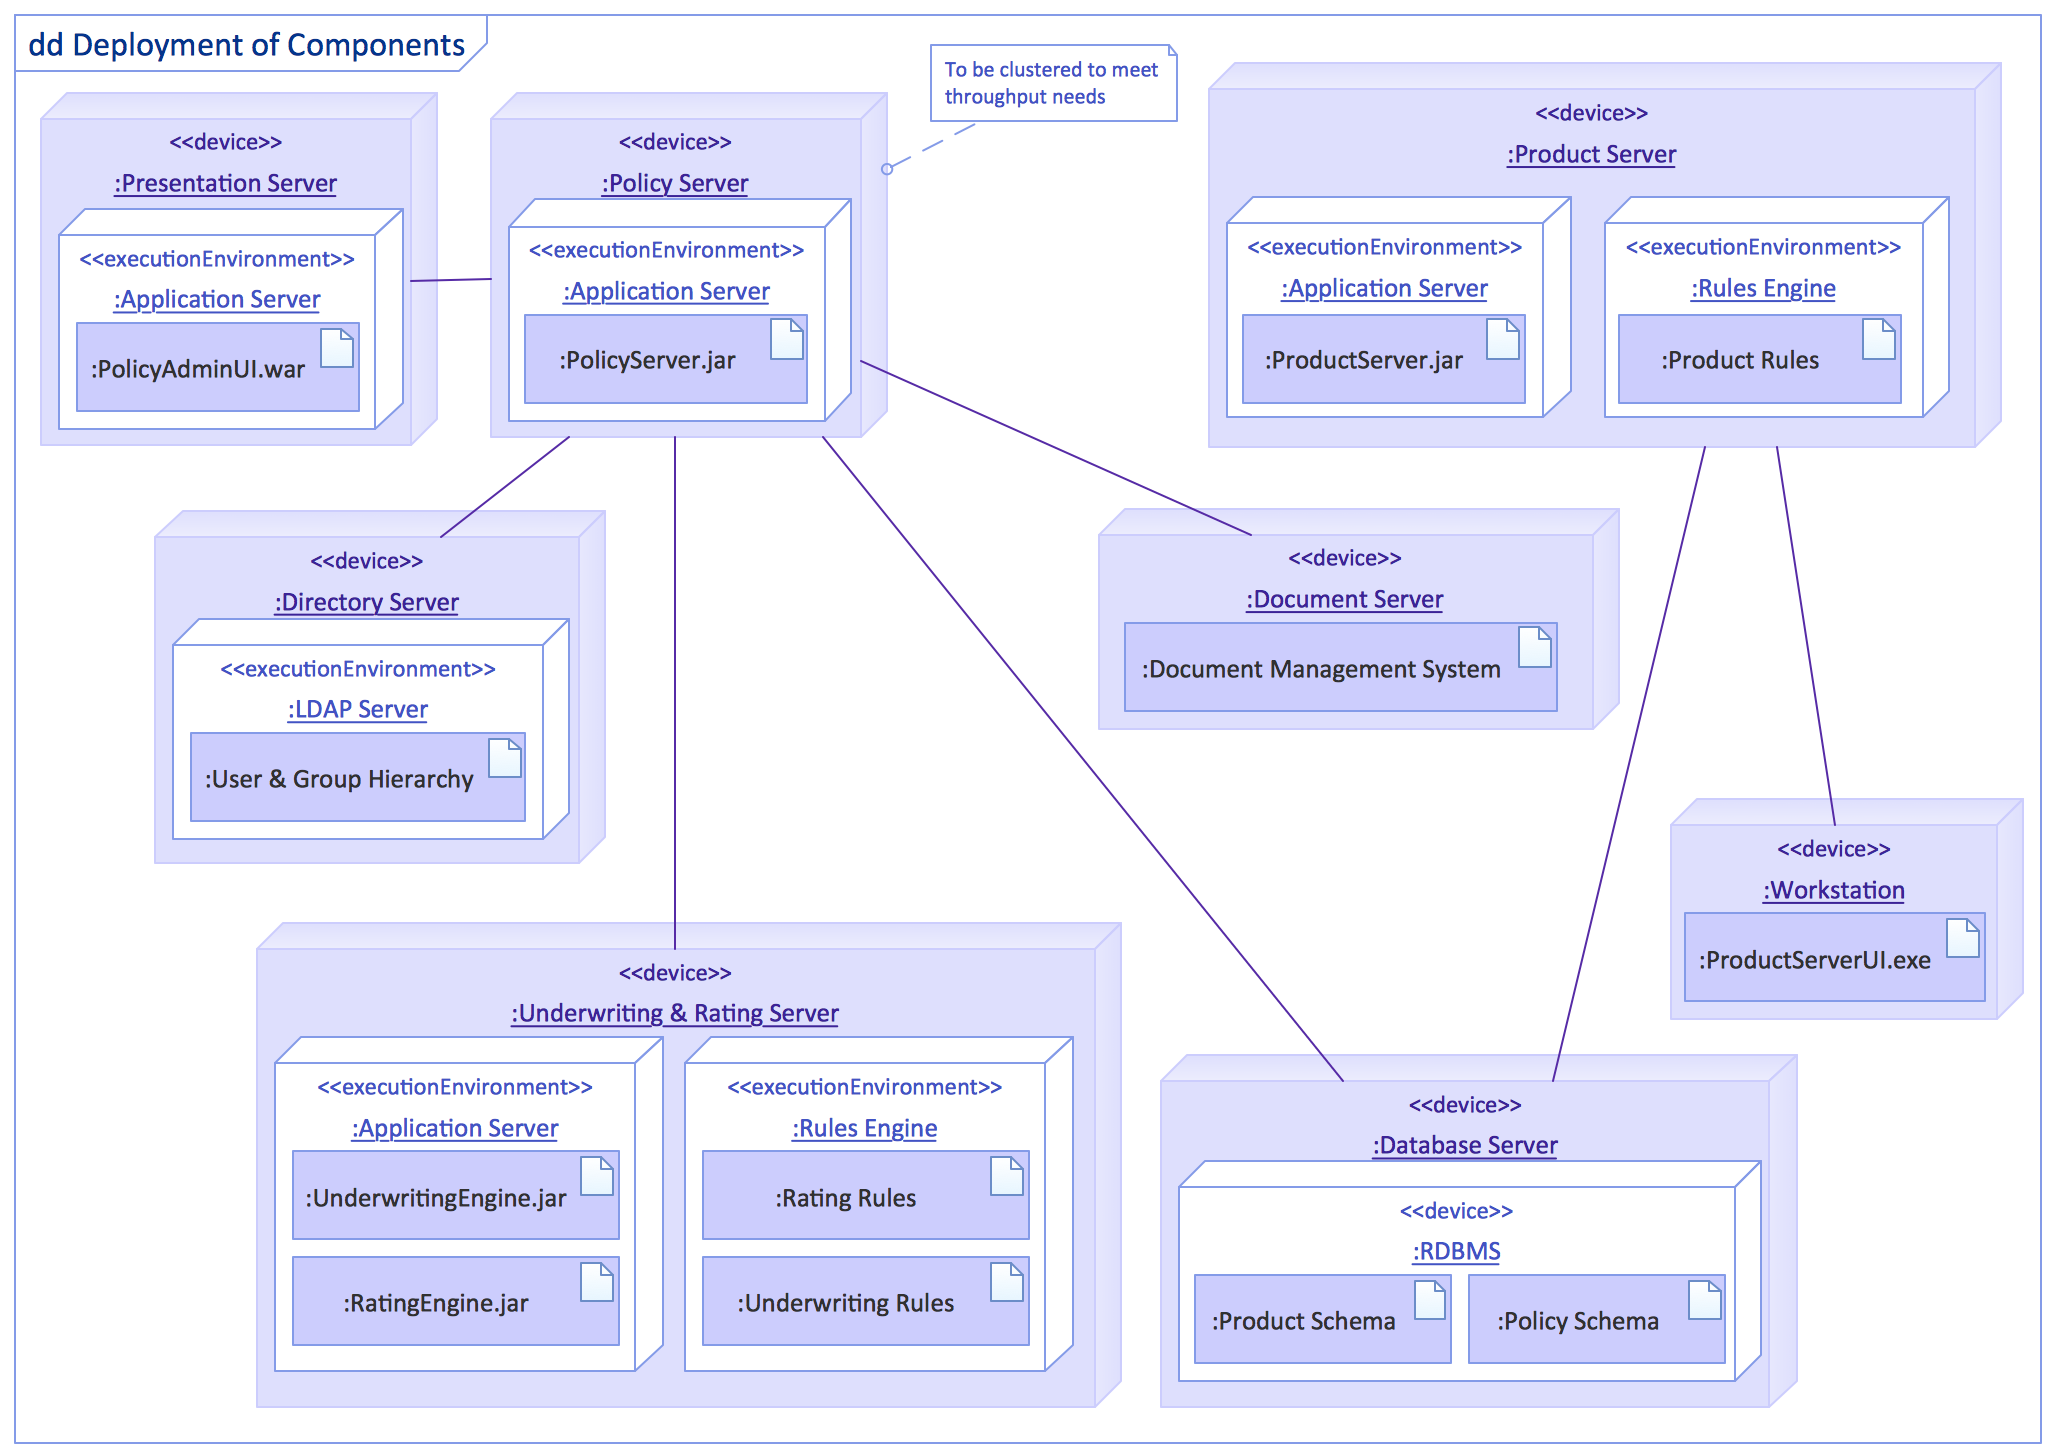
Deployment diagram describes the hardware used in system implementations and the execution environments and artifacts deployed on the hardware.

UML Deployment Diagrams. Real estate transactions Real estate transactions UML Deployment Diagram example UML deployment diagram example UML Deployment Diagram UML deployment diagram

Free Download UML Software and View All Examples

UML Tool & UML Diagram Examples *

Pic 2. UML use case diagram template. Ticket processing system


The following features make ConceptDraw DIAGRAM the best UML Diagram Software:

  1. You don't need to be an artist to draw professional looking diagrams in a few minutes.
  2. Large quantity of ready-to-use vector objects makes your drawing UML diagrams quick and easy.
  3. Great number of predesigned templates and samples give you the good start for your own diagrams.
  4. ConceptDraw DIAGRAM provides you the possibility to use the grid, rules and guides. You can easily rotate, group, align, arrange the objects, use different fonts and colors to make your diagram exceptionally looking.
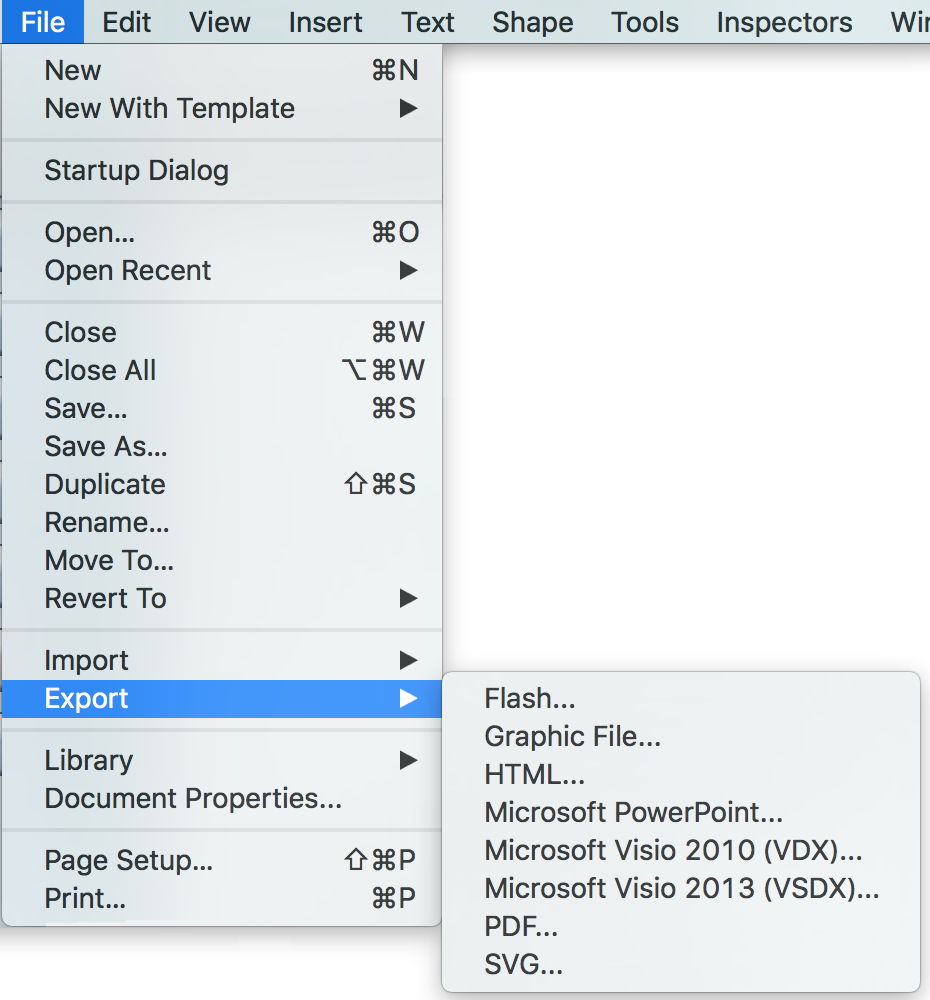
  5. All ConceptDraw DIAGRAM documents are vector graphic files and are available for reviewing, modifying, and converting to a variety of formats: image, HTML, PDF file, MS PowerPoint Presentation, Adobe Flash, MS Visio.

    uml class diagram - export

  6. Using ConceptDraw STORE you can navigate through ConceptDraw Solution Park, managing downloads and updates. You can access libraries, templates and samples directly from the ConceptDraw STORE.

    uml class diagram solution

  7. If you have any questions, our free of charge support is always ready to come to your aid.


TEN RELATED HOW TO's:
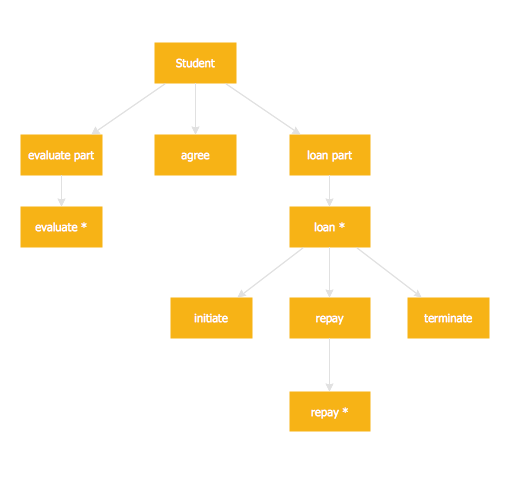
Jackson System Development (JSD) is a linear method of system development created by Michael A. Jackson and John Cameron in the 1980s. It comprises the whole software life cycle directly or providing a framework for more specialized techniques. When implementing the Jackson System Development method and designing JSD diagrams, you can succesfully use the powerful and helpful tools of ConceptDraw DIAGRAM software extended with Entity-Relationship Diagram (ERD) solution from the Software Development area of ConceptDraw Solution Park.JSD - Jackson system development *
Picture: JSD - Jackson system development
Related Solution:
ER-modeling nowadays is a very popular approach for database design. If you are tired of looking for a good entity relationship diagram Software for Mac, then your search is almost over. ConceptDraw DIAGRAM is a great tool for creating diagrams of any complexity with tons of editable samples and templates. This diagram represents the vector library of the Chen’s and Crow’s Foot notation icons for drawing ERD (entity-relationships diagram). ConceptDraw Entity Relationship Diagram solution delivers the ability to visualize databases structure on both Mac and PC. The "bricks" entity-relationships models are the entity, and the relation. An entity is represented by a rectangle comprising the entity name. It means an object, information about which should be available and stored. A relation is intended to show a relations between two entities. There are several types of relations between entities. To show there are a number of different symbols for the types of relationships.Entity Relationship Diagram Software for Mac *
Picture: Entity Relationship Diagram Software for Mac
Related Solution:
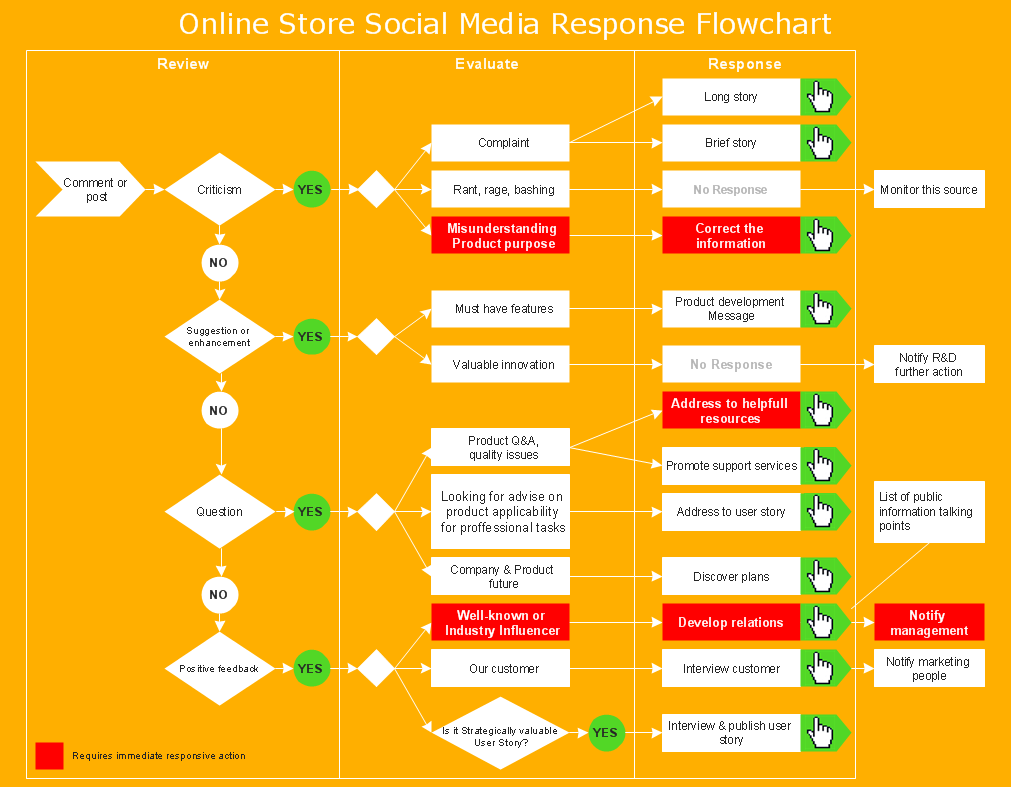
Interactive tool helps you find the appropriate response to social media mentions quickly.Organizing and Selecting Social Media Response Action *
Picture: Organizing and Selecting Social Media Response Action
Related Solution:
You are probably familiar with diagrams. But have you ever thought that they would be useless? Follow the recommendations and design useful Flowcharts of any type with Flowcharts solution ✔️ easily, ✔️ quickly, ✔️ efficientlyDiagrams Mean Nothing *
Picture: Diagrams Mean Nothing
Related Solution:
ConceptDraw DIAGRAM diagramming and vector drawing software extended with 25 Typical Orgcharts solution from the Management area of ConceptDraw Solution Park offers 25 ready Organization Chart templates, 10 samples and 2 libraries with predesigned vector objects.Organization Chart *
Picture: Organization Chart
Related Solution:
ConceptDraw DIAGRAM diagramming and vector drawing software offers the Marketing Diagrams Solution from the Marketing Area with extensive drawing tools, predesigned vector shapes, templates and samples for fast and easy drawing marketing charts and diagrams, marketing schemes and flow charts, various marketing illustrations, etc.Marketing Charts *
Picture: Marketing Charts
Related Solution:
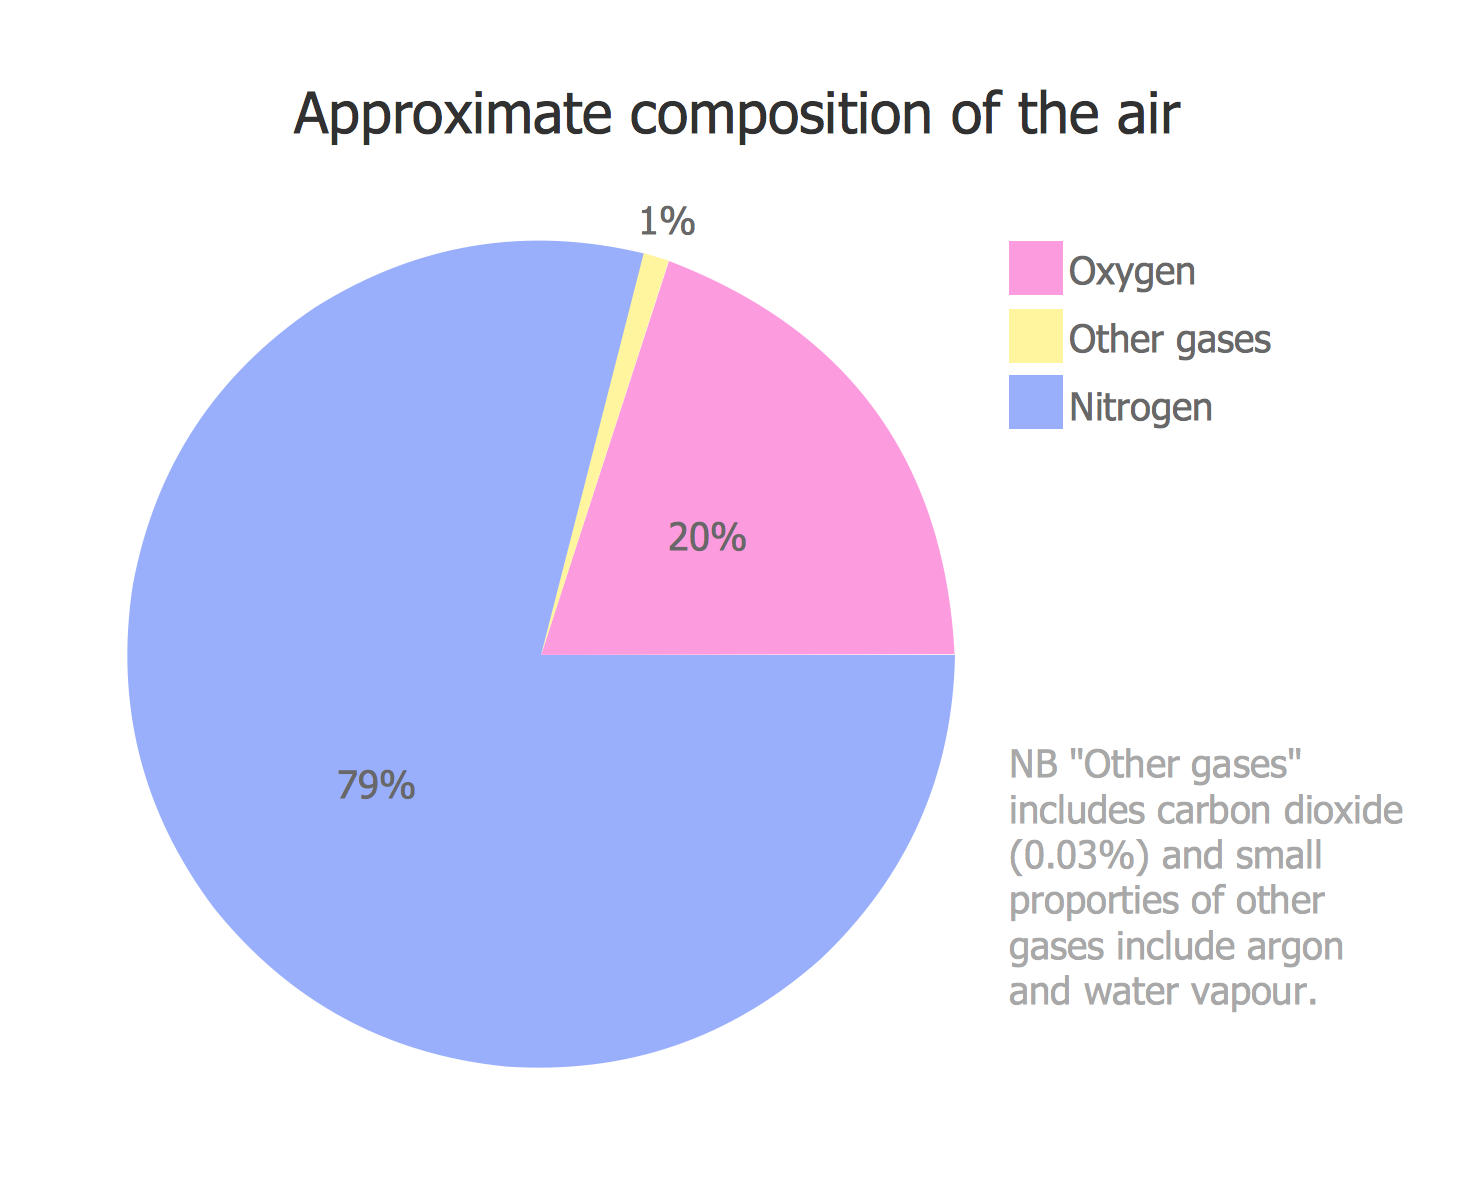
This sample was created in ConceptDraw DIAGRAM diagramming and vector drawing software using the Pie Charts Solution from Graphs and Charts area of ConceptDraw Solution Park. This sample shows the Pie Chart of the approximate air composition. You can see the percentage of oxygen, nitrogen and other gases in the air visualized on this Pie Chart.Percentage Pie Chart. Pie Chart Examples *
Picture: Percentage Pie Chart. Pie Chart Examples
Related Solution:
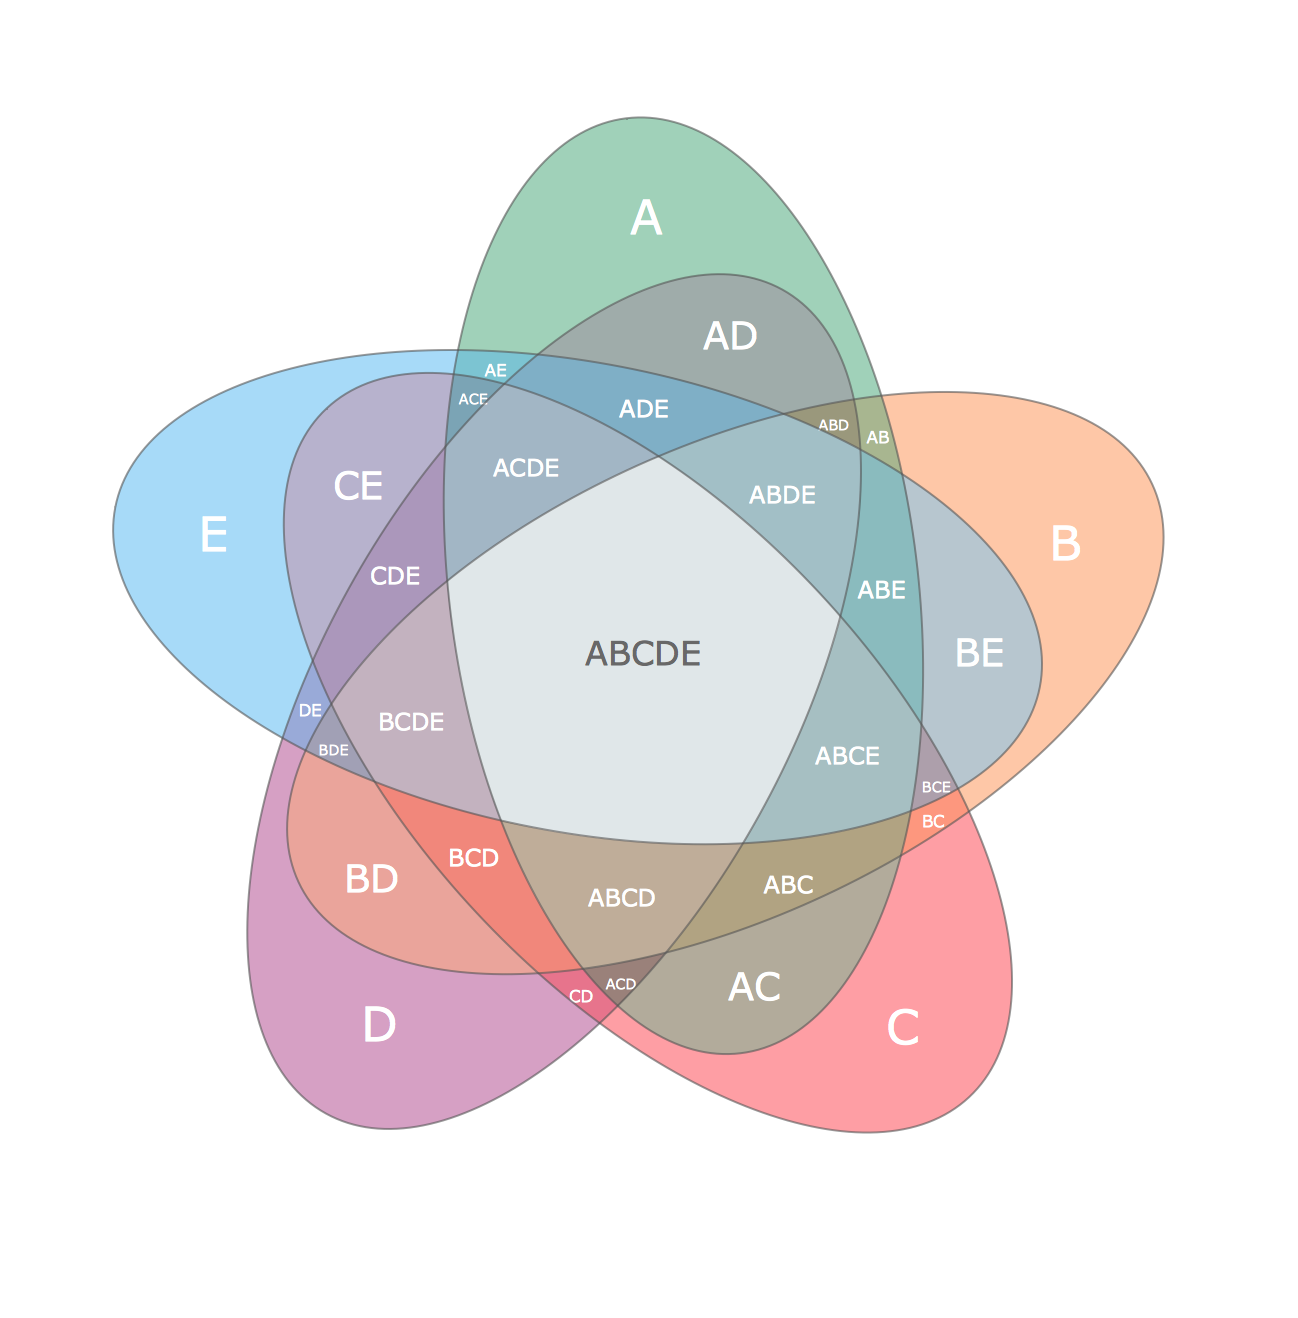
To visualize the relationships between subsets of the universal set you can use Venn diagrams. Сreate your own professional-looking Venn Diagrams quick and easy.Multi Layer Venn Diagram
Picture:
Multi Layer Venn Diagram
Venn Diagram Example
Related Solution:
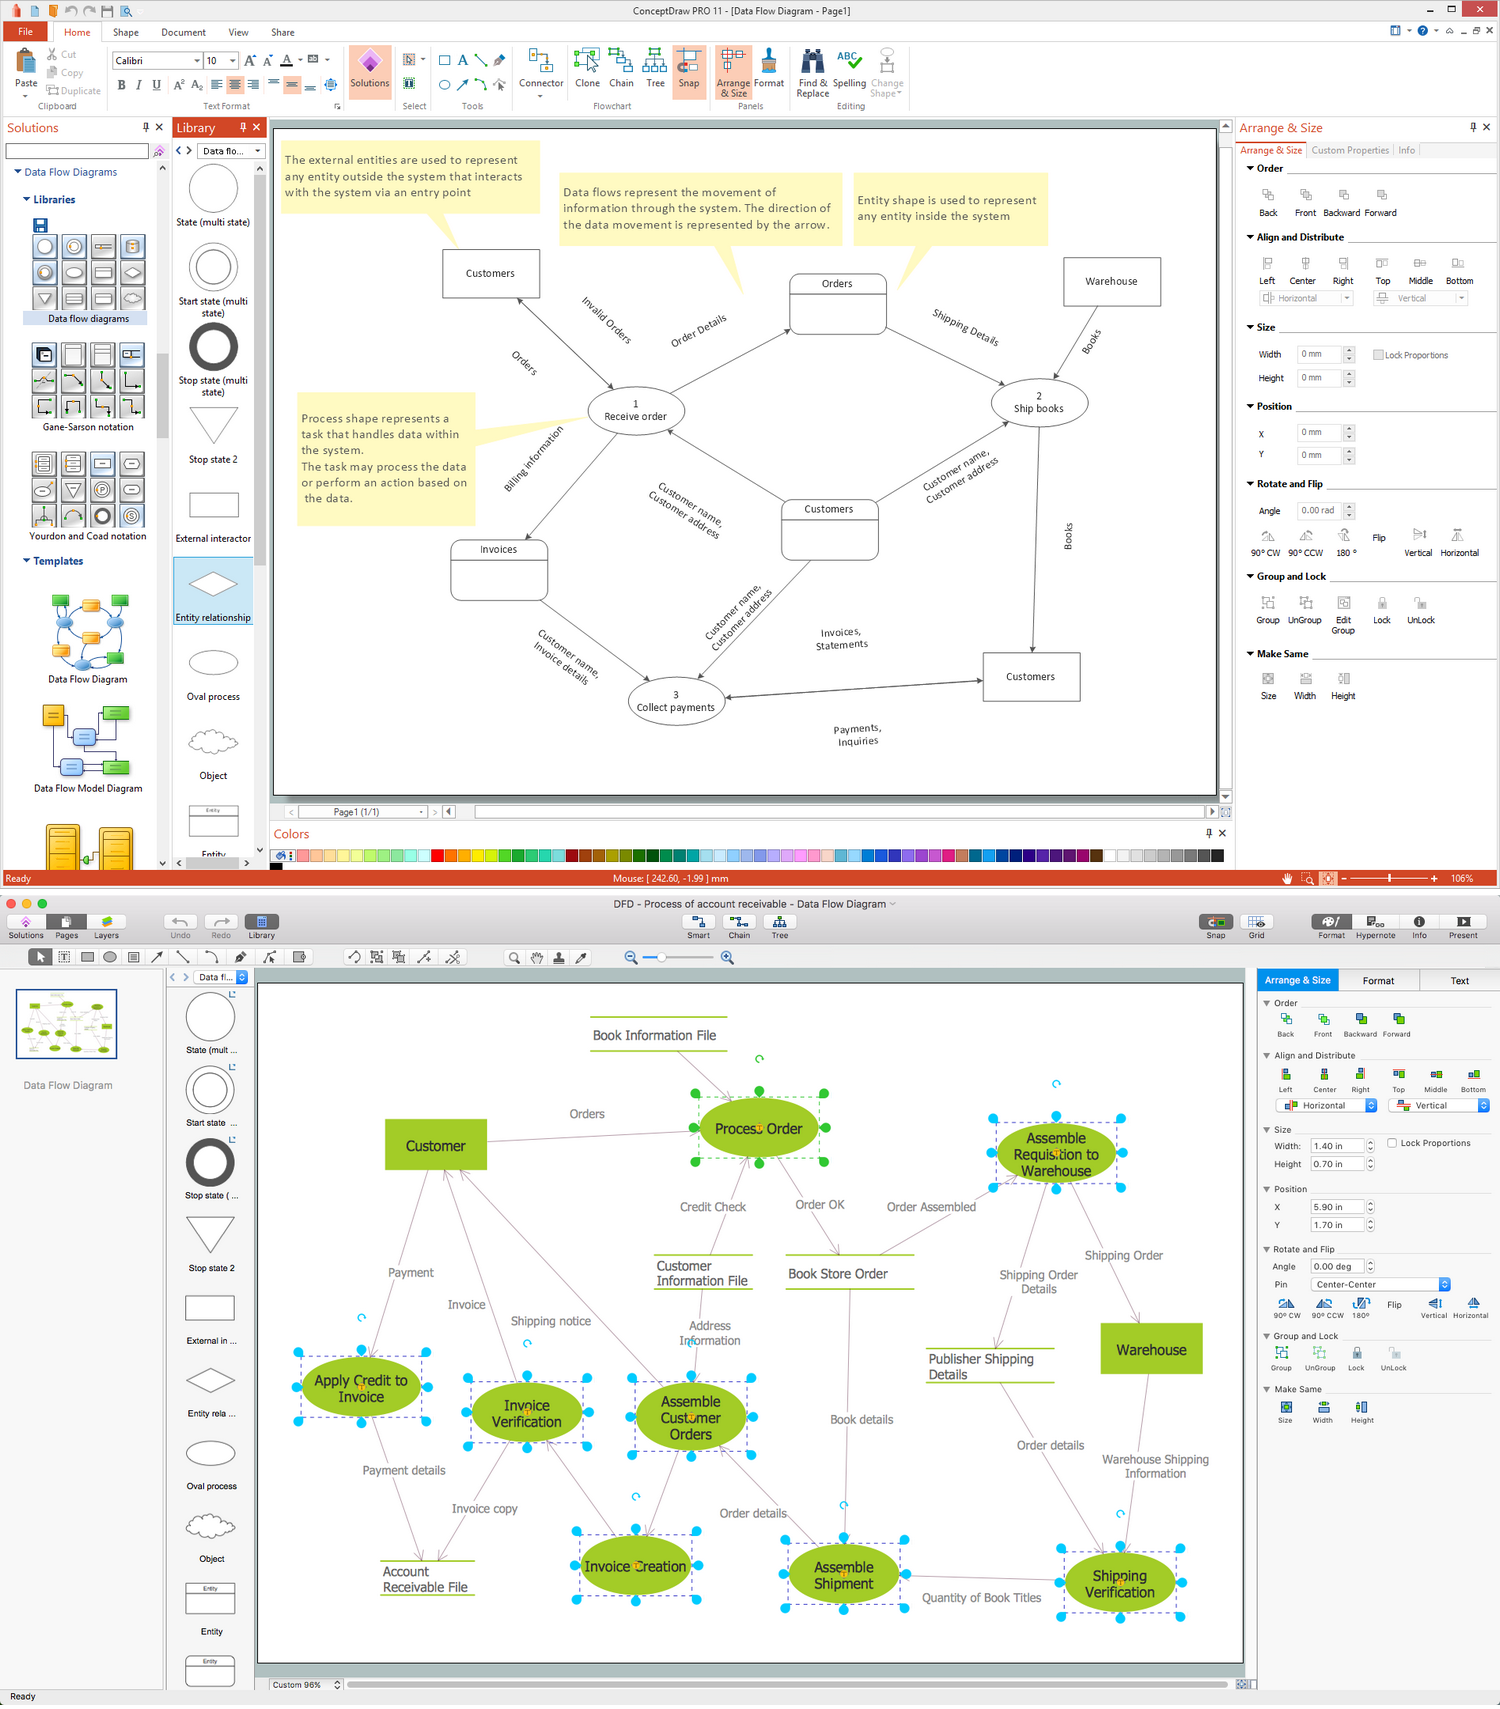
Any information system receives data flows from external sources. In order to visualize them there is a list of data flow diagram symbols that describes how the system components cooperate. If you want to create a data flow diagram, ConceptDraw DIAGRAM Solution Park has DFD Library that contains both Yourdon and Gane-Sarson notations. This figure shows the content of vector libraries, delivered with ConceptDraw solution for data flow diagram (DFD). There are three libraries composed from about 50 vector objects used to make data flow diagrams. They include a complete set of objects utilized by Yourdon-Coad and Gane-Sarson notations - two primary notations that are apply for data flow diagramming. Also, one can discover additional "Data flow diagram (DFD)" library that provides a data flow diagram elements for designing level 1 and context-level data flow diagrams.Data Flow Diagram Symbols. DFD Library *
Picture: Data Flow Diagram Symbols. DFD Library
Related Solution:
In order to be successful, you have to promote your business on the market. One of the ways for planning this promotion is to create a social media DFD Flowchart which will contain all the details of your business strategy. Social media is a very influential tool, and it's a mistake to ignore it. The following flowchart represents a best way to estimate social media posts, and gives a strategy of responses. This flowchart is designed in the format of cross-functional flowchart. With this format, we can divide the process into three distinct phases. This approach helps to generate well-considered and balanced response on social networks activities. Using ConceptDraw solution for Social Media Response, your reaction to social media posts will positively mirror the values and mission of your business.How to Create a Social Media DFD Flowchart *
Picture: How to Create a Social Media DFD Flowchart
Related Solution:
ConceptDraw
DIAGRAM 18