UML Package Diagram. Design Elements
UML Package Diagram is a type of Structure Diagrams that represents the packages of the model and dependencies between them.
Package Diagrams are used to illustrate the layered architecture of a software system. The packages depict the different layers of a software system. To indicate the types of dependencies between the packages are used the stereotypes.
There are two special types of dependencies between the packages in UML: package import and package merge.
To design UML Package Diagrams use the following shape types:
- Package – it is the mechanism indispensable for organizing the elements and diagrams into the groups.
- Class - it is a description of logical structure of the system, its objects and their behavior in the system.
- Interface - it is a specification of the behavior.
- Object - it is an instance of class, and others.
UML Package Diagrams are very useful for working with large systems, because they allow to clearly view all the dependencies between the elements of these systems.
The Rapid UML Solution for ConceptDraw DIAGRAM contains 13 vector stencils libraries with 393 interactive shapes that you can use to design your UML diagrams.
To design a Package Diagram use the UML Package Diagram library.
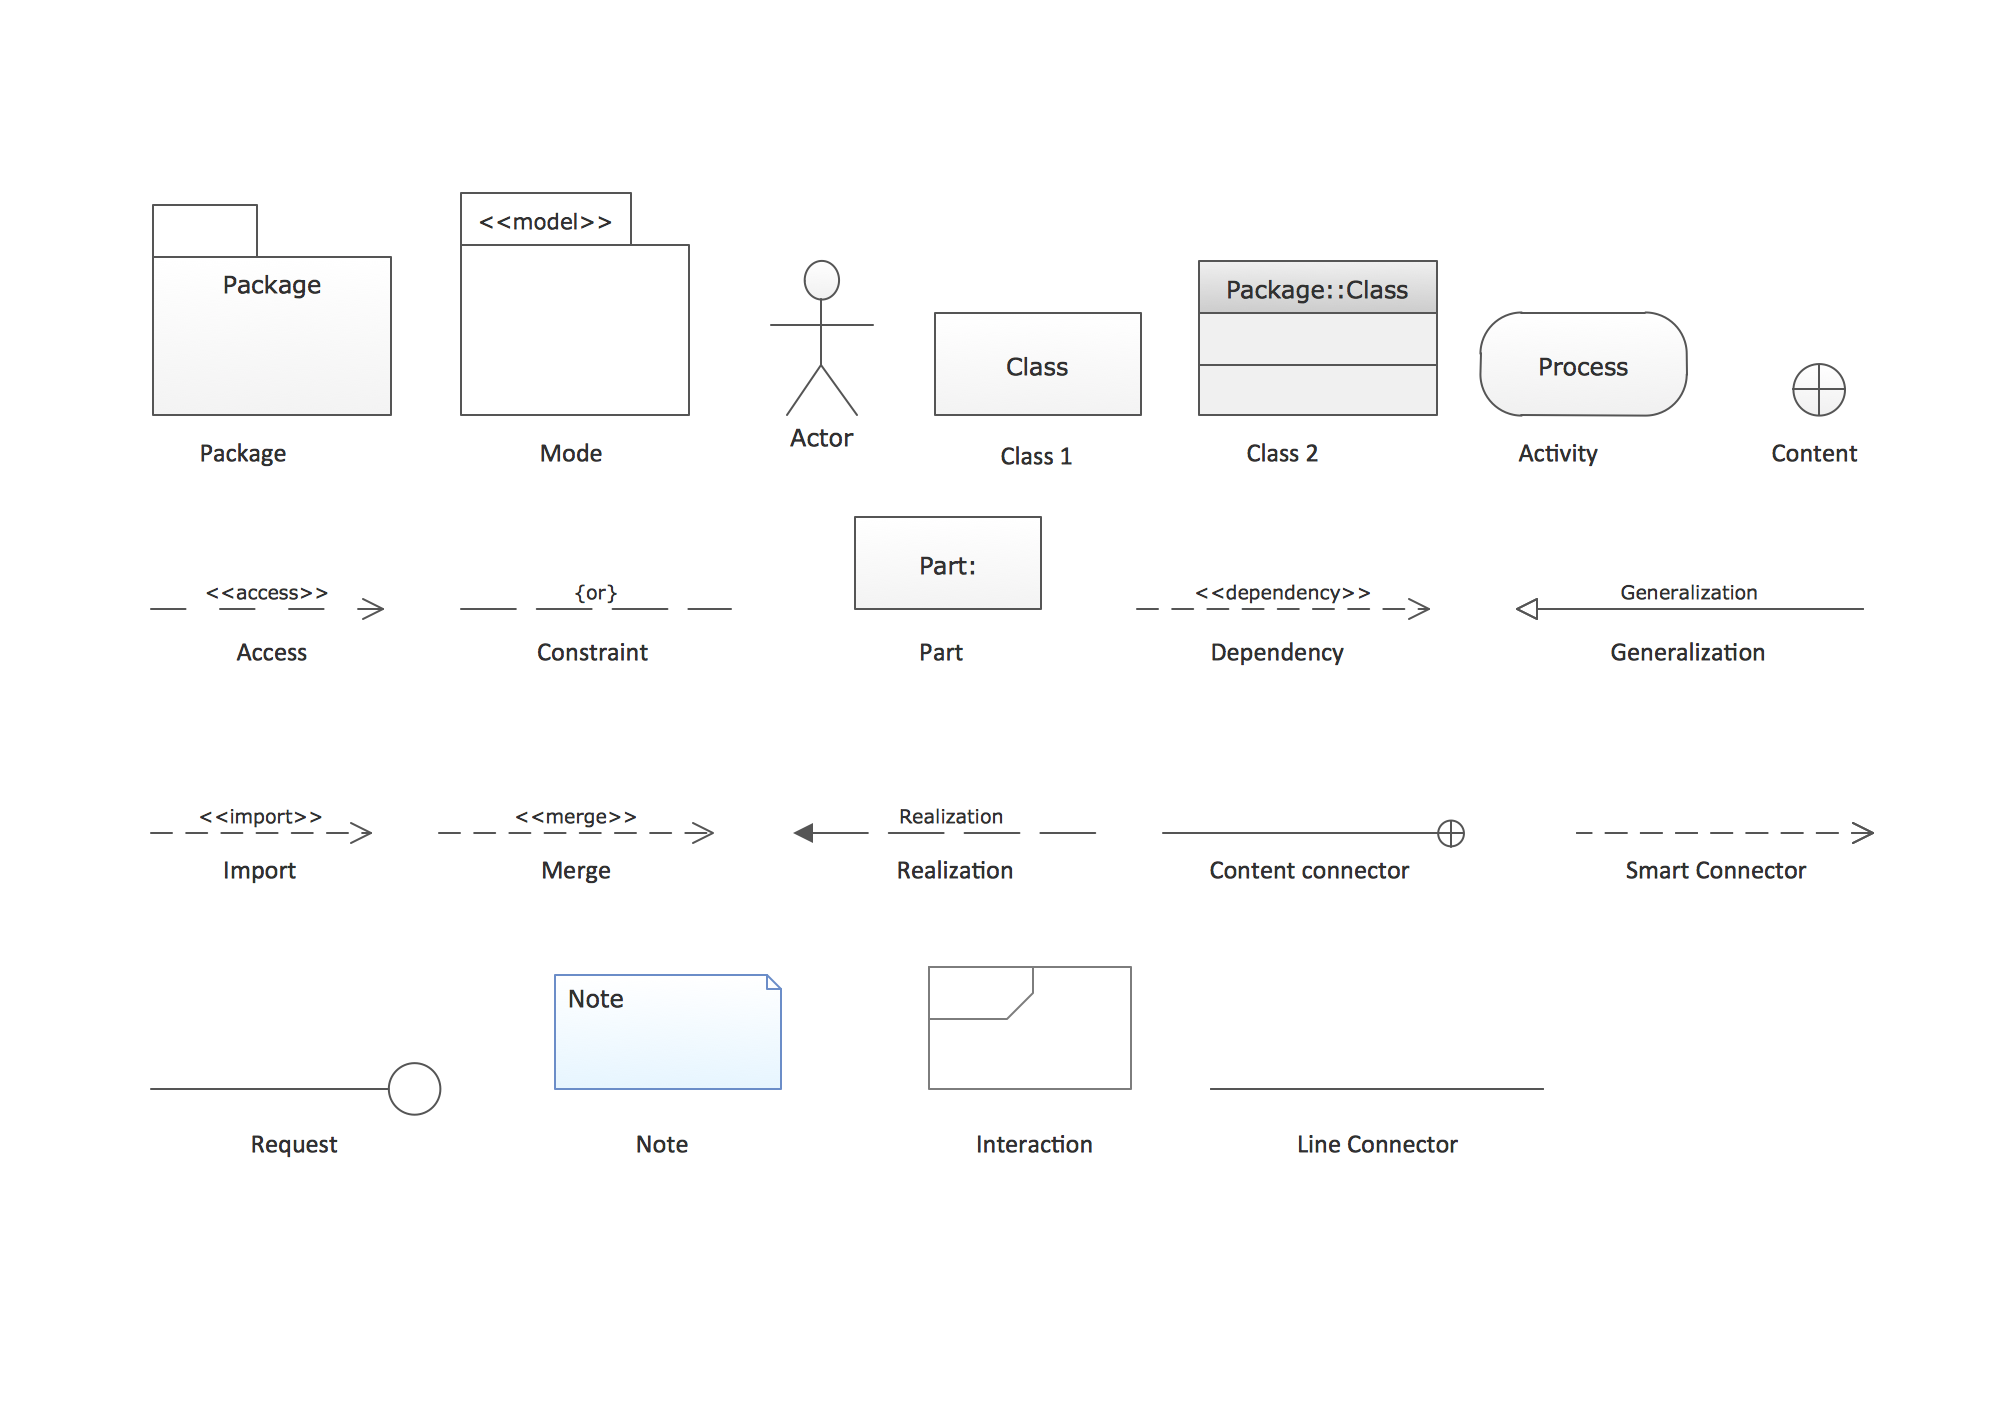
UML Package Diagram library contains 23 shapes:
- Package
- Part
- Class 2
- Content
- Actor
- Import
- Dependency
- Note
- Interaction
- Access
- Constraint
- Generalization
- Merge
- Realization
- Class 1
- Model
- Activity
- Line connector
- Smart connector
- Request
- Content connector

Pic.1. UML Package Diagram Library
Pic.2. UML Package Diagram Library Elements
ConceptDraw Rapid UML solution provides UML Package Diagram library of vector stencils for drawing the package diagrams using package blocks and assembly connectors.
All libraries for creating UML diagrams are available inside the ConceptDraw DIAGRAM Templates and samples are located in the Rapid UML section of ConceptDraw STORE.

Pic.3. UML Diagrams solution
Use design element from the UML Component Diagram library to draw your own UML package diagrams of complex systems and software applications.


TEN RELATED HOW TO's:
ConceptDraw DIAGRAM is a powerful tool for business and technical diagramming.
Software Development area of ConceptDraw Solution Park provides 5 solutions:
Data Flow Diagrams, Entity-Relationship Diagram (ERD), Graphic User Interface, IDEFO Diagrams, Rapid UML.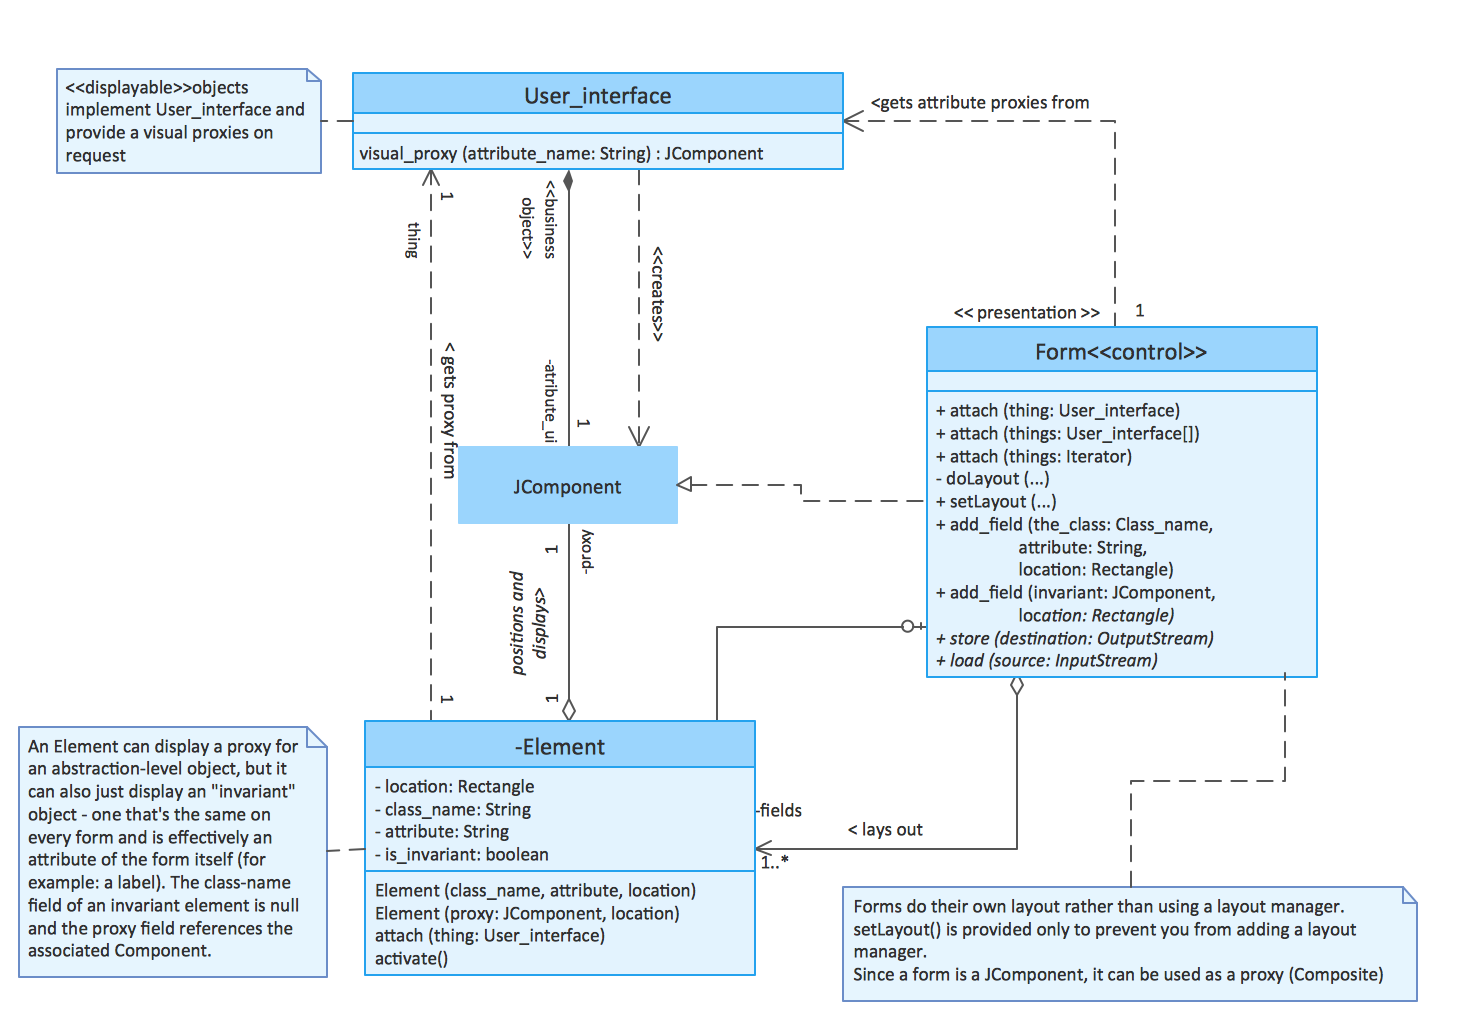
Picture: Software Diagram Examples and Templates
Related Solution:
UML Class Diagrams is a type of static structure diagram that is used both for general conceptual modeling of the systematics of the application, and for detailed modeling translating the models into programming code. It describes the structure of a system by showing the: classes of a system, attributes, operations, and the relationships between them.
The Rapid UML Solution for ConceptDraw DIAGRAM includes the UML Class Diagram library that helps you to design the UML Class Diagram quick and easy. You can simply and quickly drop the ready-to-use objects from the library into your document to create the UML Class Diagram.
Picture: UML Class Diagram Constructor
Related Solution:
In software engineering, a UML Class Diagrams is a type of static structure diagram that is used both for general conceptual modeling of the systematics of the application, and for detailed modeling translating the models into programming code.
Use ConceptDraw DIAGRAM with UML class diagram templates, samples and stencil library from Rapid UML solution to show the classes of system, their attributes, operations or methods, and the relationships among the classes.
Picture: UML Class Diagrams. ConceptDraw DIAGRAM - Diagramming Software for Design UML Diagrams
Related Solution:
ConceptDraw DIAGRAM is a powerful diagramming and vector drawing software. Extended with Website Wireframe solution from the Software Development area, ConceptDraw DIAGRAM became the ideal software for prototype and design professional looking websites wireframes. Website Wireframe solution offers at your disposal wide variety of wireframe examples and samples which confirm this.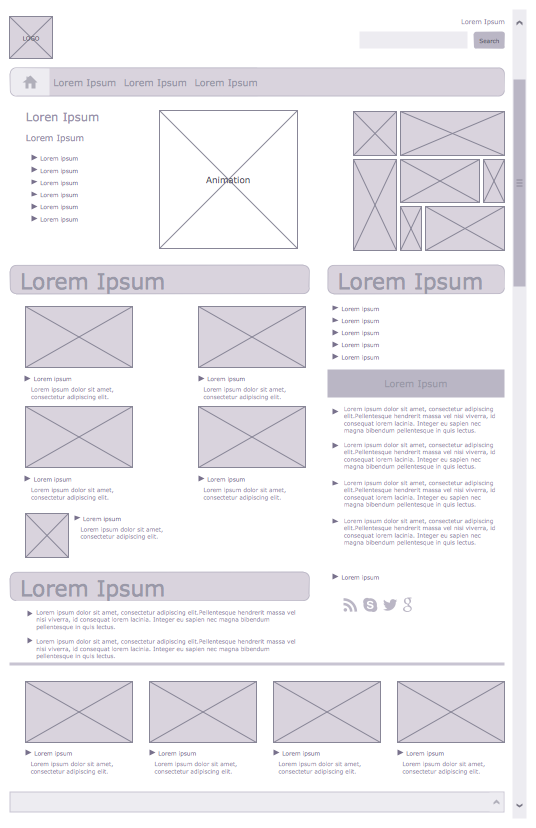
Picture: Wireframe Examples
Related Solution:
How to design a Bubble Chart? It’s very easy! All that you need is a powerful software. Never before creation of a Bubble Chart wasn’t so easy as now with tools of Business Diagrams Solution from the Management Area for ConceptDraw Solution Park.
Picture: Bubble Chart
Related Solution:
UML Component Diagram illustrates show components are wired together to larger components and software systems that shows the structure of arbitrarily complex systems.
Rapid UML Solution for ConceptDraw DIAGRAM contains 13 vector stencils libraries with 393 interactive shapes that you can use to design your UML diagrams.
To design a Component Diagram use the UML Component Diagram library.
UML Component Diagram library contains 36 shapes
Picture: UML Component Diagram. Design Elements
Related Solution:
While creating flowcharts and process flow diagrams, you should use special objects to define different statements, so anyone aware of flowcharts can get your scheme right. There is a short and an extended list of basic flowchart symbols and their meaning. Basic flowchart symbols include terminator objects, rectangles for describing steps of a process, diamonds representing appearing conditions and questions and parallelograms to show incoming data.
This diagram gives a general review of the standard symbols that are used when creating flowcharts and process flow diagrams. The practice of using a set of standard flowchart symbols was admitted in order to make flowcharts and other process flow diagrams created by any person properly understandable by other people. The flowchart symbols depict different kinds of actions and phases in a process. The sequence of the actions, and the relationships between them are shown by special lines and arrows. There are a large number of flowchart symbols. Which of them can be used in the particular diagram depends on its type. For instance, some symbols used in data flow diagrams usually are not used in the process flowcharts. Business process system use exactly these flowchart symbols.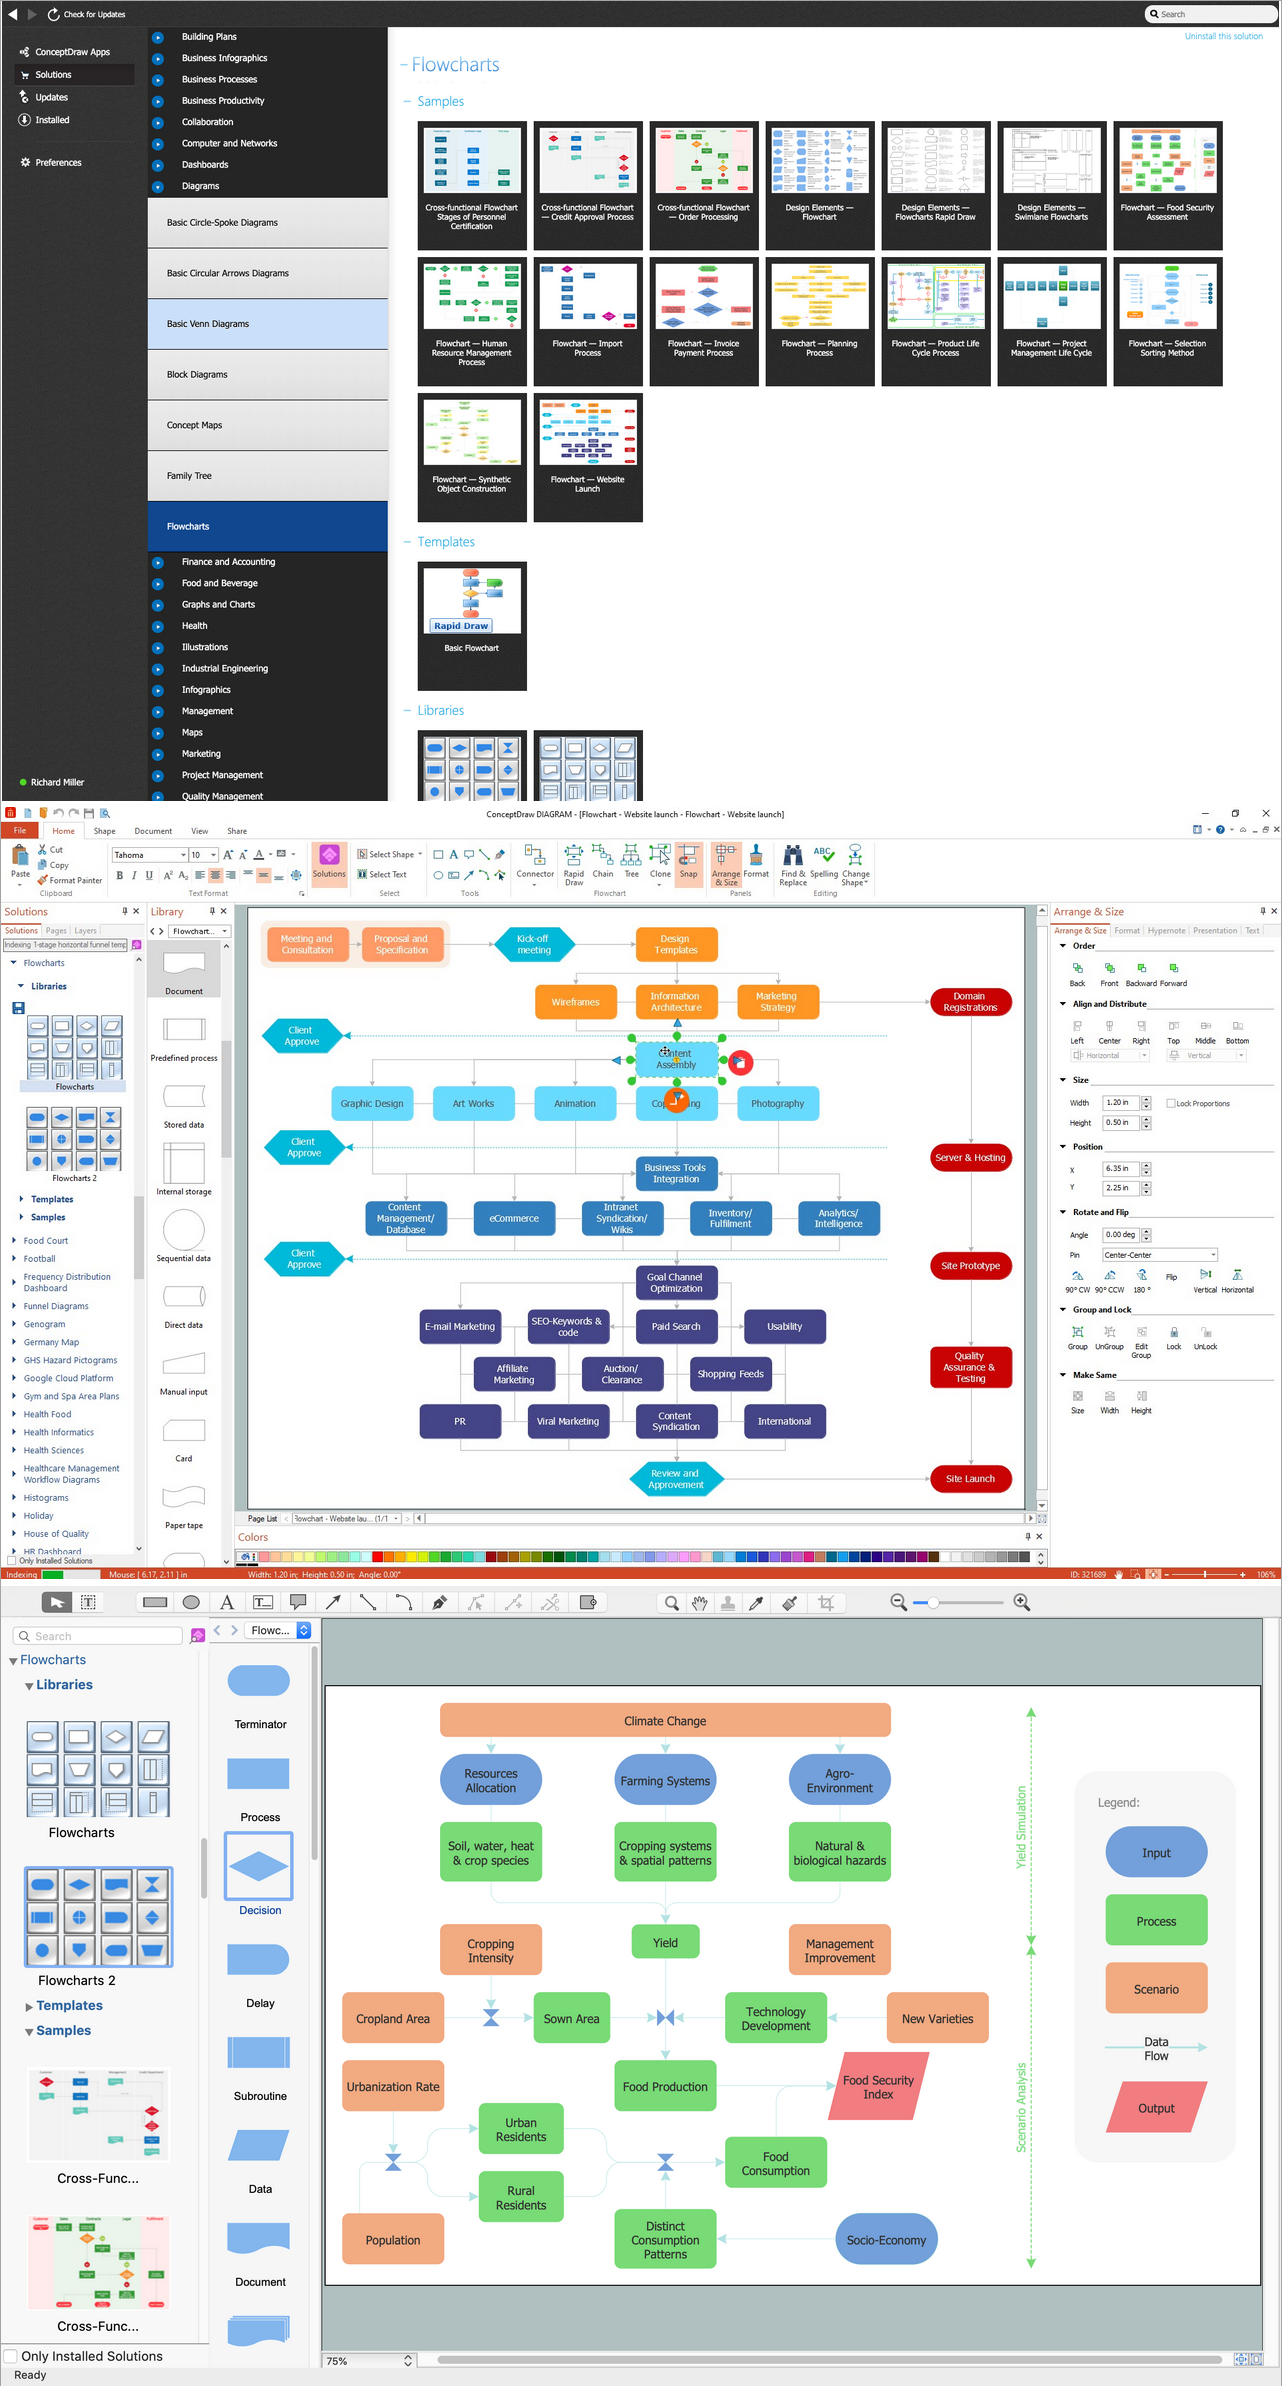
Picture: Basic of Flowchart: Meaning and Symbols
Related Solution:
Process Flow Chart is a visual diagram which shows the processes and relationships between the major components in a system, and uses for this the special process flow chart symbols: special shapes to represent different types of actions and process steps, lines and arrows to represent relationships and sequence of steps. It often named process flow diagram, it use colored flowchart symbols.
It is incredibly convenient to use the ConceptDraw DIAGRAM software extended with Flowcharts Solution from the Diagrams Area of ConceptDraw Solution Park for designing professional looking Process Flow Charts.
Picture: Process Flow Chart Symbols
Related Solution:


