State Machine Diagram
How To draw UML State Machine Diagrams
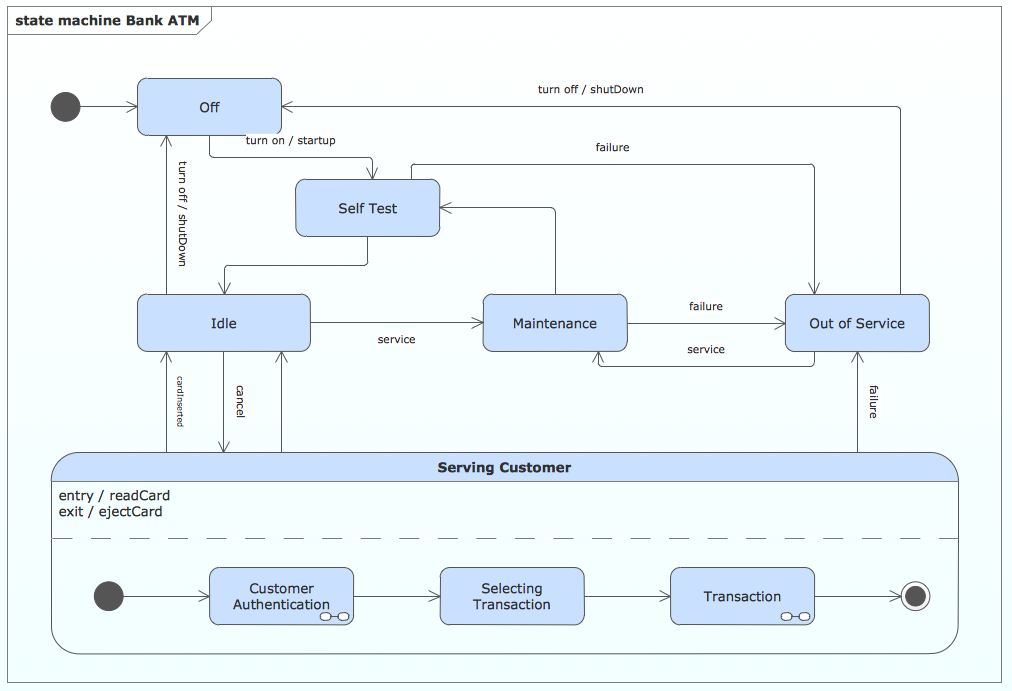
UML state machine's goal is to overcome the main limitations of traditional finite-state machines while retaining their main benefits. UML state machine introduce the new concepts of hierarchically nested states and orthogonal regions, while extending the notion of actions.
ConceptDraw has 393 vector stencils in the 13 libraries that helps you to start using software for designing own UML Diagrams. You can use the appropriate stencils of UML notation from UML State Machine Diagram library with 35 objects.
ConceptDraw Rapid UML solution provides UML State Machine Diagram samples, templates and library of vector stencils.
Use ConceptDraw DIAGRAM diagramming and vector drawing software enhanced with Rapid UML solution from ConceptDraw Solution Park to create your own UML state machine diagrams for both behavioral state machines and protocol state machines.

Draw behavioral state machine diagrams to model the behavior of individual entities (e.g., class instances).
Draw protocol state machine diagrams to visualize usage protocols and to specify the legal usage scenarios of classifiers, interfaces and ports.

NINE RELATED HOW TO's:
The onion diagram is a type of diagram which shows the dependencies among parts of an organization or process. The items are displayed at the concentric circles, where the items at the bigger rings depend on the items at the smaller rings.
ConceptDraw DIAGRAM diagramming and vector drawing software extended with Stakeholder Onion Diagrams Solution from the Management Area of ConceptDraw Solution Park is a professional Onion Diagram Maker.
Picture: Onion Diagram Maker
Related Solution:
UML Diagrams Social Networking Sites Project. This sample was created in ConceptDraw DIAGRAM diagramming and vector drawing software using the UML Use Case Diagram library of the Rapid UML Solution from the Software Development area of ConceptDraw Solution Park.
This sample shows the Facebook Socio-health system and is used at the projection and creating of the social networking sites.
Picture: UML Use Case Diagram Example. Social Networking Sites Project
Related Solution:
UML Use Case Diagram Taxi Service - This sample was created in ConceptDraw DIAGRAM diagramming and vector drawing software using the UML Use Case Diagram library of the Rapid UML Solution from the Software Development area of ConceptDraw Solution Park.
This sample shows the work of the taxi service and is used by taxi stations, by airports, in the tourism field and delivery service.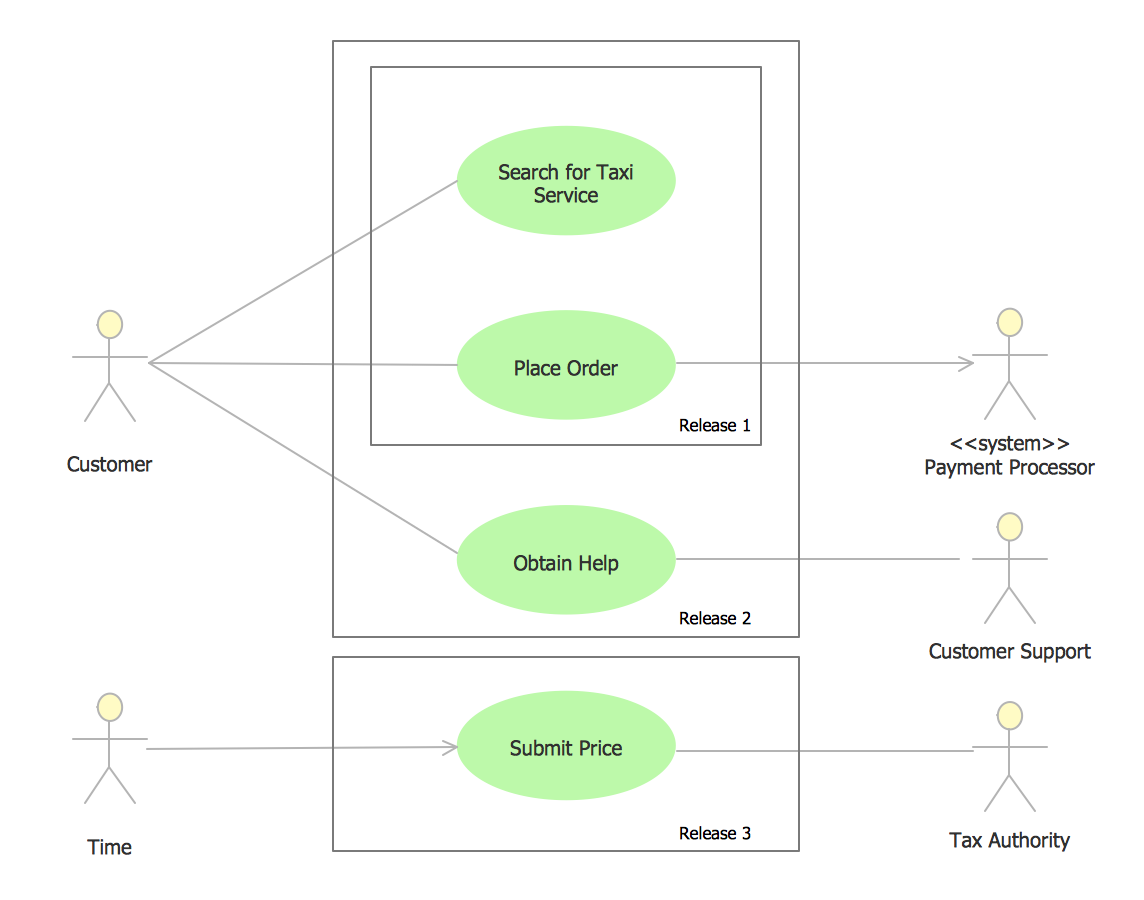
Picture: UML Use Case Diagram Example - Taxi Service
Related Solution:
While creating flowcharts and process flow diagrams, you should use special objects to define different statements, so anyone aware of flowcharts can get your scheme right. There is a short and an extended list of basic flowchart symbols and their meaning. Basic flowchart symbols include terminator objects, rectangles for describing steps of a process, diamonds representing appearing conditions and questions and parallelograms to show incoming data.
This diagram gives a general review of the standard symbols that are used when creating flowcharts and process flow diagrams. The practice of using a set of standard flowchart symbols was admitted in order to make flowcharts and other process flow diagrams created by any person properly understandable by other people. The flowchart symbols depict different kinds of actions and phases in a process. The sequence of the actions, and the relationships between them are shown by special lines and arrows. There are a large number of flowchart symbols. Which of them can be used in the particular diagram depends on its type. For instance, some symbols used in data flow diagrams usually are not used in the process flowcharts. Business process system use exactly these flowchart symbols.
Picture: Flowchart Symbols: Meaning and Examples
Related Solution:
A workflow diagram is less general notation than a process flow diagram. Workflow as a term can apply to organizational process which involves people, resources, documents, sort of data, for instance; whereas a process is general collection of steps occuring in any sort of activity. That is why process flow diagram can be used as workflow diagram to describe business process, data flow or department interactions.
The fastest way to create a workflow diagram is using pre-designed workflow template. ConceptDraw DIAGRAM with the Workflow Diagrams solution delivers rich set of workflow diagram templates you may start from.
Picture: How To Create a Workflow Diagram
Related Solution:
UML Use Case Diagrams are used to illustrate the structure of arbitrarily complex systems and illustrates the service consumer - service provider relationship between components.
Picture: UML Use Case Diagram. Design Elements
The Social Media Response solution provides the means to respond to social media mentions quickly and professionally. This tool keeps the entire team on the same page allowing you to realize your social media strategy, improve the quality of your answers, and minimize the time it takes to respond.
Picture: Manage Social Media Response Plan DFD
Related Solution:
This sample was created in ConceptDraw DIAGRAM diagramming and vector drawing software using the Flowcharts solution from the Diagrams area of ConceptDraw Solution Park.
This sample shows the Flowchart of the Subprime Mortgage Crisis. This Flowchart describes the decline in housing prices when the housing bubble burst and what it caused on the housing and financial markets. You can also see the Government and Industry responses in this crisis situation.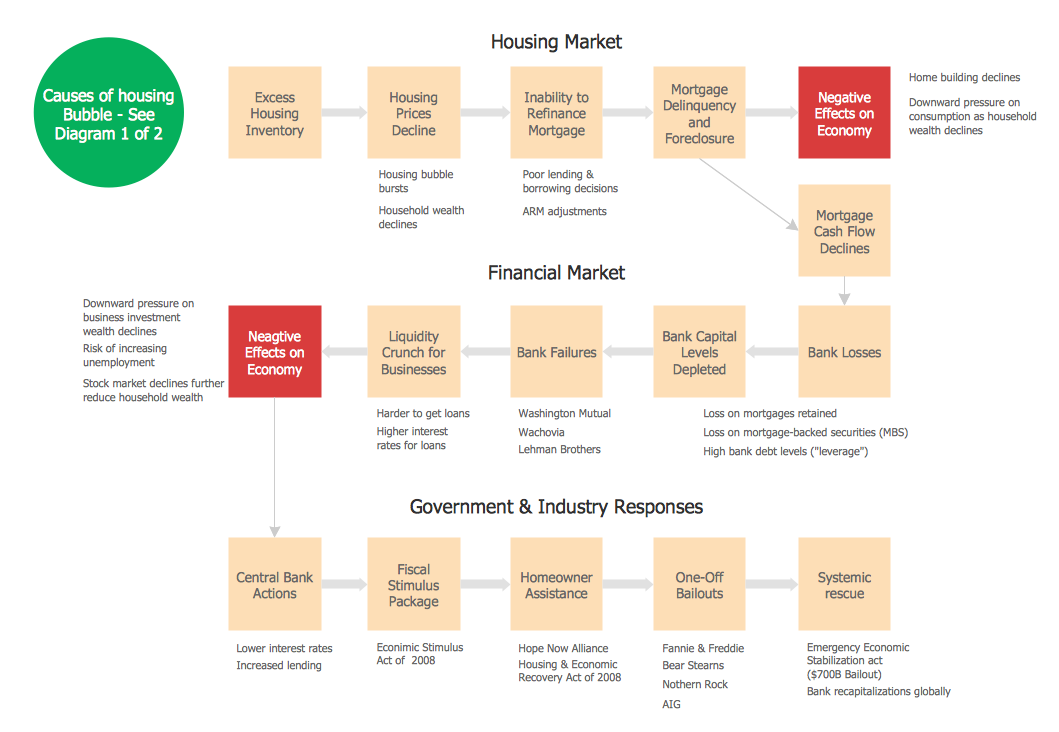
Picture: Flowchart on Bank. Flowchart Examples
Related Solution:
Both Crow’s Foot and Chen’s notations are used to build database models. Each of them has its’ own features, and if you use a proper entity relationship diagram software, you’ll be able to create diagrams of any notation. Database model with clearly defined entities and relationships between them facilitates further work greatly.
This ERD represents the model of Employee Certification Entity. The entity-relationship diagram is a visual instrument of database software development. It is used to structure data and to define the relationships between structured data groups. This ERD was designed with a help of ConceptDraw Entity-Relationship Diagram (ERD) solution. The solution supports the both basic ERD notations used to describe the structure of database: Chen's and Crow’s Foot notations.
Picture: Entity Relationship Software
Related Solution:

