User Interface Design Examples
ConceptDraw DIAGRAM is a powerful diagramming and vector drawing software. Extended with Windows 8 User Interface solution from the Software Development area, ConceptDraw DIAGRAM became the ideal software for prototype and design professional looking user interfaces for Windows 8 and Windows 8.1.
Windows 8 User Interface solution offers you wide variety of user interface design examples, templates and samples.

Example 1. User Interface Design Examples - Windows 8 Charm Bar
Windows 8 User Interface Design examples, templates and samples were developed in ConceptDraw DIAGRAM specially for Windows 8 User Interface Solution and are available for ConceptDraw DIAGRAM users from ConceptDraw STORE.

Example 2. User Interface Design Examples - Windows 8 Search Apps
Any desired sample or template that you will find in ConceptDraw STORE, can be opened, filled and changed according to the user's needs. Try and make sure that it's very simple and convenient.

Example 3. User Interface Design Examples - Windows 8 App
The user interface design examples you see on this page were created in ConceptDraw DIAGRAM using the vector objects from the Windows 8 User Interface Solution for ConceptDraw DIAGRAM These samples demonstrate the solution's capabilities and the professional results you can achieve. An experienced user spent 10 minutes creating every of these samples.
All source documents are vector graphic documents. They are available for reviewing, modifying, or converting to a variety of formats (PDF file, MS PowerPoint, MS Visio, and many other graphic formats) from the ConceptDraw STORE. The Windows 8 User Interface Solution is available for all ConceptDraw DIAGRAM or later users.
TEN RELATED HOW TO's:
This sample was created in ConceptDraw DIAGRAM diagramming and vector drawing software using the UML Class Diagram library of the Rapid UML Solution from the Software Development area of ConceptDraw Solution Park.
This sample describes the use of the classes, the generalization associations between them, the multiplicity of associations and constraints. Provided UML diagram is one of the examples set that are part of Rapid UML solution.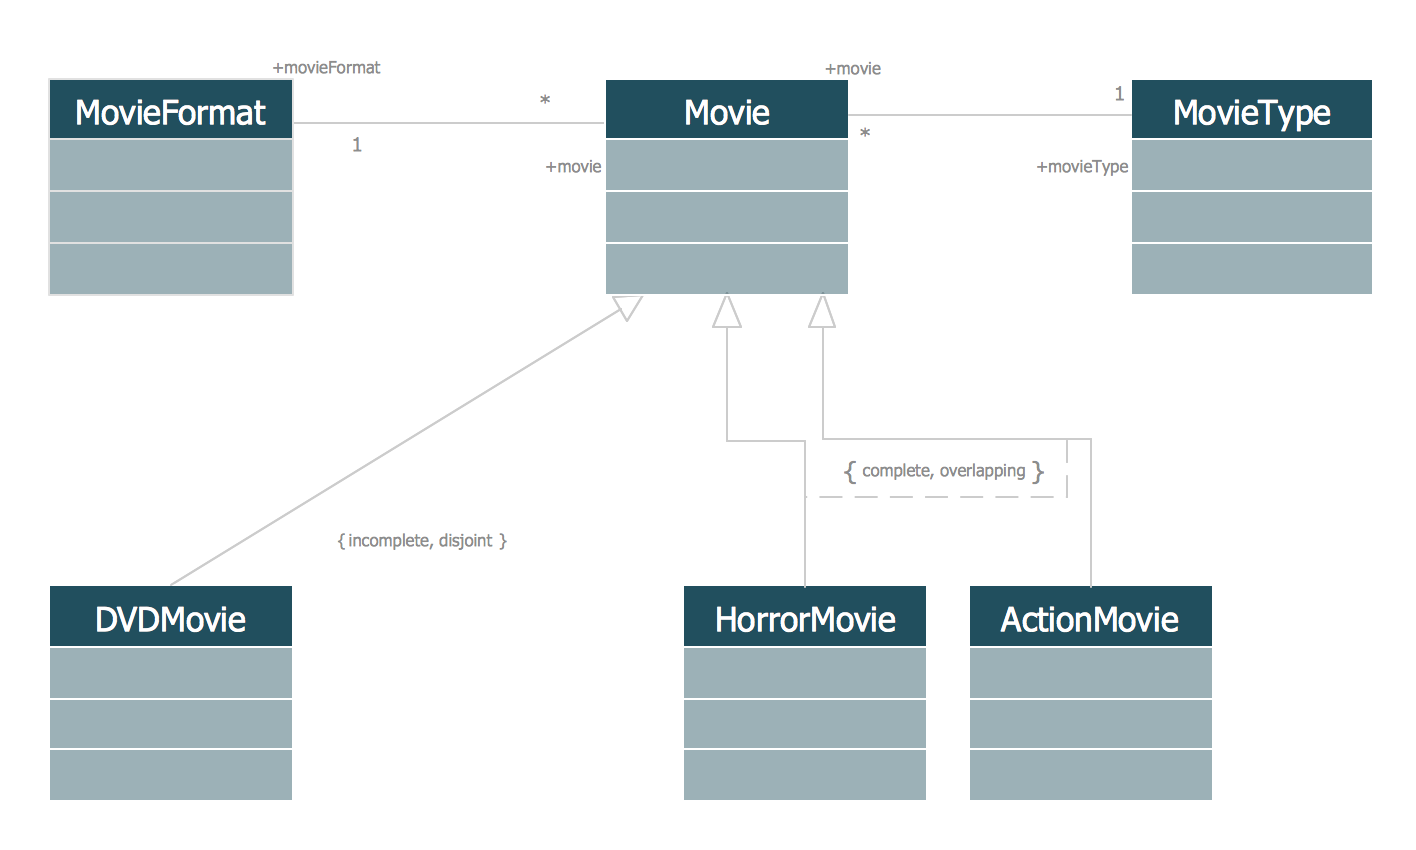
Picture: UML Class Diagram Generalization ExampleUML Diagrams
Related Solution:
When you need to visually represent the structure of relational database, Entity relationship diagram (ERD) is a type of diagram for that case.
Most entity-relationship diagrams can be built with objects from Flowchart solution or ERD Solution which contains inbuilt templates. Follow these steps to create your own custom ERD diagram.
Don't be frightened if it looks complex, ConceptDraw DIAGRAM makes it easy to create an ERD, and hundreds of other diagrams, in minutes.
Picture: Developing Entity Relationship Diagrams
Related Solution:
Website wireframes are convenient and widely used by developers, visual designers, business analysts, and many other people related with projection, development and promotion websites. Usually website wireframes look lacking of brilliance, but they effectively reflect website functionality, content and visually represent its skeletal framework.
ConceptDraw DIAGRAM software offers a unique Website Wireframe solution from the Software Development area with all needed tools for fast and easy drawing professional looking website wireframe with attractive interface design.
Picture: Interface Design
Related Solution:
ConceptDraw DIAGRAM is a powerful diagramming and vector drawing software. Extended with Website Wireframe solution from the Software Development area, ConceptDraw DIAGRAM became the ideal software for prototype and design professional looking websites wireframes. Website Wireframe solution offers at your disposal wide variety of wireframe examples and samples which confirm this.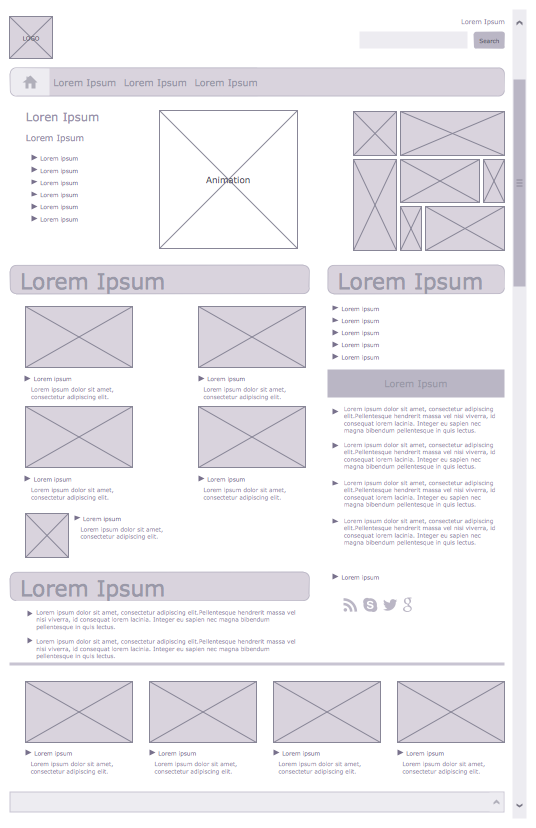
Picture: Wireframe Examples
Related Solution:
Why do you need network visualizations? 🔸 Unlock the full potential of network visualization with our in-depth guide on using the ConceptDraw Network Visualization Tool. ✔️ Explore features, tips, and best practices to create stunning visual representations of your network architecture
Picture:
Network Visualization Guide.
How to Use ConceptDraw Network Visualization Tool
Related Solutions:
Talking about interior design, we usually mean apartments, houses or establishments. But there’s much more to this, for instance, interiors in warehouses, storage and distribution departments and machine shops also require designing. You can find all the necessary design elements such as cranes and forklifts in Plant Layout Plans solution ConceptDraw Solution Park.
This picture represents content of the Storage and Distribution library, providing the collection of vector images designed to plan layouts of industrial storage facilities (warehouses). Warehouse is a premises and equipment intended for the reception, distribution and storage of products manufactured at the plant, as well as to preparation the product for shipment to the consumer. This vector images library is supplied with ConceptDraw Plant Layout Plans solution. it will help to industrial architects and planners to design plans for industrial storage and shipping facilities.
Picture: Interior Design. Storage and Distribution — Design Elements
Related Solution:
There are numerous articles about the advantages of flowcharting, creating business graphics and developing different charts. Nevertheless, these articles are almost useless without the main component - the examples of flowcharts, org charts and without a fine example, it is difficult to get all the conveniences of creating diagrams. You can find tons of templates and vivid examples on Solution Park.
This illustration shows a variety of business diagrams that can be created using ConceptDraw DIAGRAM. It comprises a different fields of business activities: management, marketing, networking, software and database development along with design of infographics and business illustrations. ConceptDraw DIAGRAM provides a huge set of sample drawings including business process modeling diagrams,, network diagrams, UML diagrams, orgcharts, DFD, flowcharts, ERD, geographical maps and more.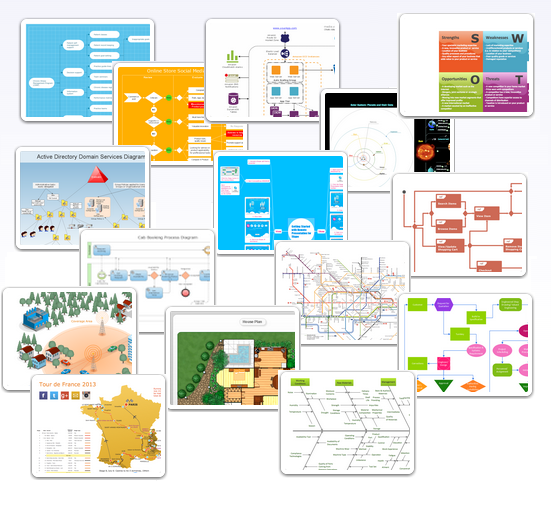
Picture: Examples of Flowcharts, Org Charts and More
Related Solution:
ConceptDraw Wireless Network solution includes several wireless network diagram examples that users can modify and make your own diagram.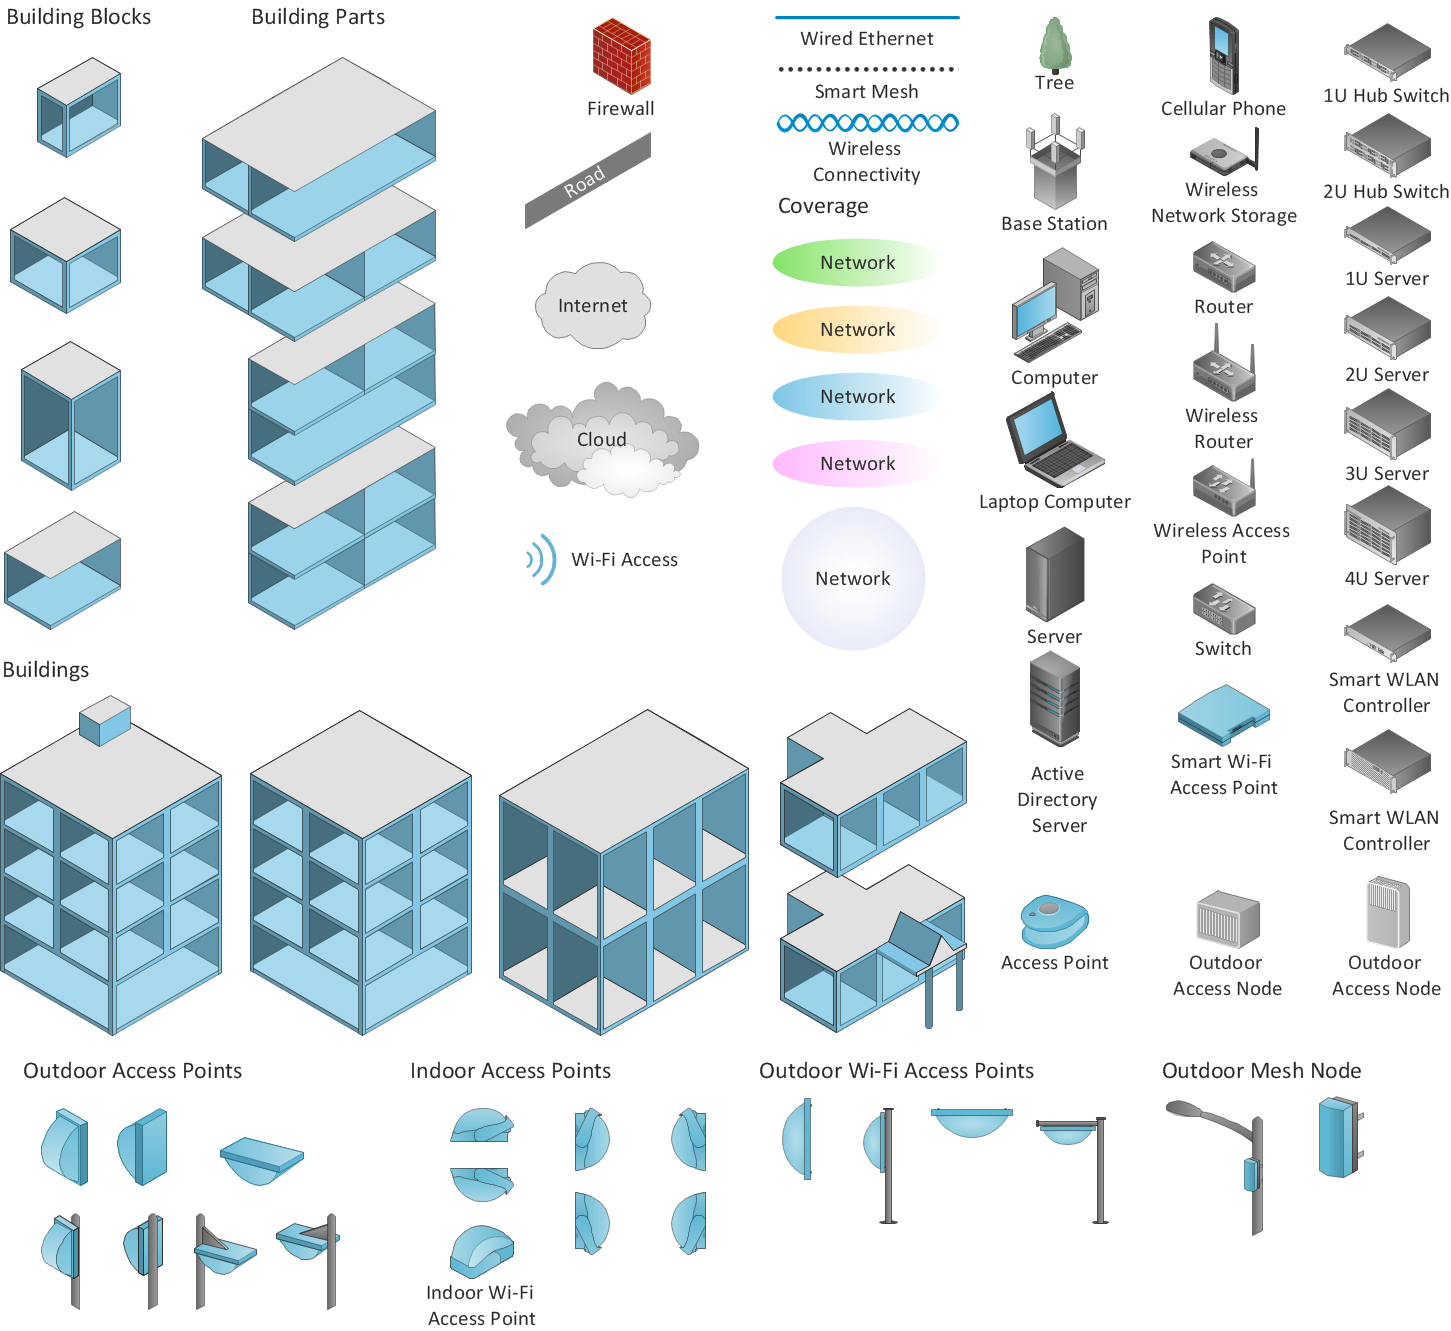
Picture: Wireless Network Diagram Examples
Related Solution:

