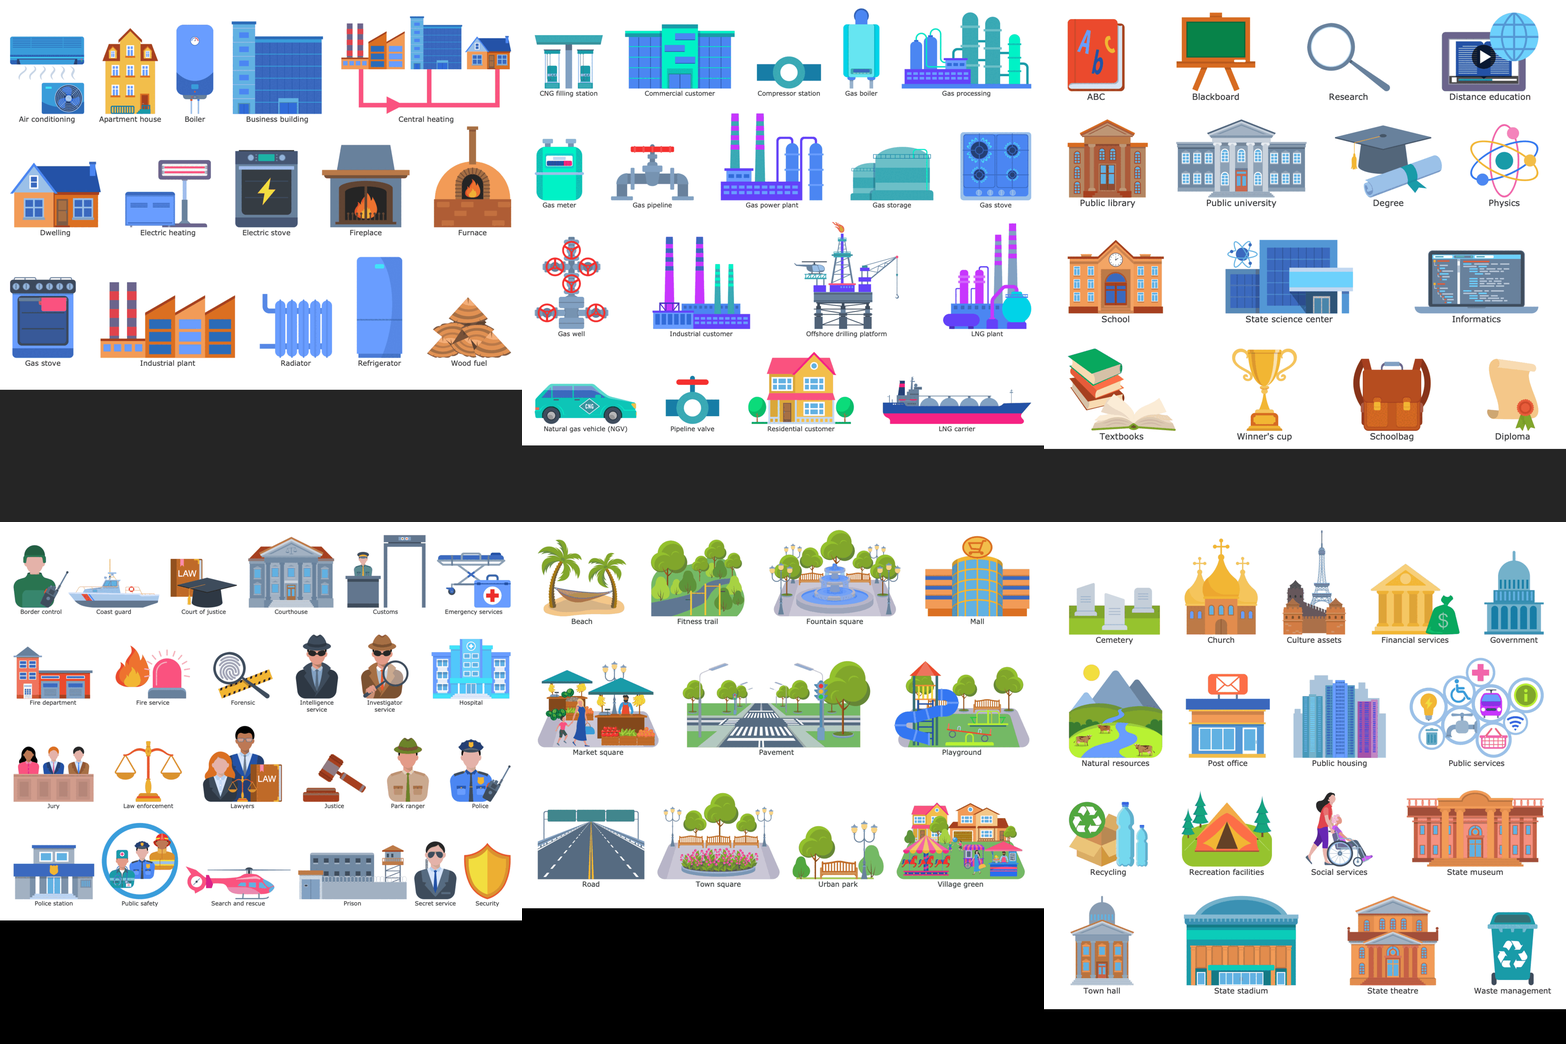
Vector Icons
Vector graphics are incredibly popular among designers, illustrators, architects, and graphic artists. These are computer images created using vector shapes, icons, and lines in a two-dimensional or three-dimensional space. Vector graphics contain sets of connected dots, lines, and curves, and are created based on algorithms and mathematical equations for the lines to connect the points.
One of the main features of vector graphics is their scalability. Vector graphics are scaled and easily edited without loss of quality. Vector images seem precise at any size, maintain sharpness and clarity. You can infinitely make them larger or smaller. It is a really great advantage. This allows vector graphics and vector icons to be displayed correctly on different devices, platforms, and in different applications. The increasing or decreasing of the image doesn't affect the file size, which is usually small and smaller than the size of raster files due to storing only a small number of points and the mathematical relationships between them. As a result, the use of vector graphics improves performance and increases the loading speed of the application or page.
Vector graphics are popular in the development of applications, web development, animation, computer-aided design, etc. They are part of a large variety of web-published or printed materials, magazines, billboards, presentations, promotional materials, etc. They help to make high-quality materials and develop logos that should always have a vector format to be correctly displayed on different platforms and in different sizes.
Vector icons are an integral part of vector graphics, vector illustrations, infographics, diagrams, presentations, and other materials. The use of vector icons has a lot of advantages. Vector icons for different areas have an unambiguous meaning, relevant design, and are universally accepted. They are attractive to viewers, engage their attention, are ornamental, and make your materials presentable and efficient. They easier perception of information and make it more easily remembered than text. Vector icons are also the main component of infographics and diagrams related to different areas, including public utilities supply, transportation asset management, and many others.

Example 1. Vector Icons for Public Utilities Infografics
ConceptDraw DIAGRAM is a powerful software to create vector graphics. The libraries of the solutions offer large amounts of multifarious vector icons and shapes in different thematic areas. Vector icons are easily edited, you can change their size and easily duplicate them. The color change is possible with just one click on the object and new color in the palette. The embedded tools also allow fast and simple arranging of objects. Once your vector graphics are created in ConceptDraw DIAGRAM software, you are free to export them to various vector formats directly from the application to be then opened in different applications and share them with friends and colleagues.
Public Utilities solution for ConceptDraw DIAGRAM Solution Park offers a large variety of colorful vector icons, which help design unique and attractive vector graphics, illustrations, infographics, and diagrams in public utilities area.
Example 2. Electricity Supply Chain in ConceptDraw DIAGRAM
The Internet of Things solution provides 12 libraries with 188 colorful and attractive vector icons and design elements:
- Public Education
- Public Healthcare
- Public Security
- Public Spaces
- Public Transit
- Public Works
- Gas Service
- Central Heating
- Electricity Supply
- Traffic Management
- Transport Asset Management
- Water and Sewage
Example 3. Transportation Asset Management
The Public Utilities Infographics samples you see on this page were created in ConceptDraw DIAGRAM software using the drawing tools of the Public Utilities Solution. These examples successfully demonstrate solution's capabilities and the professional results you can achieve using it. An experienced user spent 10-15 minutes creating each of these samples.
Use the powerful tools of the Public Utilities solution to design your own Public Utilities Infographics quick, easy, and effective.
All source documents are vector graphic documents. They are available for reviewing, modifying, or converting to a variety of formats (PDF file, MS PowerPoint, MS Visio, and many other graphic formats) from the ConceptDraw STORE. The Public Utilities Solution is available for ConceptDraw DIAGRAM users.