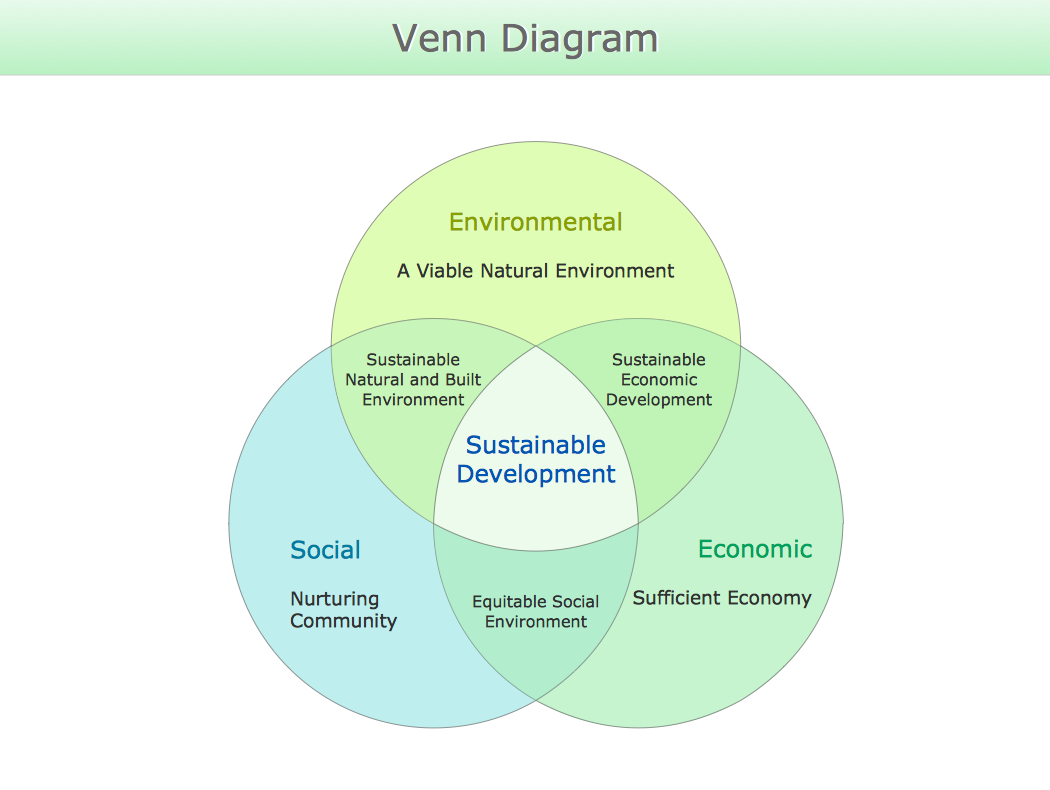
Example 3. Venn Diagram — Sustainable Development
There are some similar diagram types, based on Venn Diagram:
- Euler diagrams similar to Venn Diagrams, but they may not describe all the possible relations.
- Johnston diagrams, which are used to illustrate statements in propositional logic, such as "Neither A nor B is true", and are a visual way of illustrating truth tables.
- Karnaugh maps or Veitch diagram are another way of visually representing Boolean expressions.
- Peirce diagrams, devised by Charles Peirce, are extensions to Venn diagrams which include information on existential statements, disjunctive information, probabilities, and relations.

Example 3. Venn Diagram — Knowledge
This simple example was created in ConceptDraw DIAGRAM using the Business Diagrams Solution. It shows the use of Venn Diagram to compare two people groups. One circle represents all the information people know about the stock market in Britain, the other circle represents all the information they know about stock market in Germany. Any features the two areas share can be written in the intersection of the circles. The result shows at a glance what the two markets have in common and what features are different.
Use Business Diagrams solution to quick and easy design your own Venn Diagram of any complexity.
The Venn Diagrams designed with ConceptDraw DIAGRAM are vector graphic documents and are available for reviewing, modifying, converting to a variety of formats (image, HTML, PDF file, MS PowerPoint Presentation, Adobe Flash or MS Visio), printing and send via e-mail in one moment.
TEN RELATED HOW TO's:
Matrix organizational structure is one of the main forms of structures which is actively used by organizations to carry forth the functions of a company visually and effectively.
Now we have ConceptDraw DIAGRAM diagramming and vector drawing software extended with 25 Typical Orgcharts solution from the Management area of ConceptDraw Solution Park which will help easy represent matrix organizational structure of any degree of complexity.
Picture: Matrix Organization Structure
Related Solution:
Perfect Network Diagramming Software with examples of LAN Diagrams. ConceptDraw Network Diagram is ideal for network engineers and network designers who need to draw Logical Network diagrams.
Picture: Network Diagram SoftwareLogical Network Diagram
Use of various charts, diagrams and infographics is the most effective way of visual presenting information about healthy foods, healthy eating and healthy diet. ConceptDraw DIAGRAM diagramming and vector drawing software offers the Health Food solution from the Food and Beverage area of ConceptDraw Solution Park which is overfull of powerful drawing tools, libraries with ready-to-use vector objects and clipart, predesigned samples and examples which will help you easy design healthy foods illustrations.
Picture: Healthy Foods
Related Solution:
Event-Driven Process chain Diagrams for improvement throughout an organisation. Best software for Process Flow Diagram. The Event-driven Process Chain (EPC) Diagrams allows managers to plan processes and resources.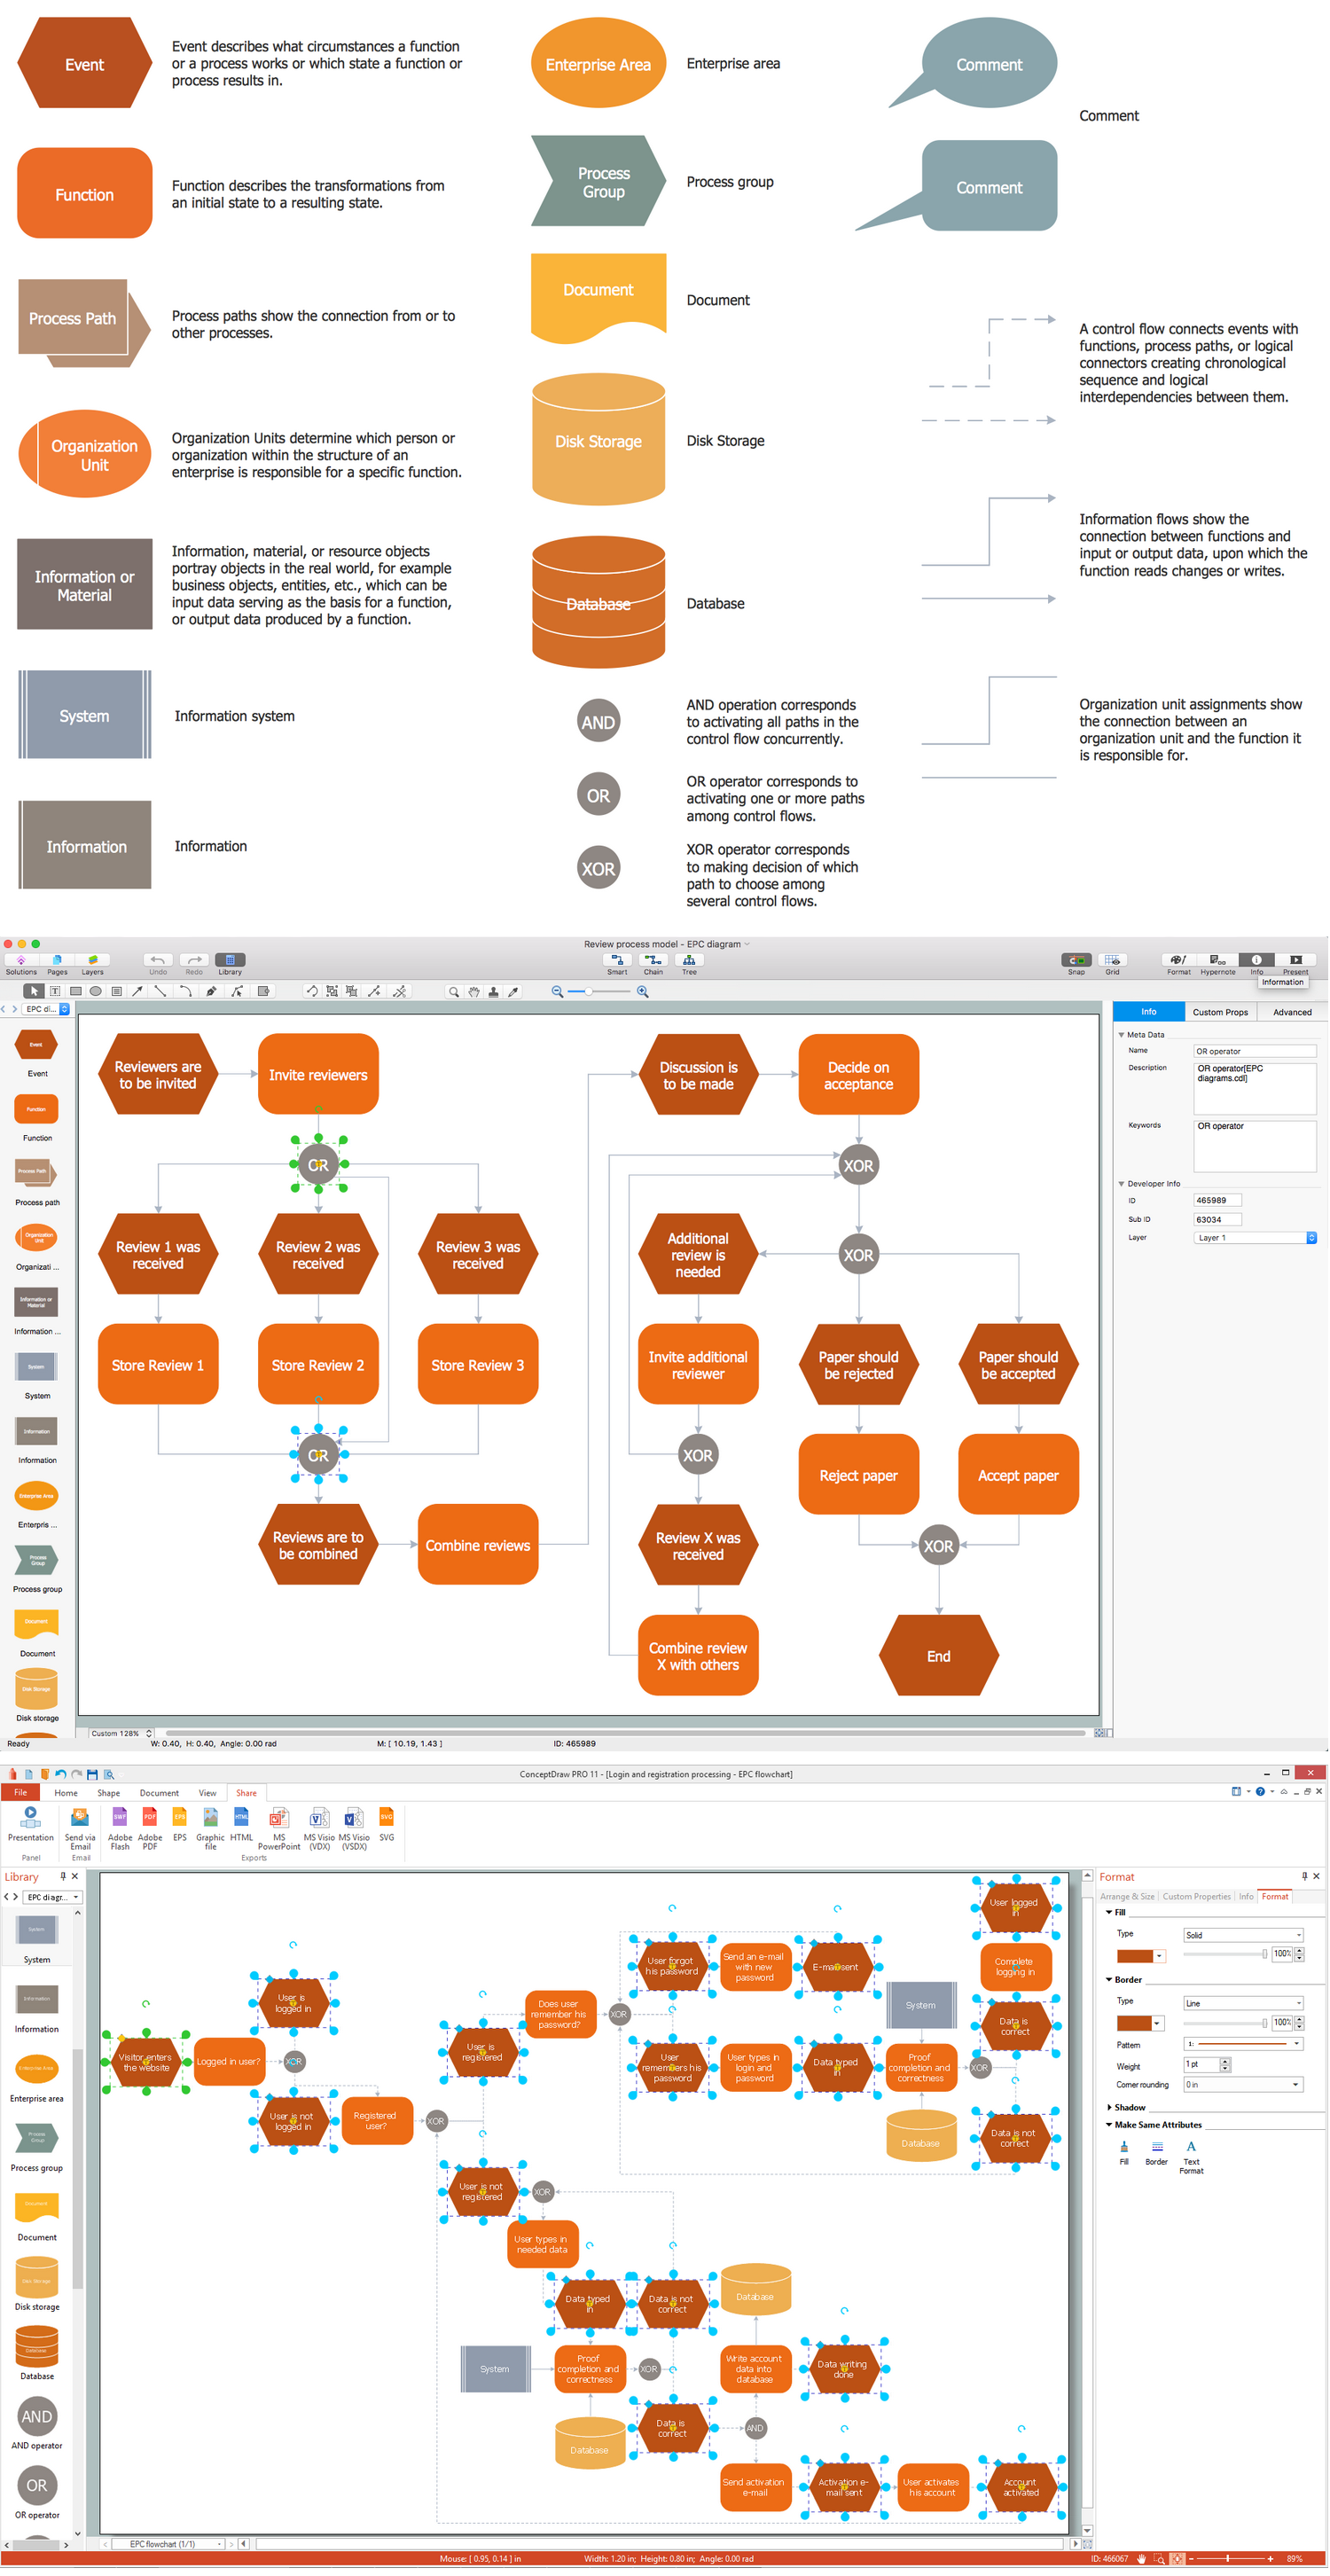
Picture: Business process Flow Chart — Event-Driven Process chain (EPC) diagrams
Related Solution:
Competitor analysis is a first and obligatory step in elaboration the proper corporate marketing strategy and creating sustainable competitive advantage. Use powerful opportunities of numerous solutions from ConceptDraw Solution Park for designing illustrative diagrams, charts, matrices which are necessary for effective competitor analysis.
Picture: Competitor Analysis
Related Solution:
This sample shows the Bar Chart of the leverage ratios for two major investment banks. The leverage ratio is the ratio of the total debt to the total equity; it is a measure of the risk taken by the bank. The higher of the leverage ratio denotes the more risk, the greater risks can lead to the subprime crisis.
Picture: Financial Comparison Chart
Related Solution:
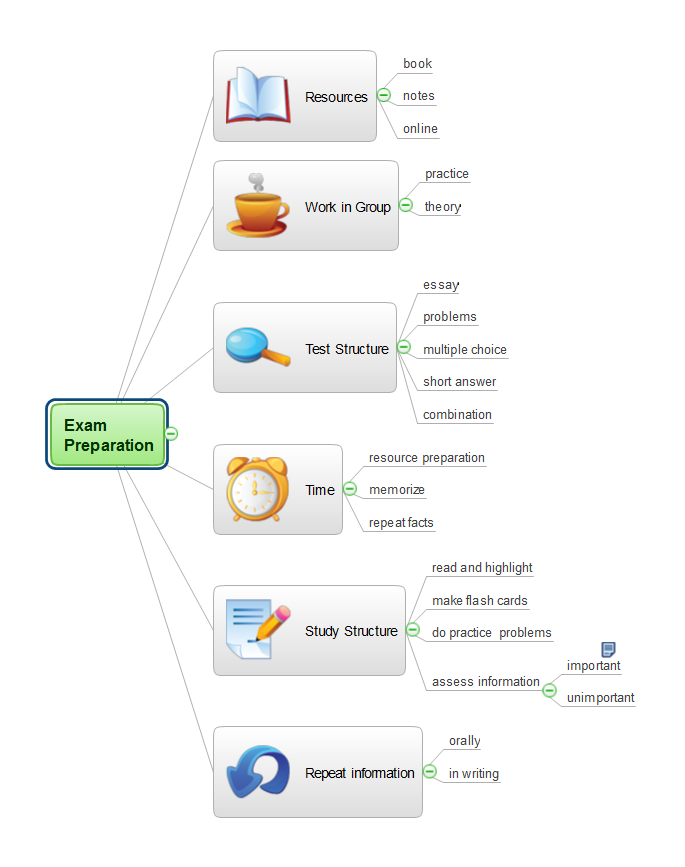
Picture: Exam Preparation Mind Map
Related Solution:
To create an Audit Process FlowChart you only need Conceptdaw Software.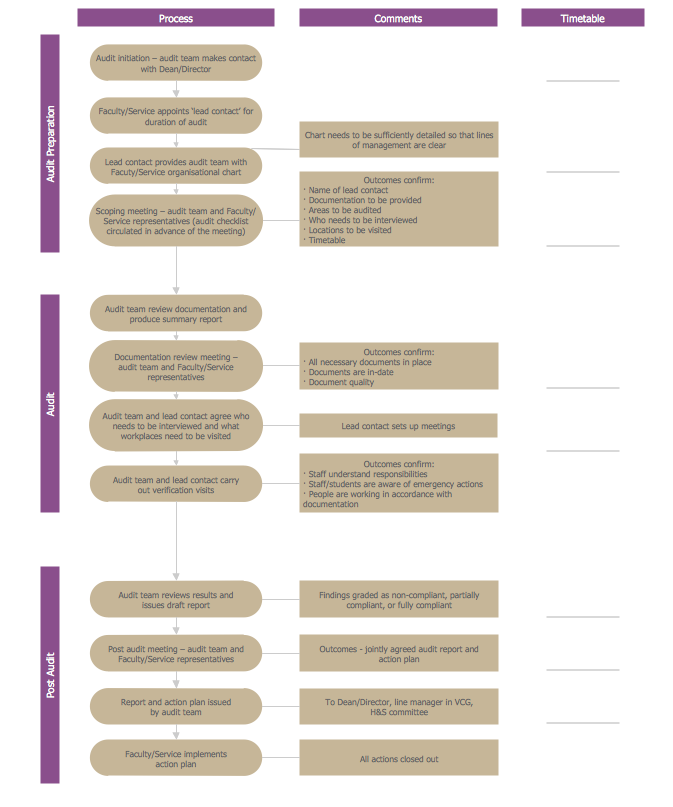
Picture: Basic Audit Flowchart. Flowchart Examples
Related Solution:
A flowchart is a powerful tool for examining processes. It helps improving processes a lot, as it becomes much easier to communicate between involved people, to identify potential problems and to optimize workflow. There are flowcharts of different shapes, sizes and types of flowchart vary from quite basic process flowcharts to complex program flowcharts. Nevertheless, all these diagrams use the same set of special symbols like arrows to connect blocks, parallelogram to show data receiving or rectangles for showing process steps.
Basic flowcharts are used to represent a simple process algorithm. A basic flowchart notation consists of rectangles (business processes), arrows (the flow of information, documents, etc.). The same notation is used in items such as the "decision", which allow you to do the branching. To indicate the start of the entire business process and its termination can be used the "Terminator" element. The advantages of Basic Flowchart are simplicity and clarity. With it you can quickly describe the business process steps. Creating of Basic Flowchart does not require any special knowledge, as easily understand by employees with different levels of education and IQ.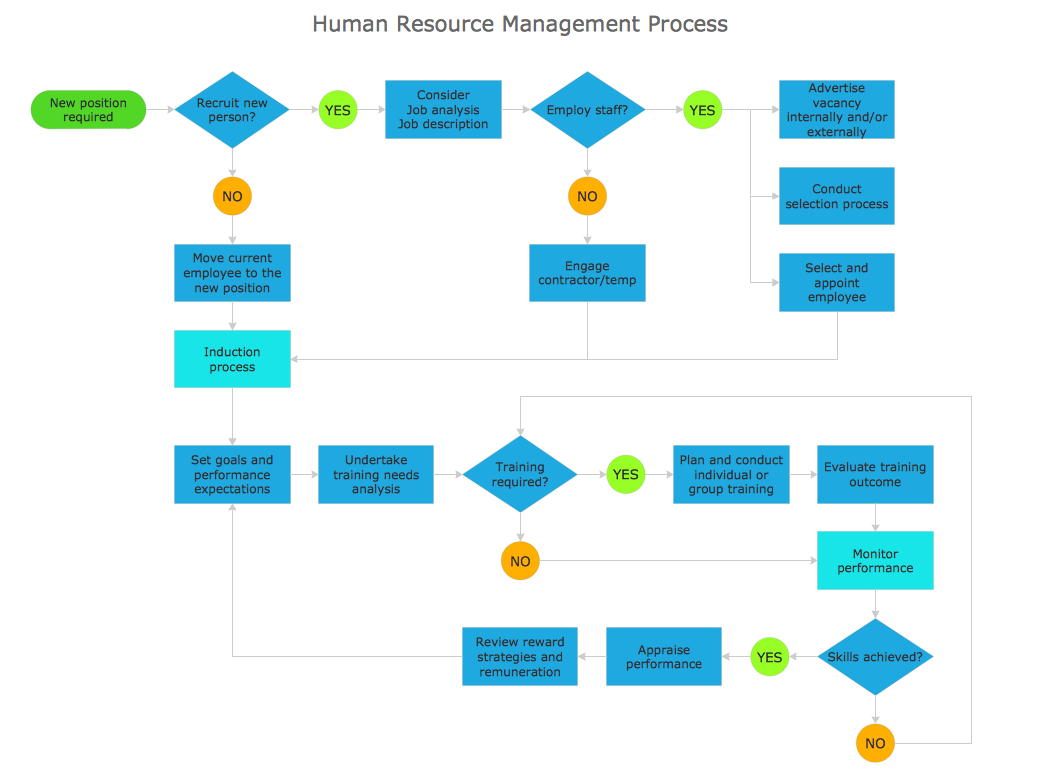
Picture: Types of Flowchart: Comprehensive Overview
Related Solution:
If your company is in chaos in clutter and no one understands their rights and responsibilities, maybe it's time to change that. One of the ways to put the company in order is to draw an organization chart that would reflect the structure and show the relationships among departments and positions. This is a very useful and easy to understand scheme.
This is example of the one of the most typical kind of organizational chart. It depicts an organizational structure of the hierarchical type. Its construction is similarv to pyramid. The single main position on the top - in this case, the mayor's position followed by sub-levels of authority in his command. Each position in the pyramid reports only to his supervisor, and takes only a report of direct subordinates. Such scheme limits the number of communications. This organizational structure is effectively used in public organizations. Also it is suitable for any organization with the need for multiple levels of middle managers. The ability to create organizational charts of different types is supplied with ConceptDraw Ogrcharts solutions.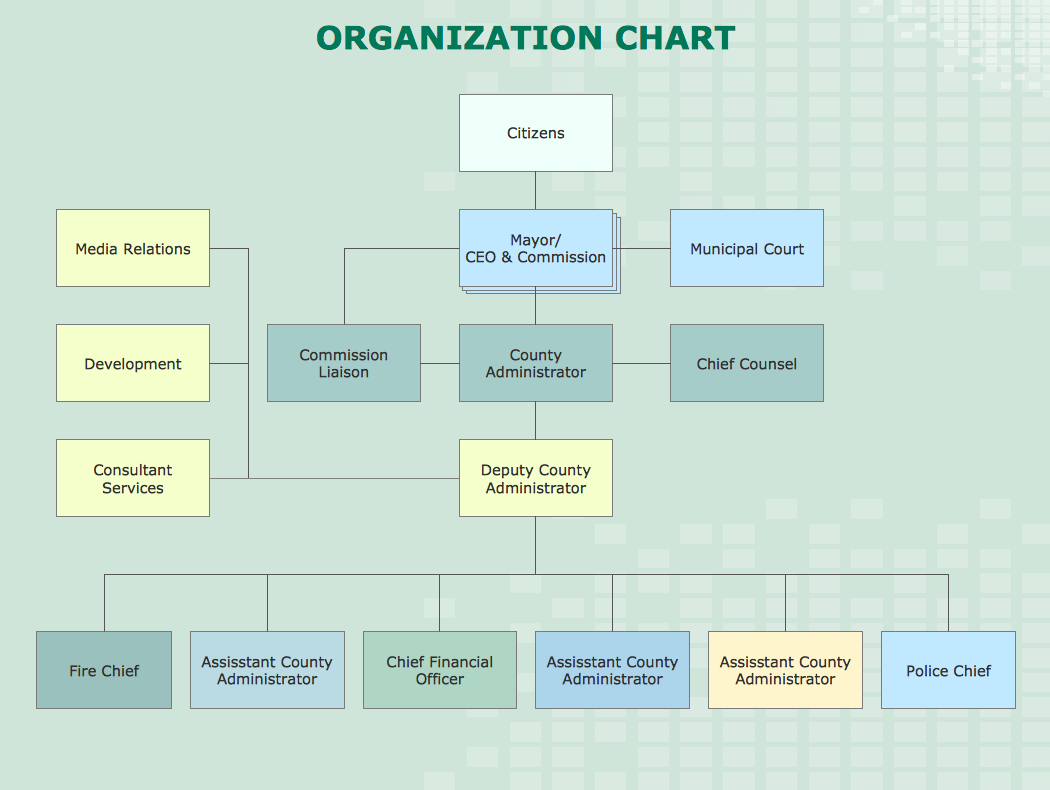
Picture: How to Draw an Organizational Chart
Related Solution:

