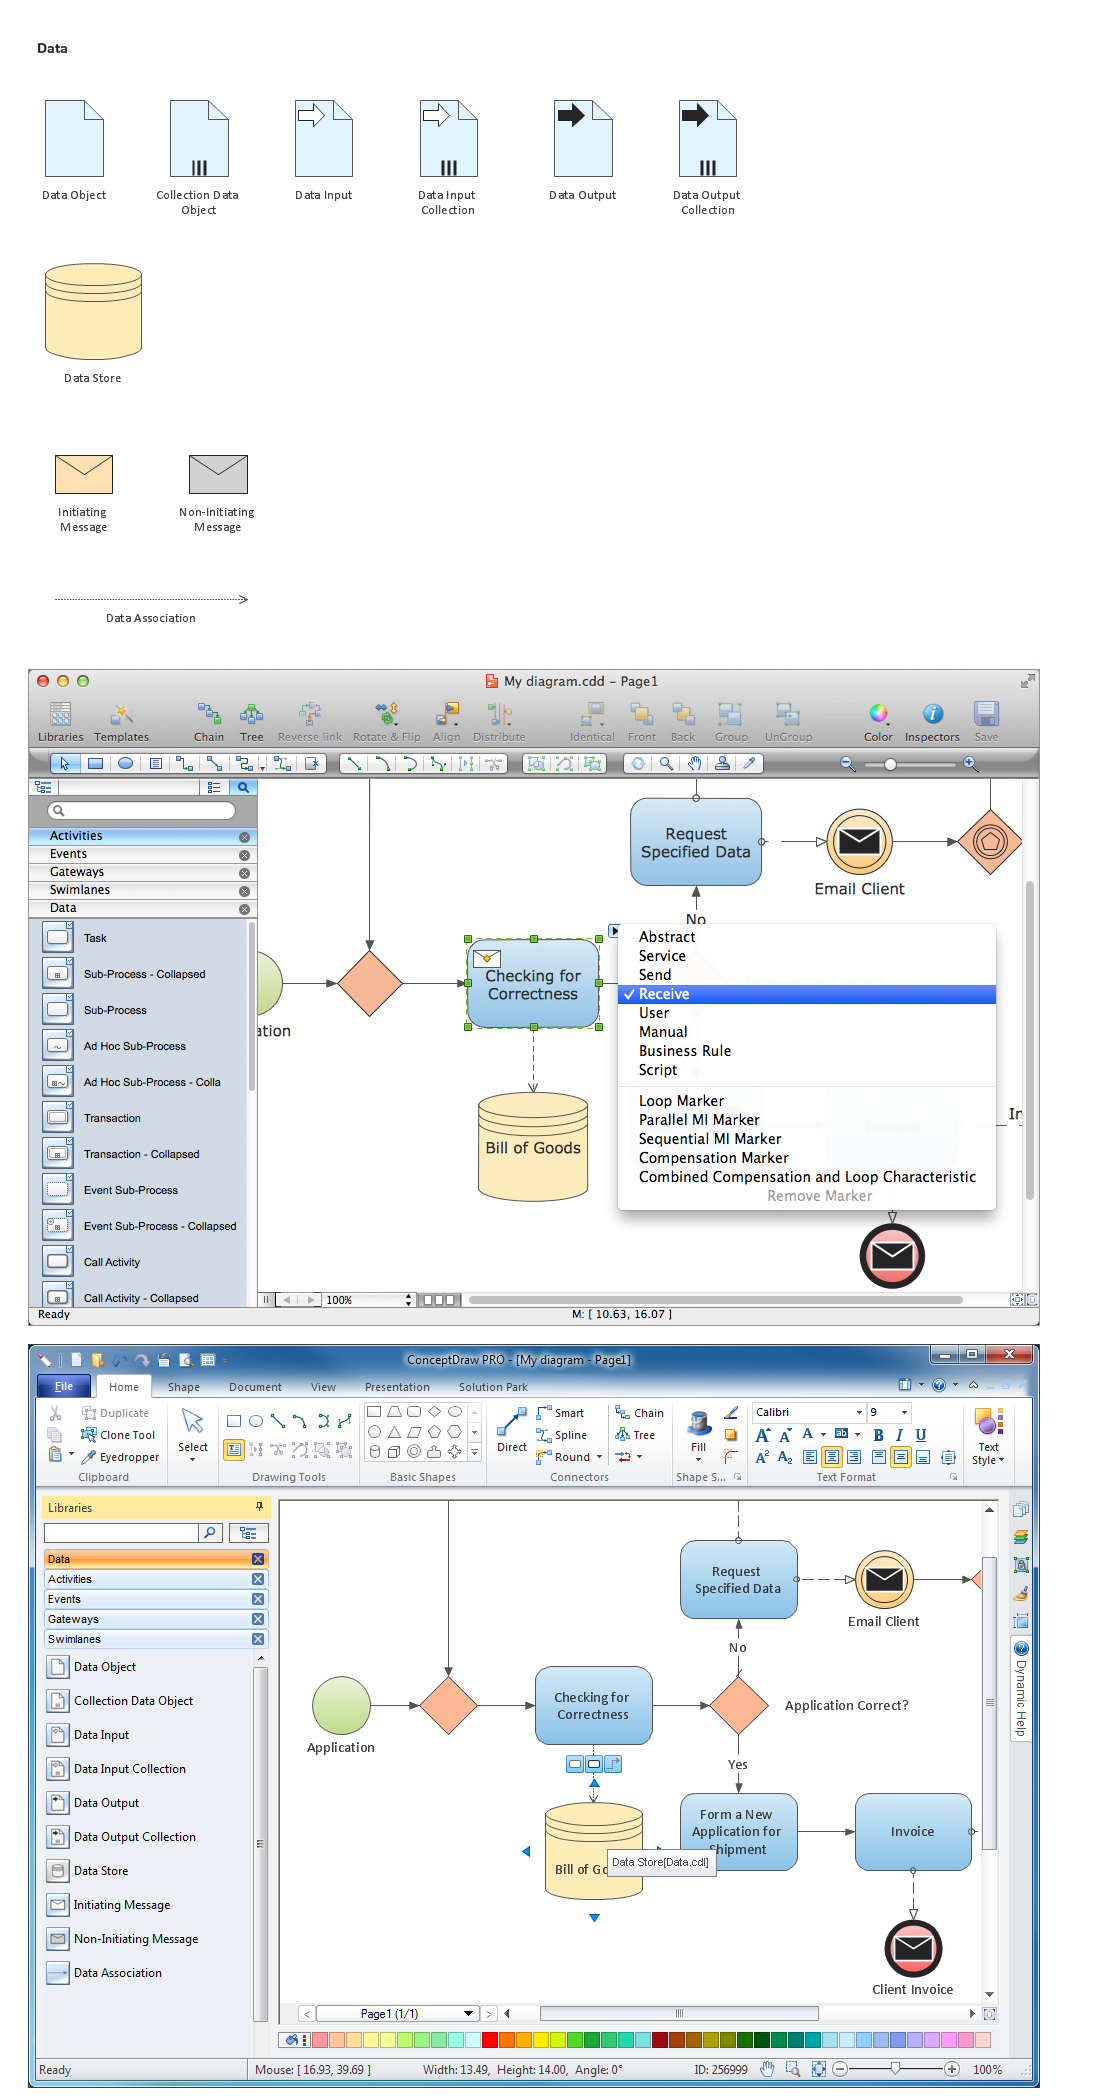
How to Draw Business Process Diagrams with RapidDraw Interface
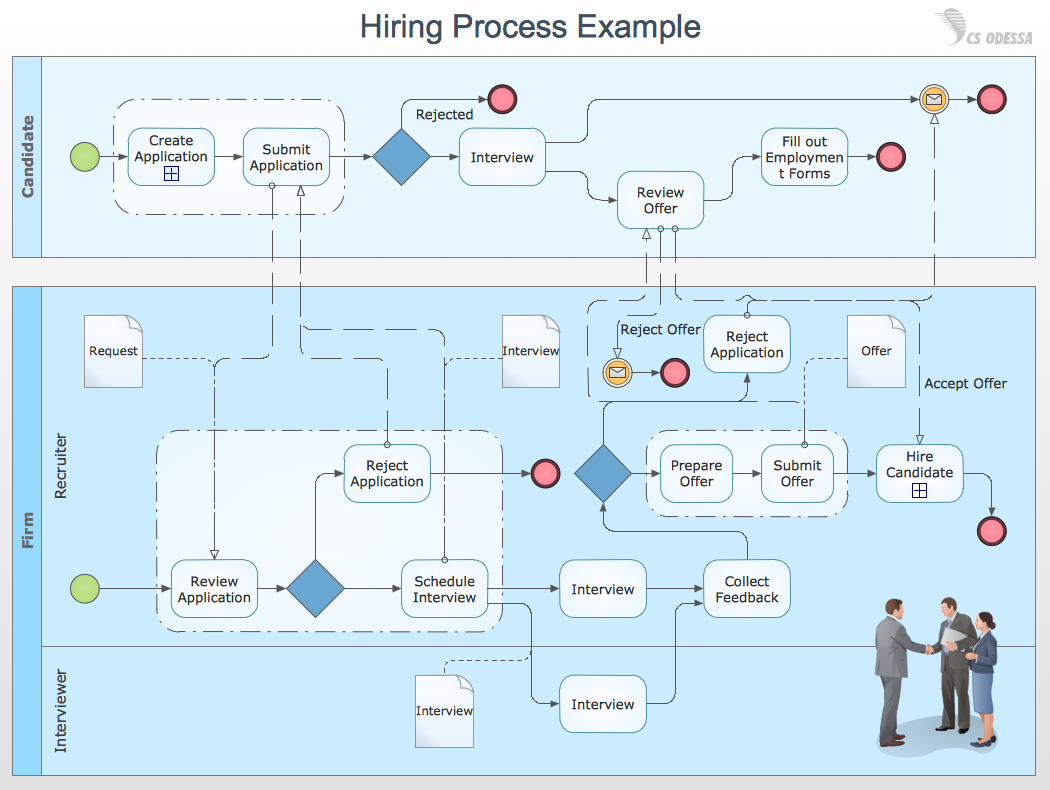
Business Process Modeling Notation (BPMN) is a set of standard symbols that allow you to create a graphical view of a business process. The symbols were developed to help users develop standard, unified structure of processes, and any messages shared between these processes.
As the business world becomes more complex, so must the processes that keep it running. What′s more, with more participants involved in the running of a business, both from inside and out, it′s important we have a unified modeling technique that can handle the interaction between these processes. BPMN is a visual tool for businesses and business process implementers. A critical focus of BPMN is that it is seen as critical for business users to easily read and understand business process diagrams.
BPMN is a process-oriented approach to modeling of systems; this sets it apart from UML which has a more object-oriented approach. With the addition of BPMN to ConceptDraw DIAGRAM users have the capability of using either BPMN or UML to describe a process, depending on their needs.
Pic.1. Swim Lane Diagram - Hiring Process Example
All source documents are vector graphic documents. They are available for reviewing, modifying or converting to a variety of formats (PDF file, Power point Presentation, image or MS Visio) from ConceptDraw STORE, for all users who have installed Business Process Diagram solutions.
Nowadays, a constructor needs skills in various areas. For instance, knowing How To use Appliances Symbols for Building Plan, can be useful in developing illustrations for customers. Aware means armed.
This image shows the content of the Appliances library that is a component of the ConceptDraw Floor Plans solution. Being used with ConceptDraw DIAGRAM drawing facilities, this library allows you to create floor plan and interior design for your new family residence and its, undoubtedly the most important section such as kitchen and bathroom. As considering your kitchen arrangement and developing the properly variant for your apartment, one of the main points is the complete layout of the kitchen and its appliances. The vector graphical objects supplied with ConceptDraw Floor plans solution by allows you easily display the most original ideas of kitchen and bathroom layout.
Picture: How To use Appliances Symbols for Building Plan
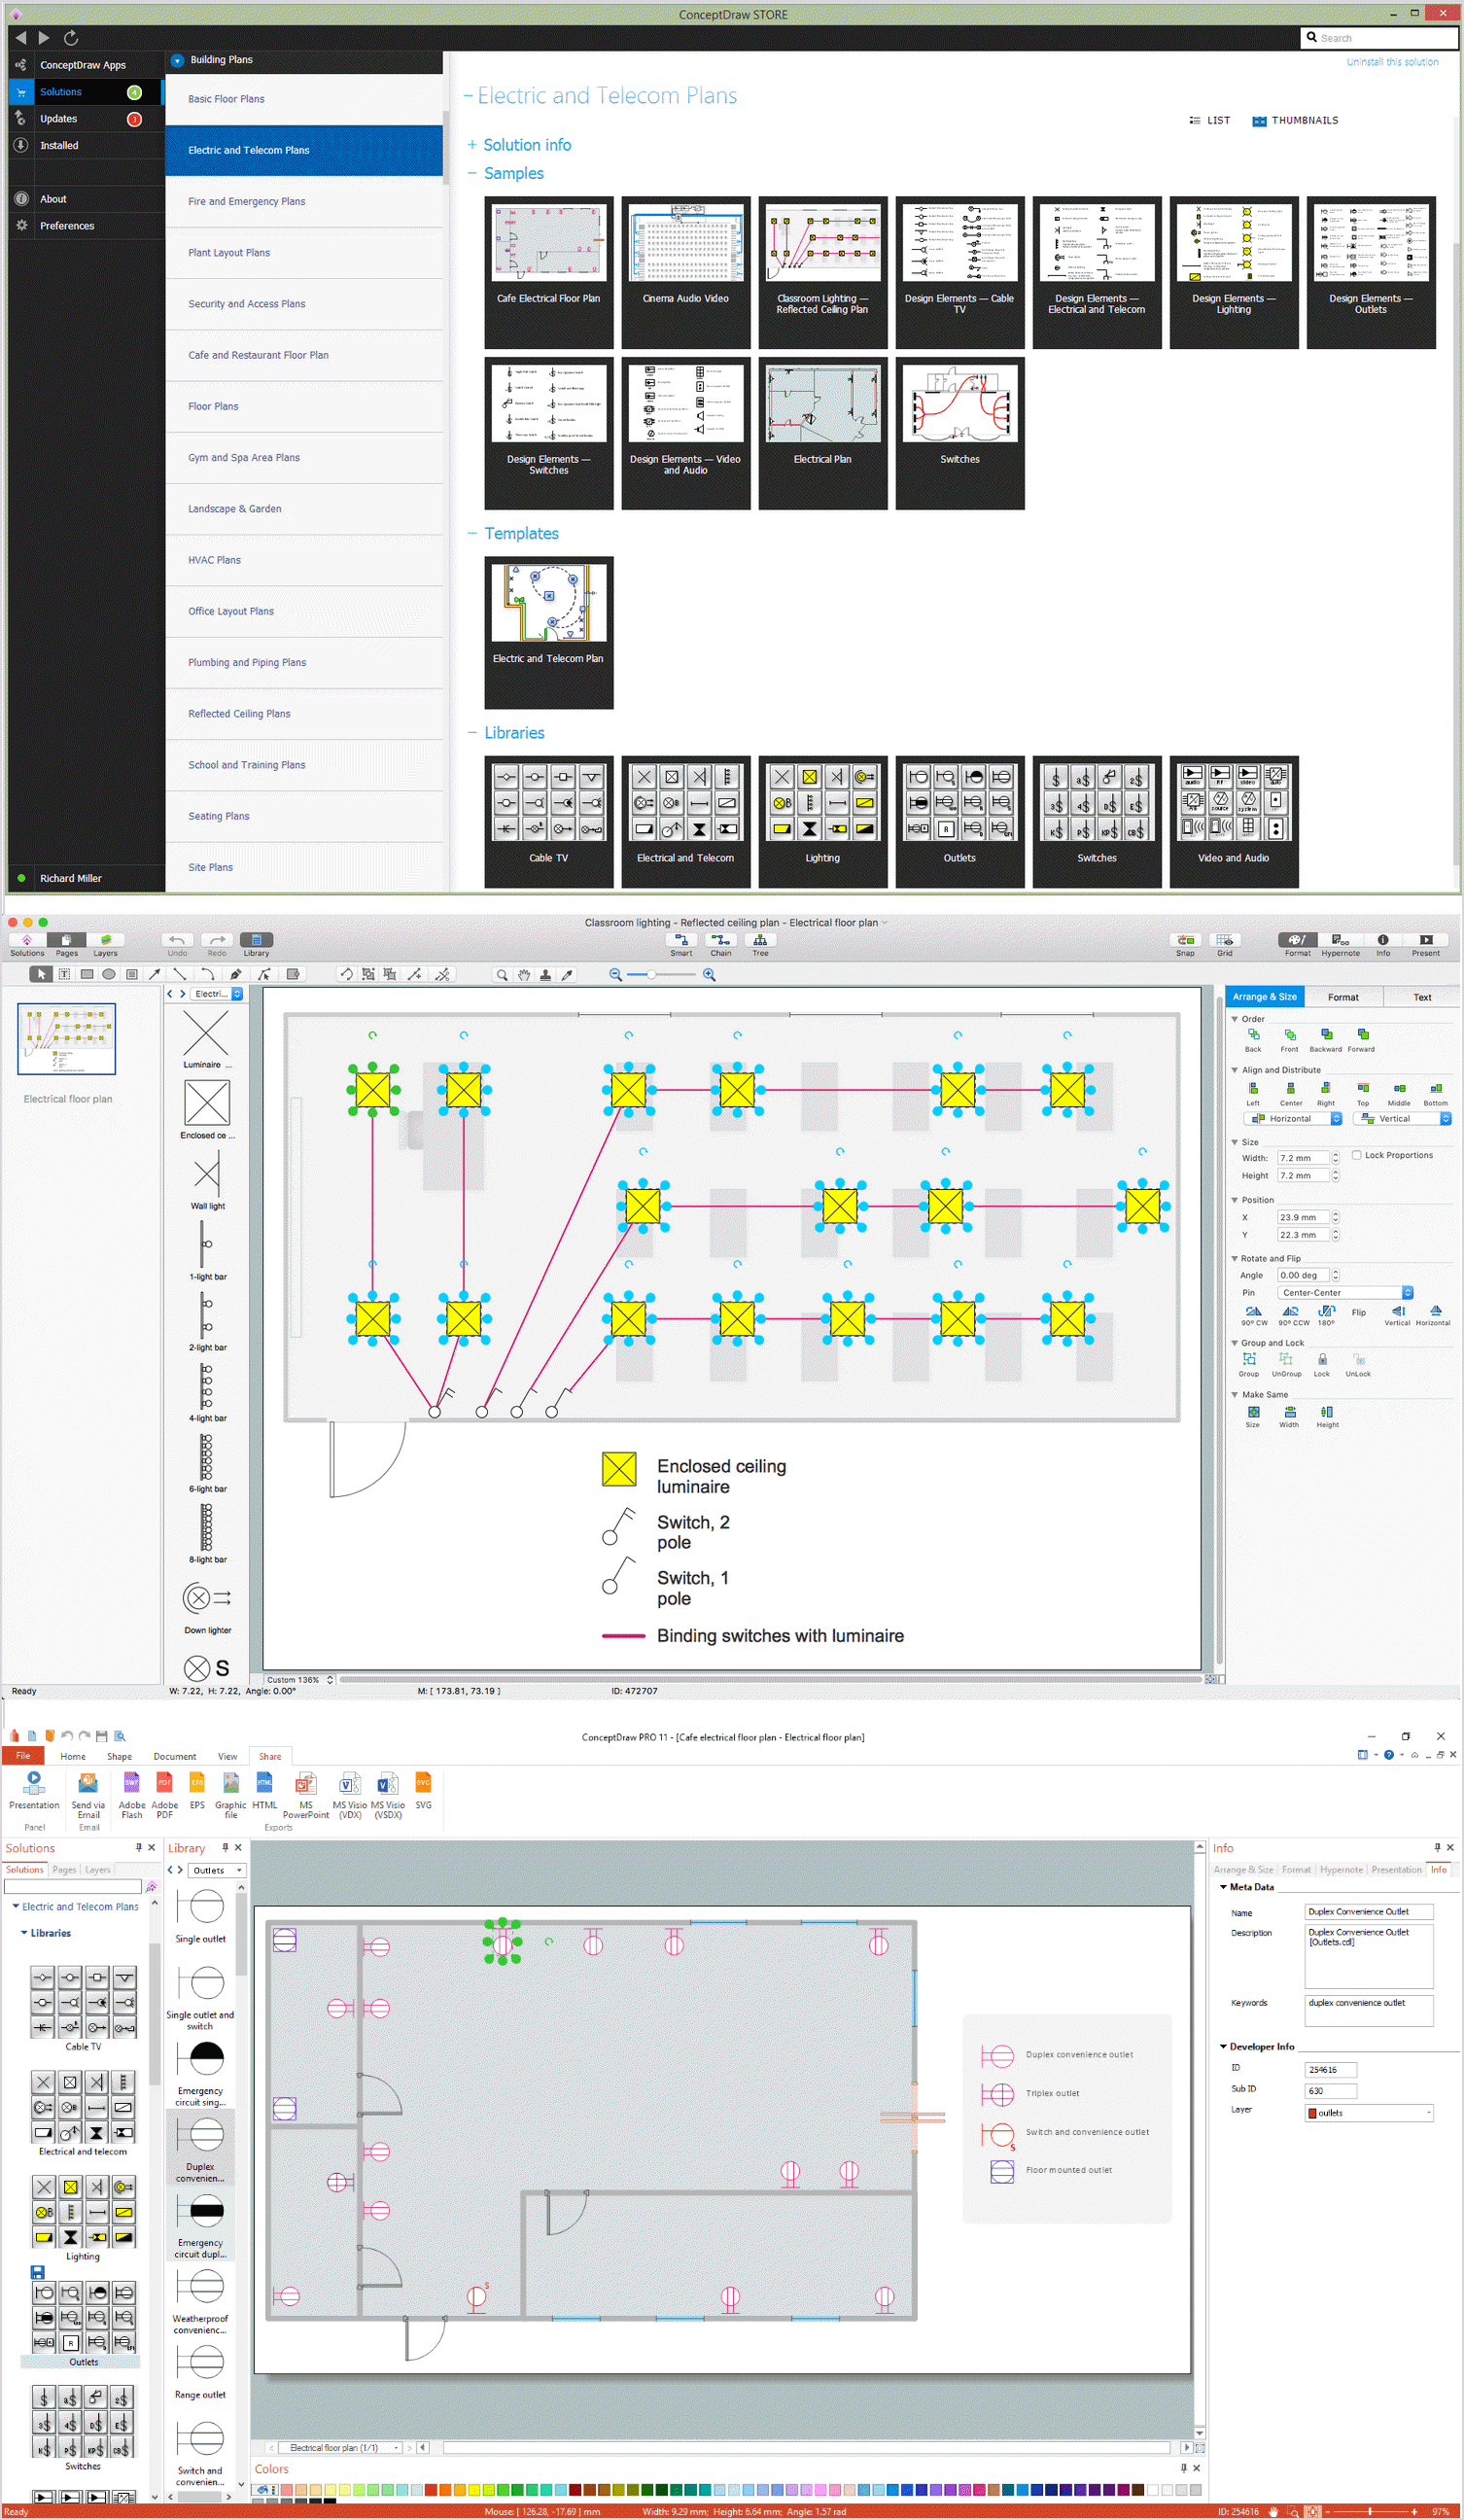
Drawing an electric circuit plan with all the wiring might seem very complex. If you ever felt afraid to ask how to use electrical and telecom plan software, then it’s time to actually start from altering the templates from the Solution Park. You won’t even notice the moment when you would become an experienced user.
This electrical and telecommunication floor plan plan presents electrical and telecommunication devices located in a country house floor plan. Each electrical or telecom device on this plan is indicated with the particular symbol. Using standard Electrical and Telecommunication symbols makes this floor plan clear for anybody who will be involved into construction process. All the electrical and telecom symbols used in the current floor plan are placed to a legend. This electrical and telecom floor plan can be included as a separate piece into a package of building documentation.
Picture: How To use Electrical and Telecom Plan Software
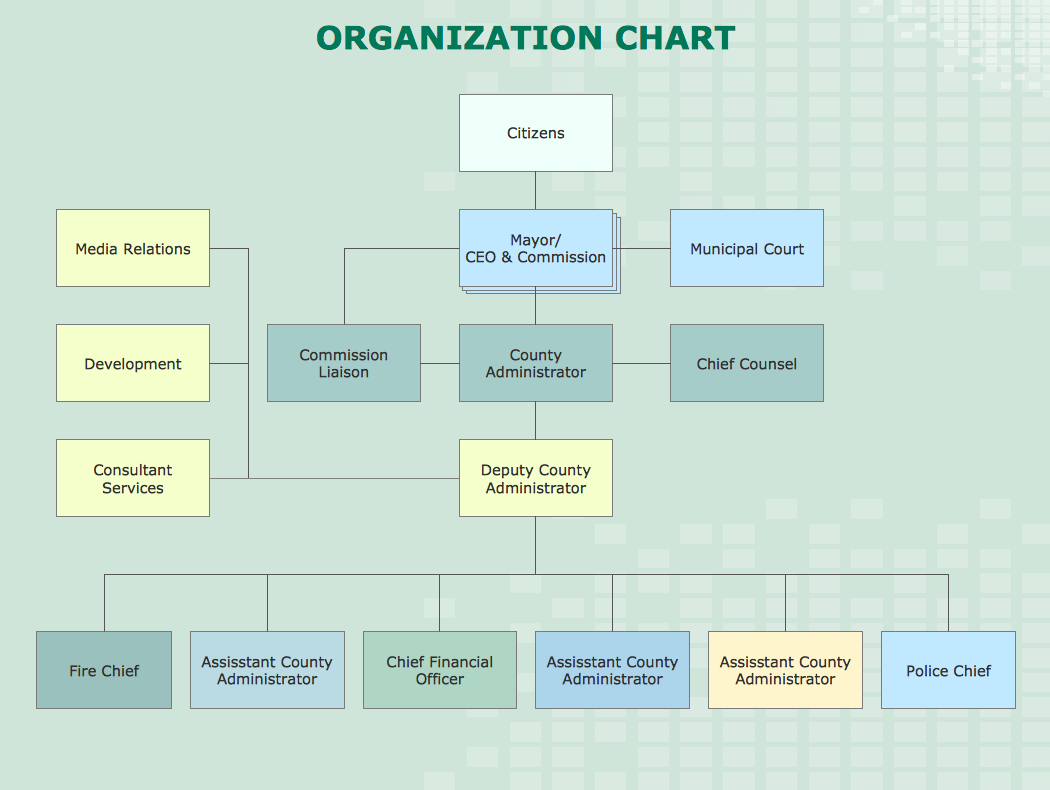
If your company is in chaos in clutter and no one understands their rights and responsibilities, maybe it's time to change that. One of the ways to put the company in order is to draw an organization chart that would reflect the structure and show the relationships among departments and positions. This is a very useful and easy to understand scheme.
This is example of the one of the most typical kind of organizational chart. It depicts an organizational structure of the hierarchical type. Its construction is similarv to pyramid. The single main position on the top - in this case, the mayor's position followed by sub-levels of authority in his command. Each position in the pyramid reports only to his supervisor, and takes only a report of direct subordinates. Such scheme limits the number of communications. This organizational structure is effectively used in public organizations. Also it is suitable for any organization with the need for multiple levels of middle managers. The ability to create organizational charts of different types is supplied with ConceptDraw Ogrcharts solutions.
ConceptDraw DIAGRAM application is perfect for creating workflow diagrams. This application contains specific features and technologies designed to draw diagrams faster, such as RapidDraw and Arrows10. ConceptDraw DIAGRAM software extended with the Workflow Diagrams solution gives you a flexible tool to draw any kind of workflow.
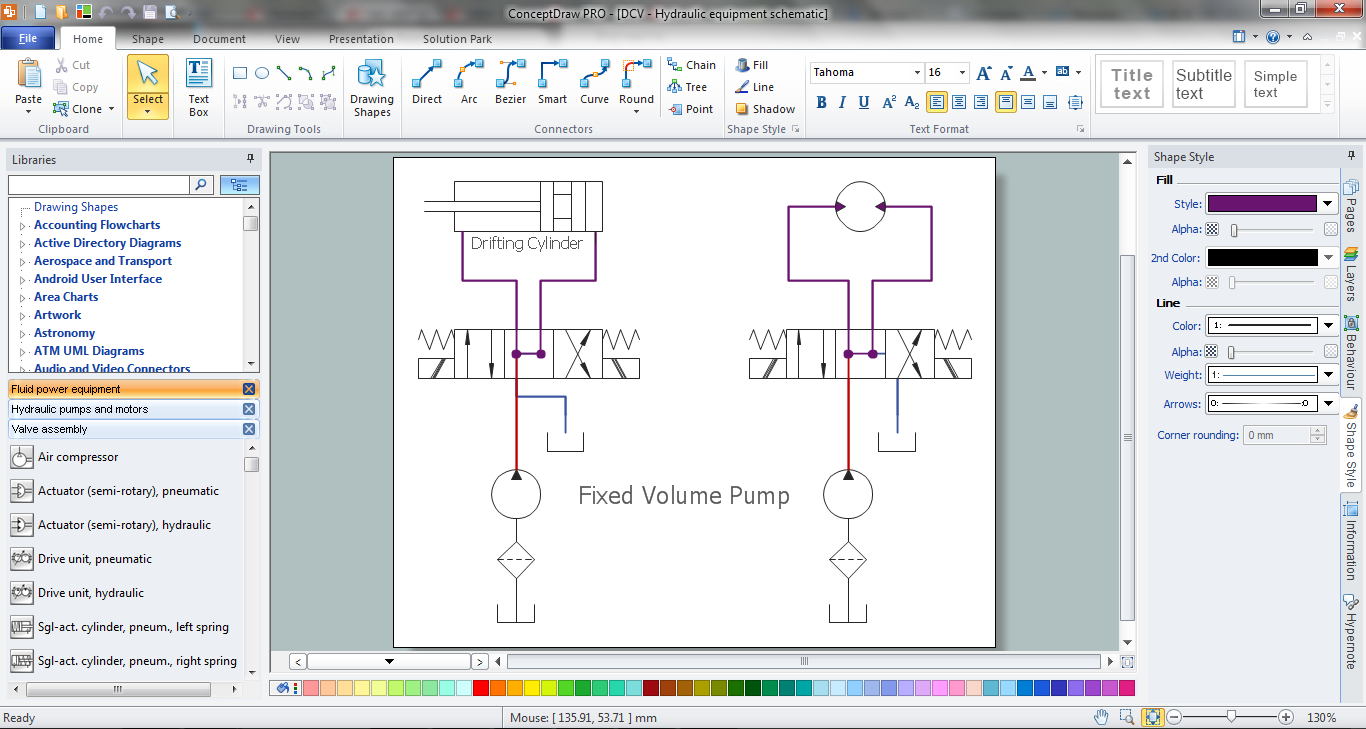
Mechanical design is a labour-intensive process. To facilitate the task of Mechanical Engineering Diagrams creating, ConceptDraw DIAGRAM diagramming and vector drawing software was extended with Mechanical Engineering solution from the Engineering area. Now, ConceptDraw DIAGRAM is a powerful Mechanical Design Software.
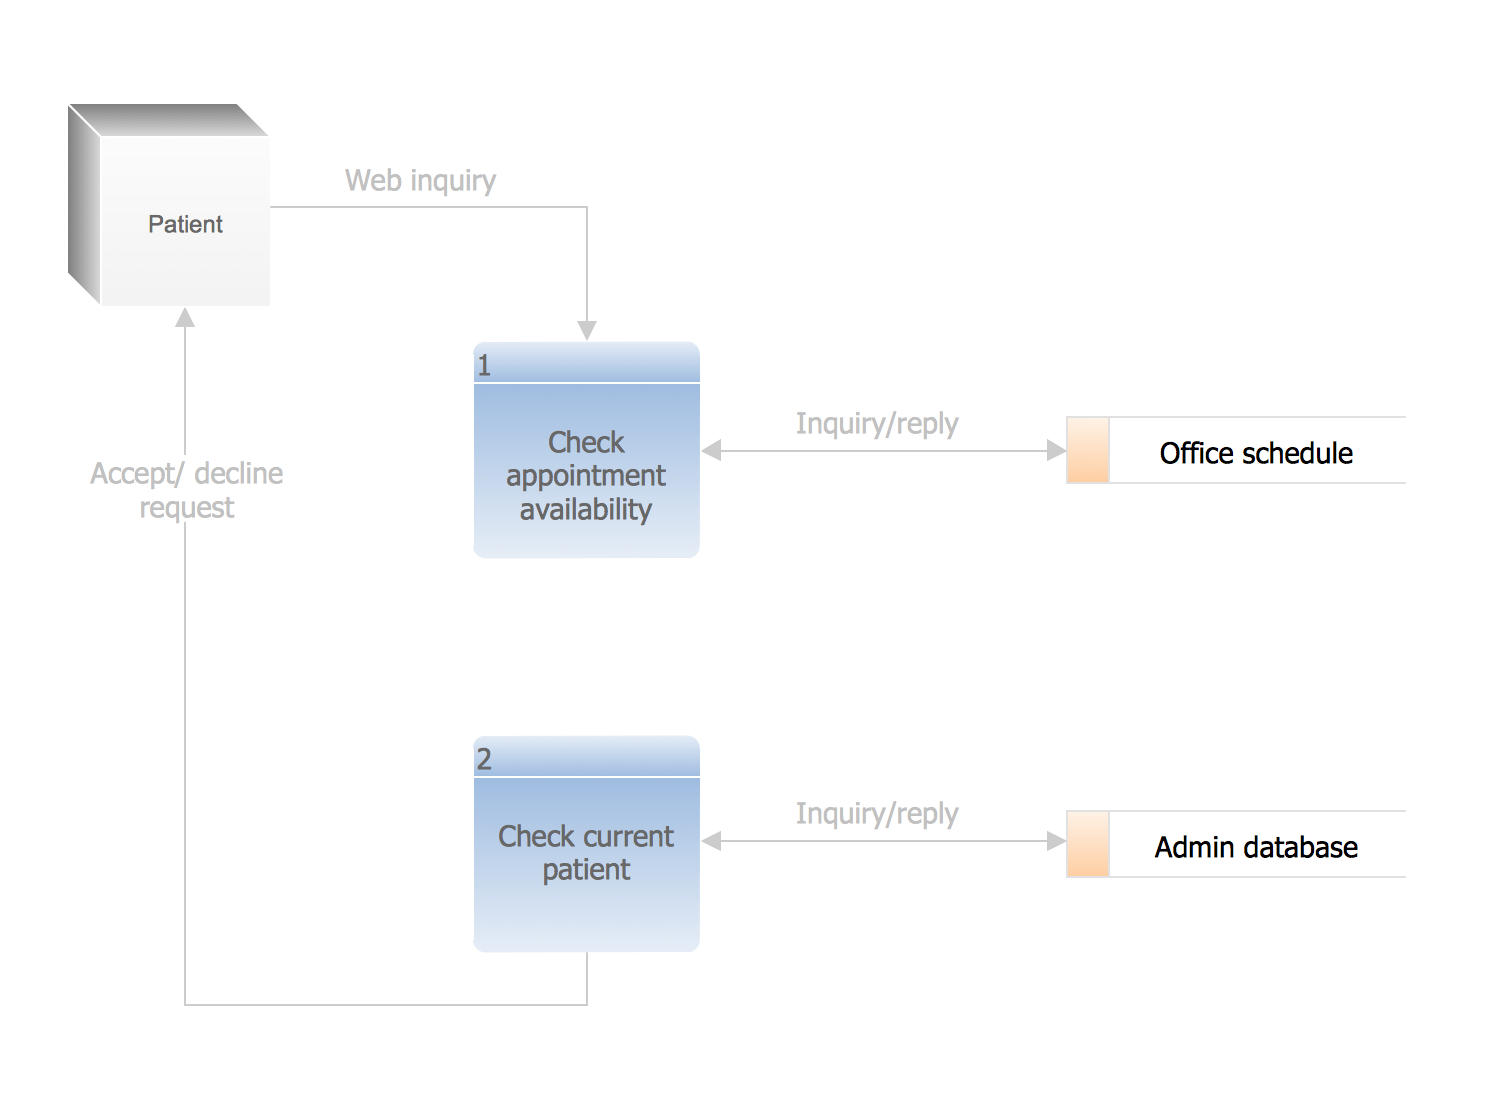
Describing the way data flows through an information system might become a subject of a study. One of the kinds on a data flow diagram is called Gane Sarson Diagram after its authors, and it slightly differs from other notations. Process symbols in this notation are depicted as rounded rectangles connected with arrows representing data flows.
This is a sample of data flow diagram. It demonstrates utilization of the Gane-Sarson notation for making DFD on the example of an online appointment system of the Health Centre. This sample is used the vector objects library of Gane-Sarson DFD notation supplied by the ConceptDraw solution for data flow diagramming. It contains all symbols of the Gane-Sarson notation including connectors, jumps, and processes. This solution can be successfully utilized to generate DFDs for business documentation, and presentations.
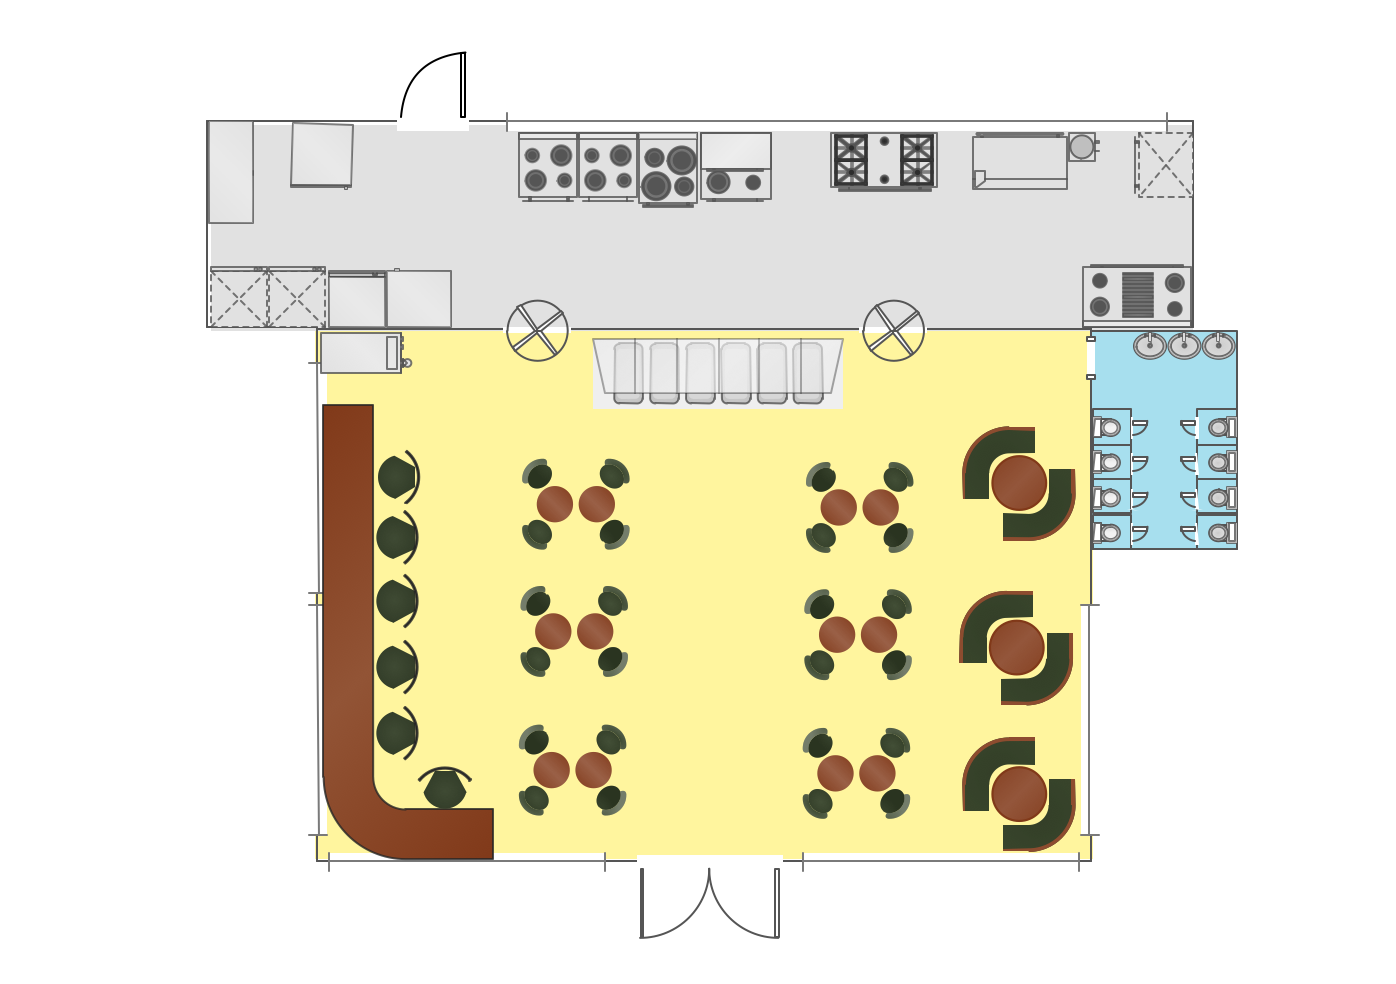
Working as a designer, you might find developing projects exciting and difficult at the same time. It is a challenging task to create a usable interior design that will fulfill all the customer’s requirements. So, in order to aid yourself, you can use special software to create site plans, landscape designs, furniture layouts.
This example of an interior plan introduces an internal area of a small cafe. The floor plan demonstrates interior angle "view from above". It involves many different elements of furniture such as tables , chairs and various cushioned furniture. Also it includes a kitchen fixtures and furniture. Making this plan was managed by the ConceptDraw Cafe and Restaurant Floor Plan solution. The libraries, composing this solution contain about vector graphic 300 objects. It can be use to help interior designers to develop interior design proposals, communicate ideas and concepts that relate to a interior design.
UML Sequence Diagram shows object interactions arranged in time sequence, how processes operate with one another and in what order and illustrate the sequence of messages exchanged between the objects and classes involved in the scenario.