A full-featured project management solution with all the necessary functions right at your fingertips. Generates an extensive variety of reports on project and task statuses. Centralizes project information through embedded documents and hyperlinks. Unique Multiproject Dashboard manages multiple projects from a single file. Powerful integration with other ConceptDraw products makes project management easier than ever before.
Delivers a rich set of built-in functionalities and optional product extensions that support your daily workflow in time-saving and creative ways.
These videos provide a series of lessons that will enhance the understanding of all our users, from people just starting out with the software, through to expert users.
Separated into categories of Basic, Intermediate, and Advanced categories, the new instructional videos cover a huge breadth of topics. Users new to ConceptDraw PROJECT will find the Basic lessons an essential platform for familiarizing themselves with the ′s functions. Experienced users will benefit from the Intermediate and Advanced lessons, learning to take advantage of the program′s full capabilities and unlock its true potential.
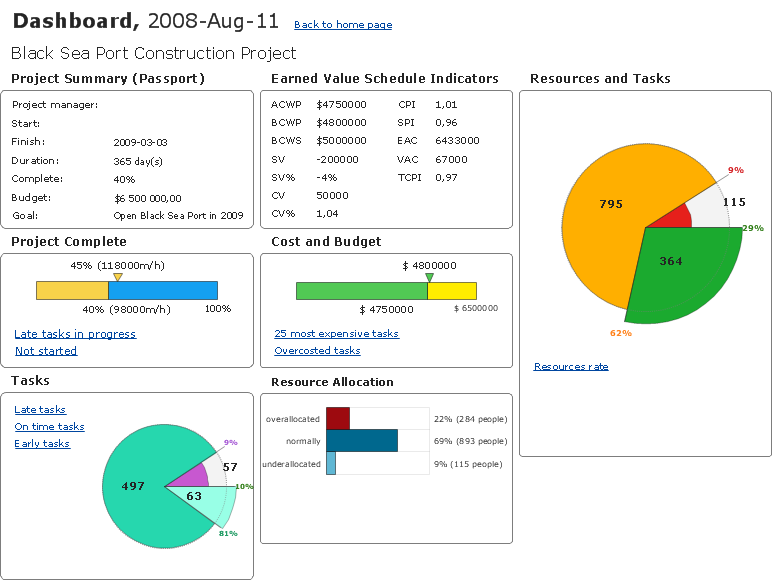
ConceptDraw PROJECT contains an extensive tool set to help project managers. The rich data visualization capability that is provided by ConceptDraw products helps you create project dashboards, one-click reports, multi-project views, Gantt charts, and resource views.
Let′s learn how to get maximum value using ConceptDraw PROJECT !
Here′s some feedback from a customer:
"The documentation behind ConceptDraw Office 2, both online and via the Help system is clear and comprehensive. Also, Odessa is developing a robust set of video tutorials for its website. These are particularly well done and helpful. ...I′ve learned over the years that some of the best software for the Mac comes from the shores of the Black Sea. My compliments to your entire team there."
Ric Getter,
Senior Editor,
MacDirectory Magazine
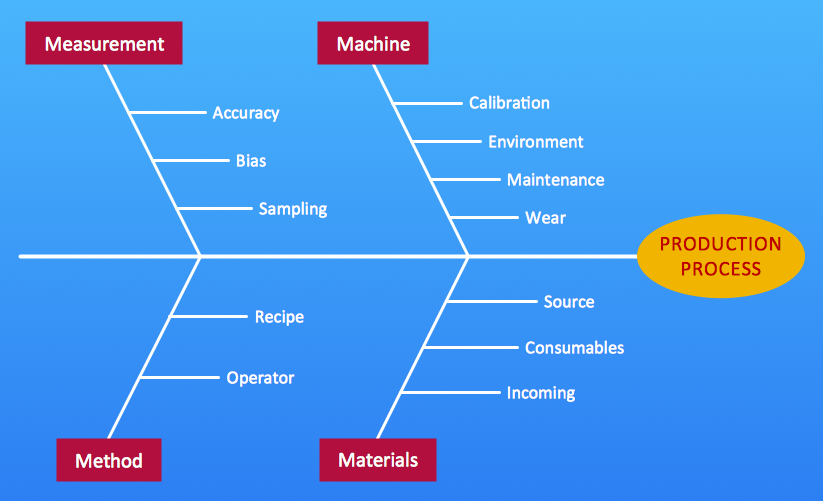
The Total Quality Management Diagram solution helps you and your organization visualize business and industrial processes. Create Total Quality Management diagrams for business process with ConceptDraw software.
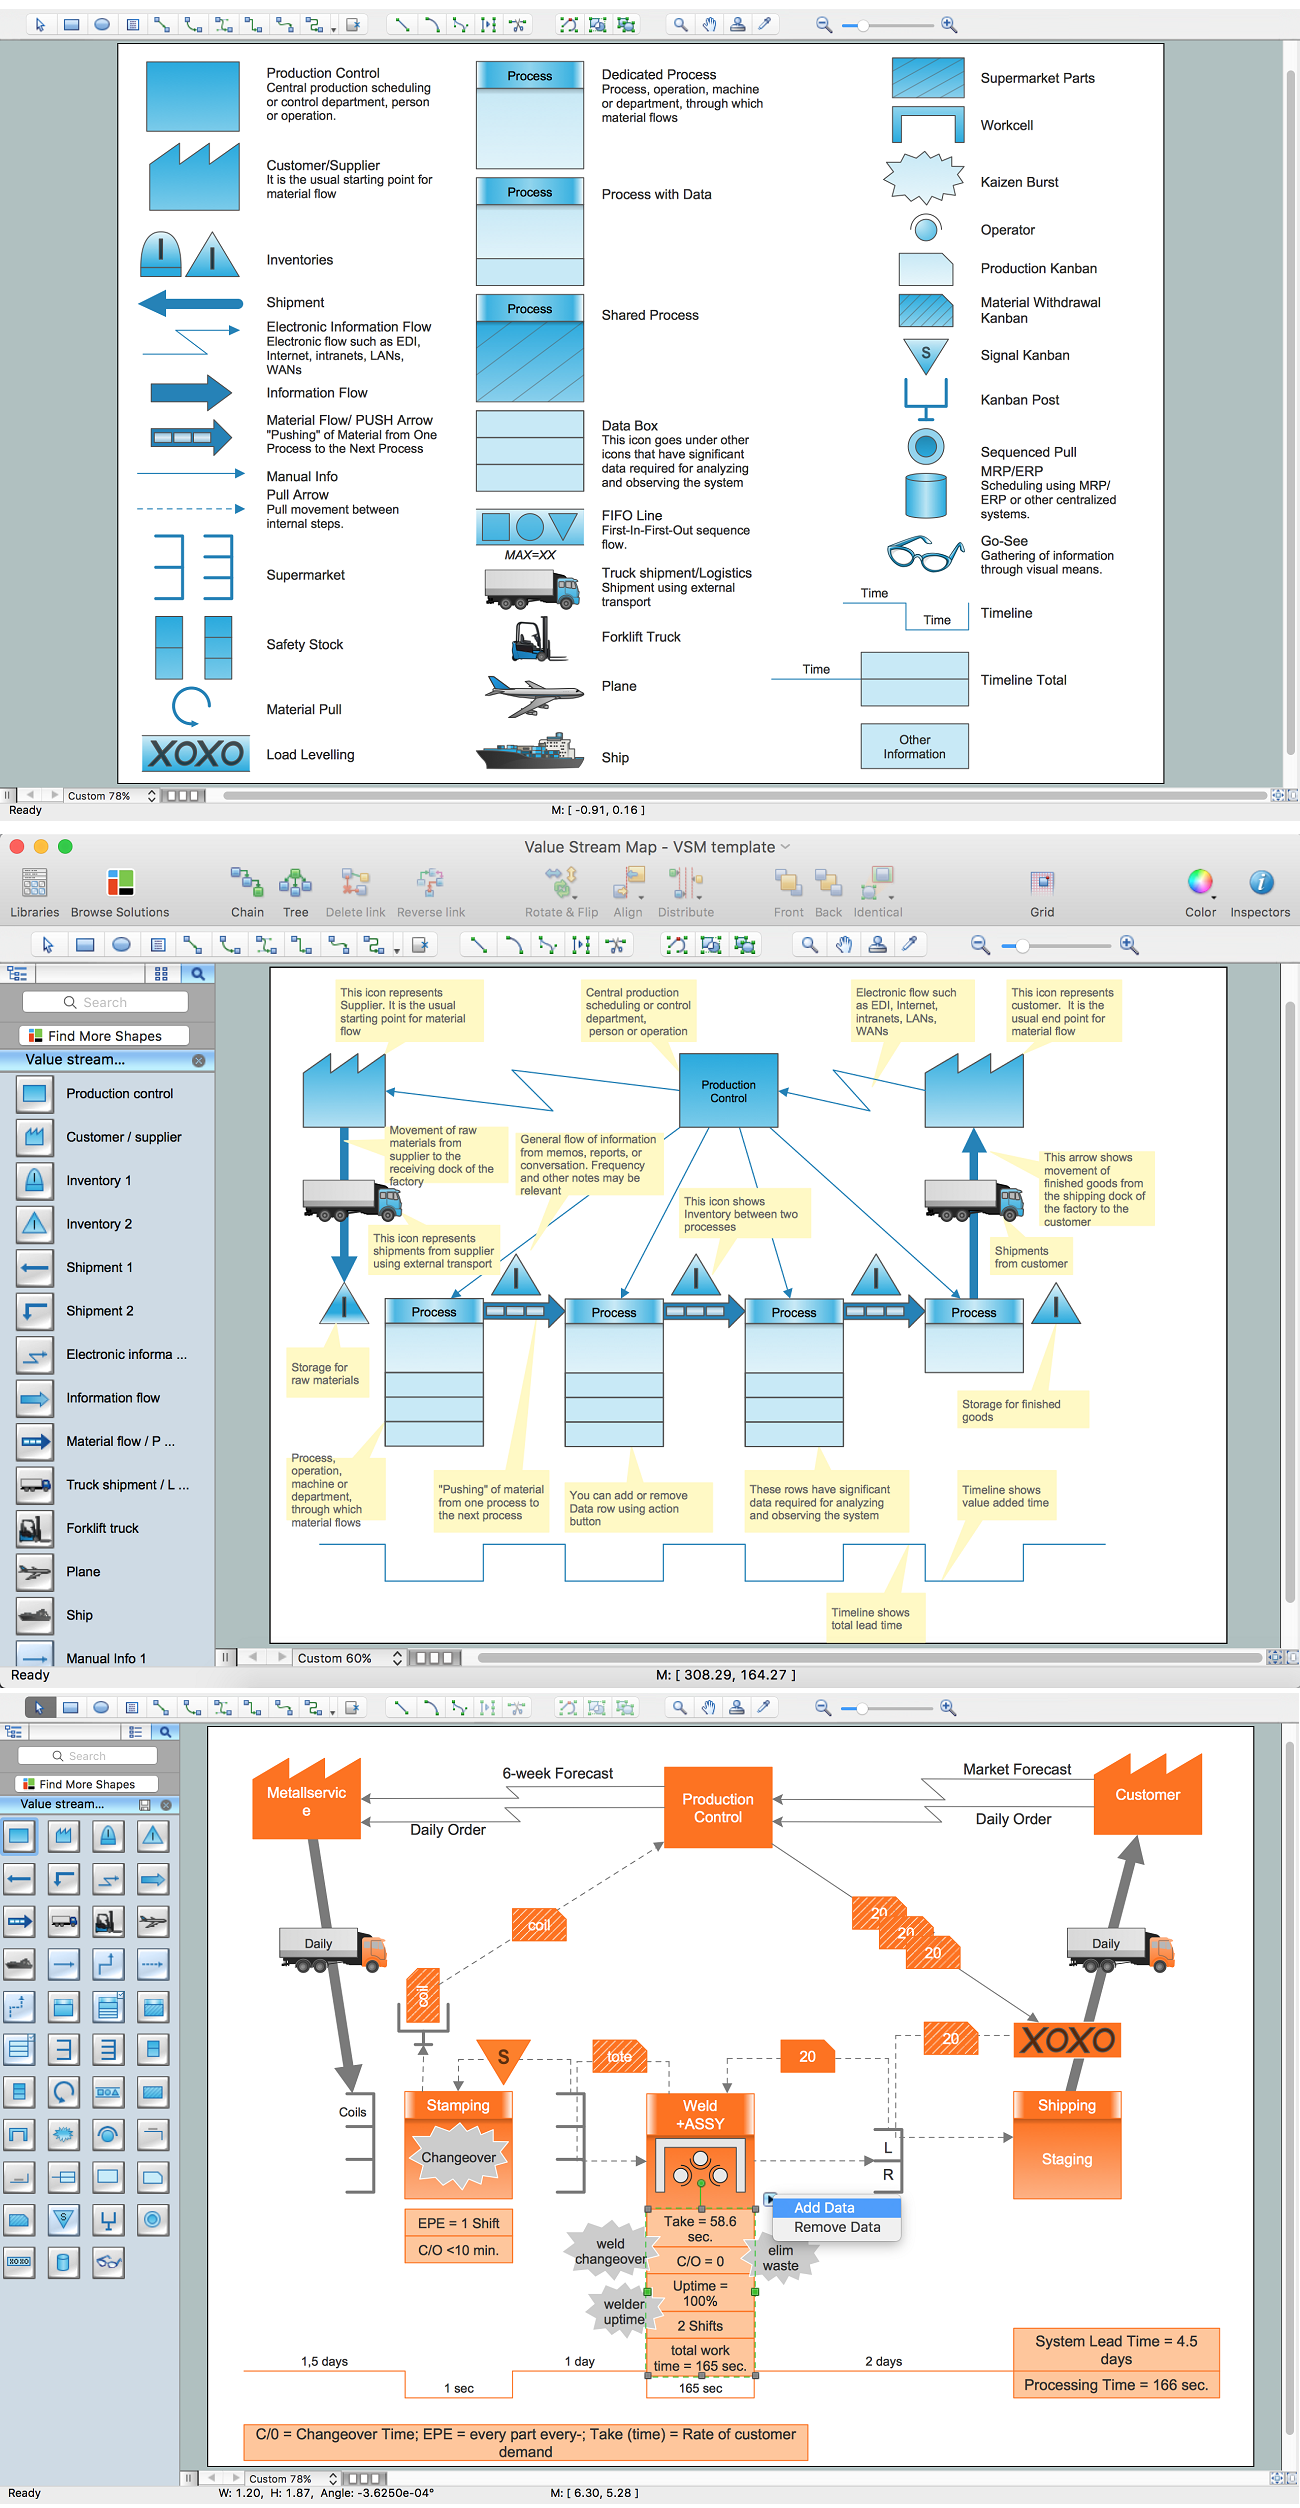
Create value stream maps - for value stream analysis and value stream management, material and information flow mapping, using our quick start templates included with ConceptDraw.
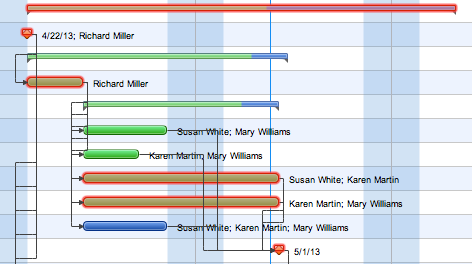
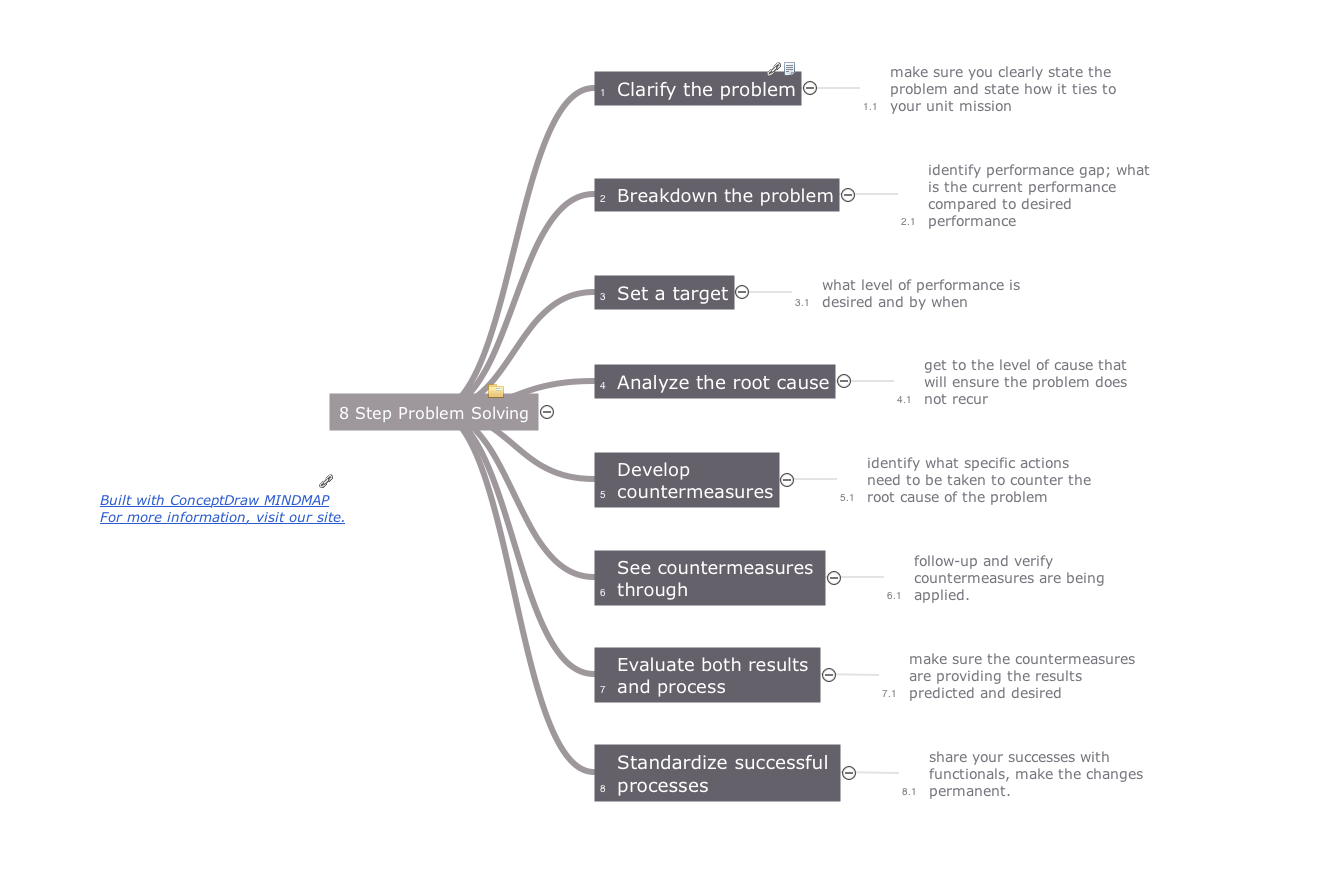
PM Made Easy allows you to plan and execute projects using mind mapping techniques, implement planning using mind mapping, and track tasks using ConceptDraw Project.
ConceptDraw MINDMAP with Quality mindmaps solution as a demonstration of the creative approach to quality management in daily work of quality management team.
This sample shows the UML Class Diagram that was created in ConceptDraw DIAGRAM on the Mac and then was opened for editing in MS Visio.
Using the 13 libraries of the Rapid UML Solution for ConceptDraw DIAGRAM you can create your own visual vector UML diagrams quick and easy.
ConceptDraw MINDMAP has a addition to the ConceptDraw Solution Park that provides a creative approach to visualizing quality processes, Quality Mind Map Solution.
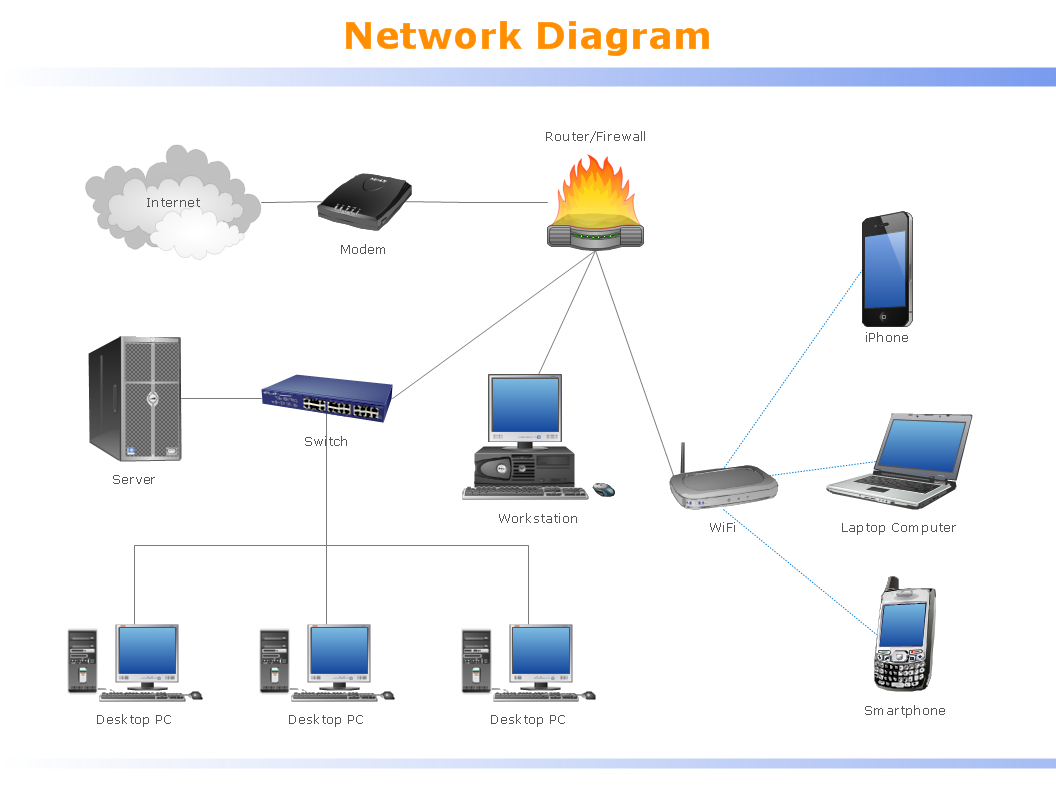
Computer networks nowadays are spread all across the world. The large number of parameters, such as geographic scale or communication protocols, can divide networks. One of the most common types of networks is called local area network (LAN). It convenient to represent network examples by means of diagrams.
This local area network (LAN) diagram provides an easy way to see the way the devices in a local network are interacted. The diagram uses a library containing specific symbols to represent network equipment , media and the end-user devices such as computers (PC, mac, laptop) , network printer, hubs, server and finally a modem. There are two types of network topologies: physical and logical. The current diagram represents precisely a physical type of LAN topology because it refers to the physical layout of a local network equipment.
A workflow diagram is less general notation than a process flow diagram. Workflow as a term can apply to organizational process which involves people, resources, documents, sort of data, for instance; whereas a process is general collection of steps occuring in any sort of activity. That is why process flow diagram can be used as workflow diagram to describe business process, data flow or department interactions.
The fastest way to create a workflow diagram is using pre-designed workflow template. ConceptDraw DIAGRAM with the Workflow Diagrams solution delivers rich set of workflow diagram templates you may start from.