Visualize Stakeholder Analysis with Onion Diagram
“Stakeholder analysis in conflict resolution, project management, and business administration, is the process of identifying the individuals or groups that are likely to affect or be affected by a proposed action, and sorting them according to their impact on the action and the impact the action will have on them. This information is used to assess how the interests of those stakeholders should be addressed in a project plan, policy, program, or other action. Stakeholder analysis is a key part of stakeholder management. A stakeholder analysis of an issue consists of weighing and balancing all of the competing demands on a firm by each of those who have a claim on it, in order to arrive at the firm's obligation in a particular case. A stakeholder analysis does not preclude the interests of the stakeholders overriding the interests of the other stakeholders affected, but it ensures that all affected will be considered.”
[from Wikipedia]
Use the ConceptDraw DIAGRAM diagramming and vector drawing software enhanced with powerful tools of Stakeholder Onion Diagrams Solution from the Management Area of ConceptDraw Solution Park to easy and effectively visualize stakeholder analysis.

Example 1. Visualize Stakeholder Analysis in ConceptDraw DIAGRAM /p>
Stakeholder analysis usually includes several steps, among them is studying and analysis of the subject area, defining stakeholders and relationships between them and project, and drawing Stakeholder diagram or map with purpose to visualize stakeholder analysis. Stakeholder Onion Diagrams Solution for ConceptDraw DIAGRAM is a powerful tool which will help you on each stage of these complex process.
Look at these 3 libraries included to the Stakeholder Onion Diagrams solution, you can click on any of them to enlarge. All objects which you will need for Stakeholder Onion Diagram process design, are already predesigned and ready-to-use. You can start with any of them simply dragging it from the library to your document.

Example 2. System Stakeholders Diagram
The samples you see on this page were created in ConceptDraw DIAGRAM software using the tools of Stakeholder Onion Diagrams Solution for ConceptDraw Solution Park. These Stakeholder diagrams successfully demonstrate solution's capabilities and professional results you can achieve. An experienced user spent 10 minutes creating each of them.
Use the Stakeholder Onion Diagrams Solution for ConceptDraw DIAGRAM software to visualize stakeholder analysis fast, easy and effective.
All source documents are vector graphic documents. They are available for reviewing, modifying, or converting to a variety of formats (PDF file, MS PowerPoint, MS Visio, and many other graphic formats) from the ConceptDraw STORE. The Stakeholder Onion Diagrams Solution is available for all ConceptDraw DIAGRAM users.
TEN RELATED HOW TO's:
The HR Management Software is an incredibly powerful tool for those who need to analyze or present human resource process flows in a visually effective manner.
Picture: HR Management Software
Related Solution:
VSM symbols are the best for a production process designing. The entire Value Stream Mapping method uses a graphical representation of the manufacturing process, factors' pros and cons, that all stakeholders can easily understand. Value Stream Mapping is a graphical technique that provides possibilities to improve analysis of a manufacturing process, at the stage of the transferring information or materials that required to deliver a product or service to the customer.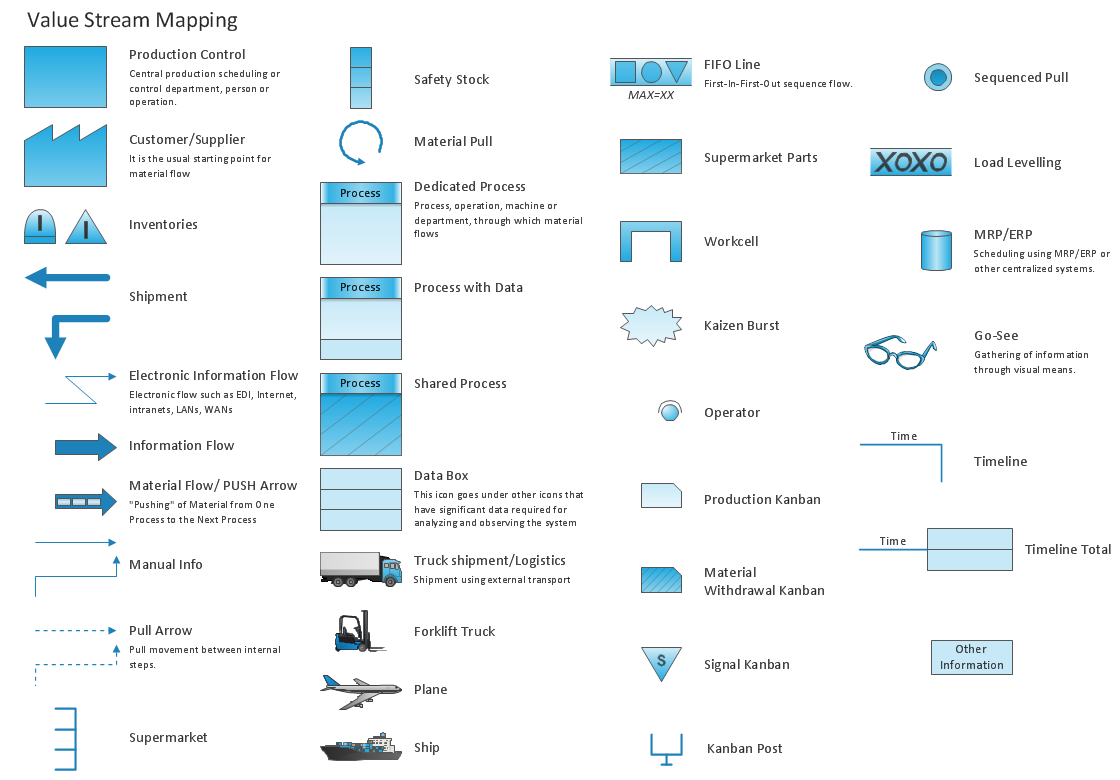
Picture: Value Stream Mapping Symbols
Related Solution:
Lean Six Sigma (LSS) is a well-known in all over the world methodology of quality improvement and business perfection. ConceptDraw DIAGRAM diagramming and vector drawing software is a powerful Lean Six Sigma Diagram Software thanks to the included Value Stream Mapping solution from the Quality Management Area of ConceptDraw Solution Park.
Picture: Lean Six Sigma Diagram Software
Related Solution:
Sometimes, when it is difficult to create a functional space plan or to rearrange existing one, the art of interior design comes in. It doesn't matter, if you need a cozy bedroom or an office layout plan, you should use appropriate tools to make your design great.
While making a floor plan of a new office it could be useful to apply some design elements such as furniture and office equipment. This diagram presents an office furniture objects that can be used for office interior design planning, or making office furniture and equipment layouts. This vector stencils library is supplied with ConceptDraw Office Layout Plans solution. It contains more then 30 vector objects of office interior for making office floor plans including an office space layout plans and furniture arrangement.
Picture: Interior Design. Office Layout Plan Design Element
Related Solution:
Using diagrams, you can visualize the flow of the information or build a detailed data structure. There's no need to have a degree in software and database design with ConceptDraw DIAGRAM , because this software has all the tools needed in developing models and diagrams. Project planning, designing and prototyping was never so easy.
This UML diagrams can be used to visualize a model of the data base development process. A UML diagram shows a graphical view of a structure of software system: components and relationships.
Using Unified Modeling Language helps to depict logical and physical elements of a data base, visually represent requirements and sub-systems. UML diagrams allows developers to organize and predict critical issues, as well as collaborate data base information.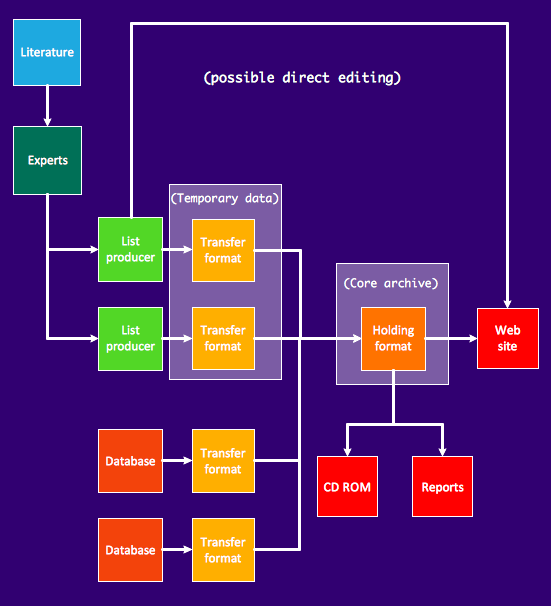
Picture: Software and Database Design with ConceptDraw DIAGRAM
Related Solution:
ConceptDraw DIAGRAM diagramming and vector drawing software offers the Business Process Diagram Solution from the Business Processes Area of ConceptDraw Solution Park with powerful tools to help you easy represent the business processes and create the business process diagrams based on BPMN 2.0 standard.
Picture: BPMN 2.0
Related Solution:
For documenting the Cloud Computing Architecture with a goal to facilitate the communication between stakeholders are successfully used the Cloud Computing Architecture diagrams. It is convenient and easy to draw various Cloud Computing Architecture diagrams in ConceptDraw DIAGRAM software with help of tools of the Cloud Computing Diagrams Solution from the Computer and Networks Area of ConceptDraw Solution Park.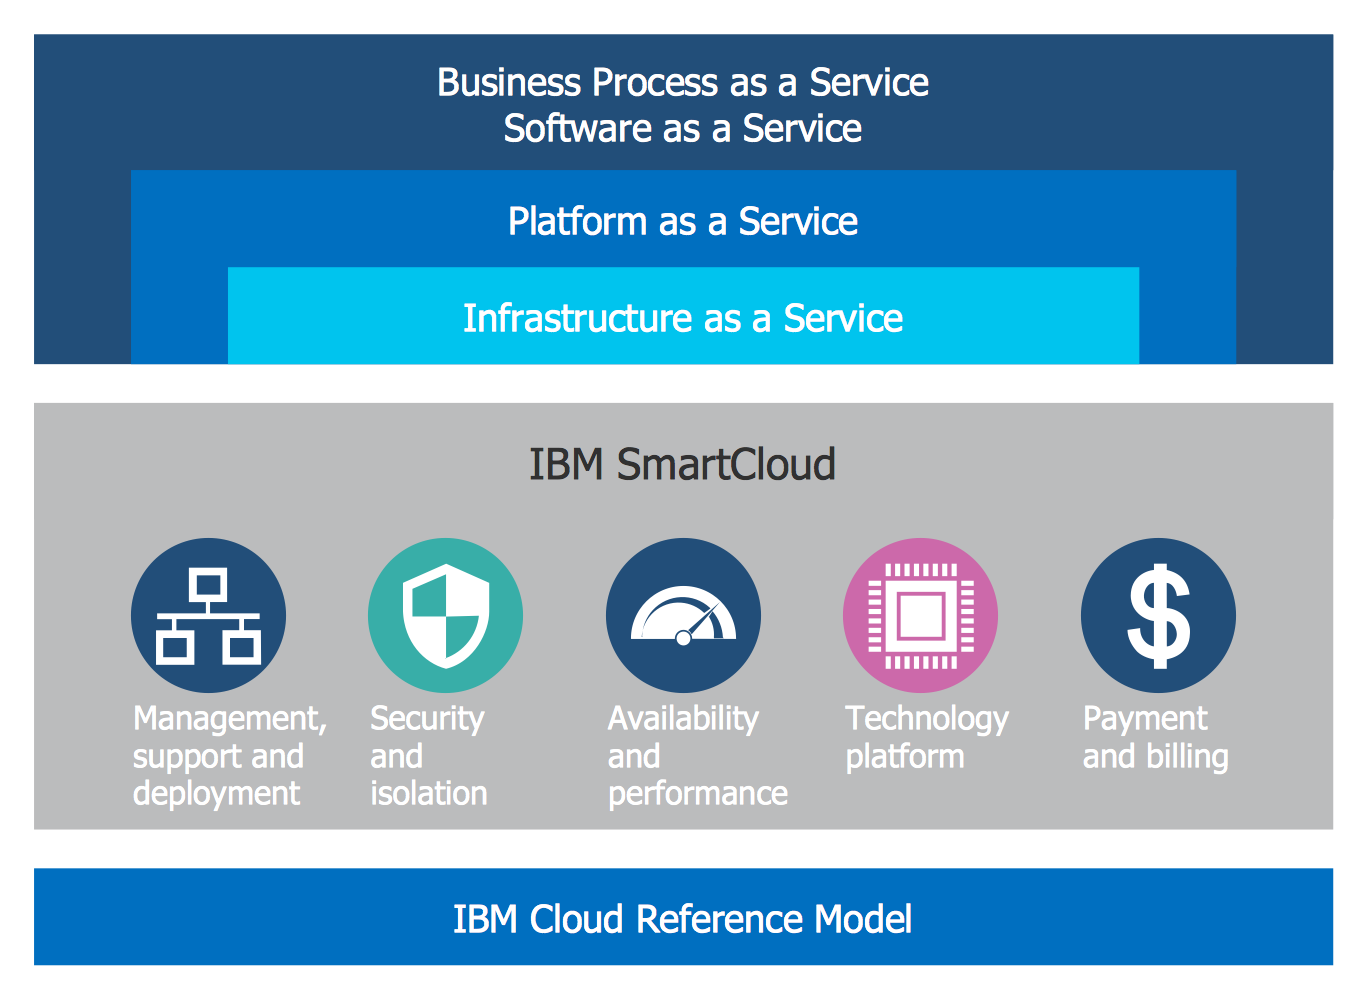
Picture: Cloud Computing Architecture Diagrams
Related Solution:


