What Is a Picture Graph?
What is a Picture Graph? It's one of the most useful way which allows explain the information, statistical data in a visual form using the pictures.
ConceptDraw DIAGRAM software extended with Picture Graphs solution from the Graphs and Charts area offers you the easiest way of Picture Graphs drawing.

Example 1. What is a Picture Graph?
Picture Graphs Solution from the Graphs and Charts area offers you the large collection of predesigned templates and samples, and library with ready-to-use vector objects that will help you design any desired Picture Graph.
How apply these tools? You have ability to create the new ConceptDraw document, drag the ready object from the Picture Graphs library and simply set your values to create a Picture Graph in minutes. If you want still more simplify your work - use the predesigned template or sample as is or quickly change it.

Example 2. Picture Graph — Increase in subscribers on YouTube to anonymous videos
This sample was created in ConceptDraw DIAGRAM using the Picture Graphs Solution and visually represents the increase in subscribers on YouTube to anonymous videos. This a very good example which excellently illustrates what is a Picture Graph. An experienced user spent 3 minutes creating this sample in ConceptDraw DIAGRAM
All source documents are vector graphic documents. They are available for reviewing, modifying, or converting to a variety of formats (PDF file, MS PowerPoint, MS Visio, and many other graphic formats) from the ConceptDraw STORE. The Picture Graphs Solution is available for all ConceptDraw DIAGRAM or later users.
TEN RELATED HOW TO's:
The Total Quality Management Diagram solution helps your organization visualize business and industrial processes. Create Total Quality Management diagrams for business process with ConceptDraw software.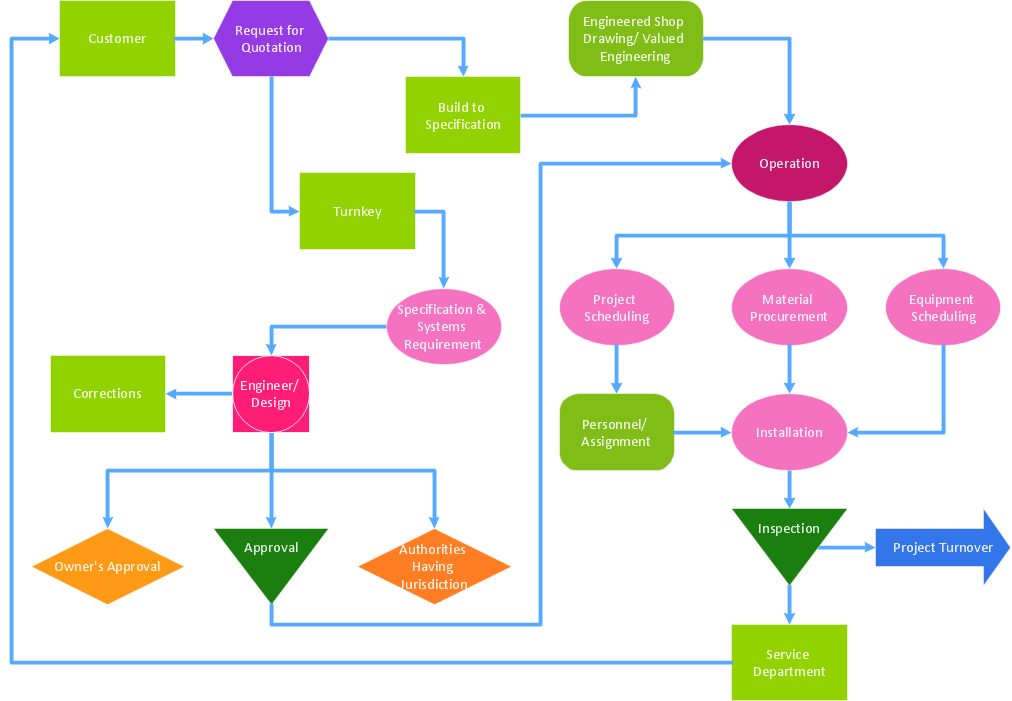
Picture: Identifying Quality Management System
Related Solution:
Different organizations have different organizational structures. Matrix organization is one of the most popular and widely used type of organizational structure. Use ConceptDraw DIAGRAM diagramming and vector drawing software extended with 25 Typical Orgcharts solution from the Management area of ConceptDraw Solution Park for fast and easy designing matrix organizational chart for your company.
Picture: Matrix Organization
Related Solution:
When thinking about data visualization, one of the first tools that comes to mind is a flowchart design. You can find flowchart symbols, shapes, stencils and icons easily on the Internet, but it might take time to systematize this information. Nevertheless, once you start flowcharting, you’ll love its simplicity and efficiency.
This diagram consists from standard flowchart symbols, approved by ANSI (American National Standard Institute) for drawing flowcharts. A flowchart is a diagram that represents a step-by-step algorithm of any process, displaying the process stages as boxes that are connected with arrows. Flowchart design makes it clear and readable.
Flowchart designed using ConceptDraw DIAGRAM flowchart software allows to make attractive and clear process presentation, it makes interpretation of the business process flow fresh and versatile. Great flowchart design view is a big advantage over the diagram created manually on a paper.
Picture: Flowchart Design: Principles, Layout, Symbols and Best Practices
Related Solution:
While creating flowcharts and process flow diagrams, you should use special objects to define different statements, so anyone aware of flowcharts can get your scheme right. There is a short and an extended list of basic flowchart symbols and their meaning. Basic flowchart symbols include terminator objects, rectangles for describing steps of a process, diamonds representing appearing conditions and questions and parallelograms to show incoming data.
This diagram gives a general review of the standard symbols that are used when creating flowcharts and process flow diagrams. The practice of using a set of standard flowchart symbols was admitted in order to make flowcharts and other process flow diagrams created by any person properly understandable by other people. The flowchart symbols depict different kinds of actions and phases in a process. The sequence of the actions, and the relationships between them are shown by special lines and arrows. There are a large number of flowchart symbols. Which of them can be used in the particular diagram depends on its type. For instance, some symbols used in data flow diagrams usually are not used in the process flowcharts. Business process system use exactly these flowchart symbols.
Picture: Flowchart Symbols: Meaning and Examples
Related Solution:
There are many tools to manage a process or to illustrate an algorithm or a workflow. Flowcharting is one of those tools. However, it may be difficult to show complex processes that require multiple attributes or several people in a simple flowchart, so a cross-functional flowchart would be a solution for that situation. To create such flowchart, group processes and steps to labeled rows or columns, and divide those groups with horizontal or vertical parallel lines. It is worth mentioning that there are different types of cross-functional flowcharts, like opportunity or deployment flowchart.
This diagram shows a cross-functional flowchart that was made for a trading process. It contains 14 processes, distributed through 5 lines depicting the participants who interact with the process. Also there are connectors that show the data flow of information between processes. The cross-functional flowchart displays a detailed model of the trading process, as well as all participants in the process and how they interact with each other. The lines in the flowchart indicates the position, department and role of the trading process participants.
Picture: Cross-Functional Flowchart
Related Solution:
Sample Pictorial Chart - Pictorial Infographics solution provides easy-to-use design infographics drawing tools, large collection of different sample infographics and infograms, sample pictorial chart and templates to be filled in, and 10 libraries with great quantity of predesigned vector pictograms.
Use Pictorial Infographics solution to draw your own design pictorial infographics documents quick and easy.
Picture: Sample Pictorial Chart. Sample Infographics
Related Solution:
Do you like the professional schemes that you can find on the Internet? Take into account that the most part of them is made using the Best Flowchart Software and Flowchart Symbols. Try you own powers in creating such diagrams!
Flowcharts are the most business diagramming tool. If you are a business manager, you can use flow chart to depict work flow in your organization, develop the effective organizational structure and present the information to investors or other stakeholders. Combining the smart management solutions with ConceptDraw DIAGRAM diagramming engine delivers the set of comprehensive flowchart tools necessary to support professionals in their creativeness and business activity.
Picture: Best Flowchart Software and Flowchart Symbols
Related Solution:
You have some interesting design home office ideas and you want to inscribe them as soon as possible? ConceptDraw DIAGRAM software extended with Office Layout Plans Solution from the Building Plans Area will help you.
Picture: Home Office Ideas
Related Solution:
An integrated circuit (IC) is a chip or microchip that consists of a substrate created from semiconductor material and thousands or millions of tiny electronic components installed on it. ConceptDraw DIAGRAM software with included Digital Electronics solution allows you to choose from an enormous number of vector electrical symbols, integrated circuits, logic gates, connections, flip flop symbols. Collection of the pre-made symbols and also an included set of professionally designed samples are useful to create Integrated circuit schematics of various kinds in minutes.
Picture: Integrated Circuit
Interactive Voice Response (IVR) is a system of the prerecorded voice messages that allows a computer to interact with humans. IVR performs the function of the routing calls within a call center, using the information entered by the customer on the phone keypad in the touchtone mode.
This example was created in ConceptDraw DIAGRAM using the Computer and Networks Area of ConceptDraw Solution Park and show the Interactive Voice Response (IVR) network.
Picture: Interactive voice response (IVR) networks. Computer and Network Examples
Related Solution:
